There's more to volatility than volume - Santa Fe Institute
There's more to volatility than volume - Santa Fe Institute
There's more to volatility than volume - Santa Fe Institute

Create successful ePaper yourself
Turn your PDF publications into a flip-book with our unique Google optimized e-Paper software.
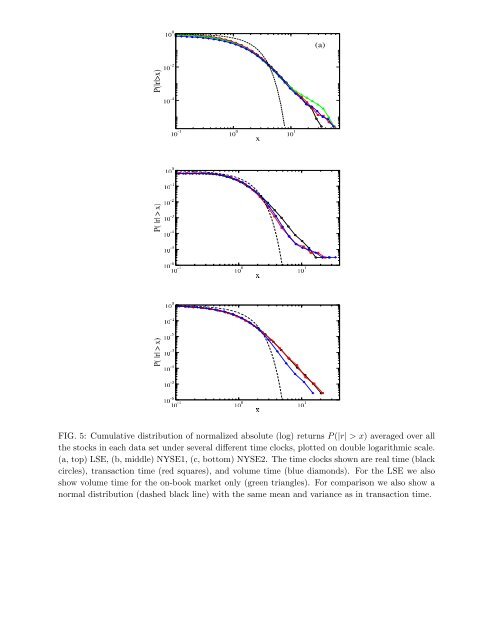
FIG. 5: Cumulative distribution of normalized absolute (log) returns P (|r| > x) averaged over all<br />
the s<strong>to</strong>cks in each data set under several different time clocks, plotted on double logarithmic scale.<br />
(a, <strong>to</strong>p) LSE, (b, middle) NYSE1, (c, bot<strong>to</strong>m) NYSE2. The time clocks shown are real time (black<br />
circles), transaction time (red squares), and <strong>volume</strong> time (blue diamonds). For the LSE we also<br />
show <strong>volume</strong> time for the on-book market only (green triangles). For comparison we also show a<br />
normal distribution (dashed black line) with the same mean and variance as in transaction time.