There's more to volatility than volume - Santa Fe Institute
There's more to volatility than volume - Santa Fe Institute
There's more to volatility than volume - Santa Fe Institute

Create successful ePaper yourself
Turn your PDF publications into a flip-book with our unique Google optimized e-Paper software.
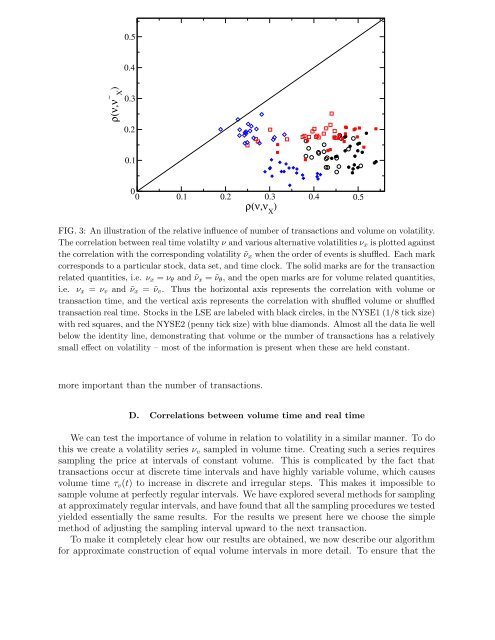
FIG. 3: An illustration of the relative influence of number of transactions and <strong>volume</strong> on <strong>volatility</strong>.<br />
The correlation between real time volatilty ν and various alternative volatilities ν x is plotted against<br />
the correlation with the corresponding <strong>volatility</strong> ˜ν x when the order of events is shuffled. Each mark<br />
corresponds <strong>to</strong> a particular s<strong>to</strong>ck, data set, and time clock. The solid marks are for the transaction<br />
related quantities, i.e. ν x = ν θ and ˜ν x = ˜ν θ , and the open marks are for <strong>volume</strong> related quantities,<br />
i.e. ν x = ν v and ˜ν x = ˜ν v . Thus the horizontal axis represents the correlation with <strong>volume</strong> or<br />
transaction time, and the vertical axis represents the correlation with shuffled <strong>volume</strong> or shuffled<br />
transaction real time. S<strong>to</strong>cks in the LSE are labeled with black circles, in the NYSE1 (1/8 tick size)<br />
with red squares, and the NYSE2 (penny tick size) with blue diamonds. Almost all the data lie well<br />
below the identity line, demonstrating that <strong>volume</strong> or the number of transactions has a relatively<br />
small effect on <strong>volatility</strong> – most of the information is present when these are held constant.<br />
<strong>more</strong> important <strong>than</strong> the number of transactions.<br />
D. Correlations between <strong>volume</strong> time and real time<br />
We can test the importance of <strong>volume</strong> in relation <strong>to</strong> <strong>volatility</strong> in a similar manner. To do<br />
this we create a <strong>volatility</strong> series ν v sampled in <strong>volume</strong> time. Creating such a series requires<br />
sampling the price at intervals of constant <strong>volume</strong>. This is complicated by the fact that<br />
transactions occur at discrete time intervals and have highly variable <strong>volume</strong>, which causes<br />
<strong>volume</strong> time τ v (t) <strong>to</strong> increase in discrete and irregular steps. This makes it impossible <strong>to</strong><br />
sample <strong>volume</strong> at perfectly regular intervals. We have explored several methods for sampling<br />
at approximately regular intervals, and have found that all the sampling procedures we tested<br />
yielded essentially the same results. For the results we present here we choose the simple<br />
method of adjusting the sampling interval upward <strong>to</strong> the next transaction.<br />
To make it completely clear how our results are obtained, we now describe our algorithm<br />
for approximate construction of equal <strong>volume</strong> intervals in <strong>more</strong> detail. To ensure that the