There's more to volatility than volume - Santa Fe Institute
There's more to volatility than volume - Santa Fe Institute
There's more to volatility than volume - Santa Fe Institute

You also want an ePaper? Increase the reach of your titles
YUMPU automatically turns print PDFs into web optimized ePapers that Google loves.
<strong>volatility</strong> market a b d (×100) R 2 (×100)<br />
NYSE1 0.15 ± 0.10 0.76 ± 0.20 1.4 61<br />
ν θ NYSE2 −0.27 ± 0.11 1.34 ± 0.14 0.76 82<br />
LSE 0.26 ± 0.11 0.65 ± 0.15 1.1 52<br />
NYSE1 0.46 ± 0.12 0.35 ± 0.19 1.4 16<br />
ν v NYSE2 0.17 ± 0.23 0.75 ± 0.29 2.0 27<br />
LSE 0.25 ± 0.16 0.67 ± 0.21 1.6 37<br />
NYSE1 0.65 ± 0.18 −0.03 ± 0.25 4.0 8.3 10 −2<br />
˜ν θ NYSE2 0.59 ± 0.29 0.03 ± 0.35 13 4.6 10 −2<br />
LSE 0.47 ± 0.12 0.19 ± 0.16 10 8.1<br />
NYSE1 0.67 ± 0.18 −0.04 ± 0.26 3.2 1.2 10 −1<br />
˜ν v NYSE2 1.11 ± 0.25 −0.52 ± 0.31 7.3 14<br />
LSE 0.64 ± 0.11 −0.18 ± 0.15 18 7.5<br />
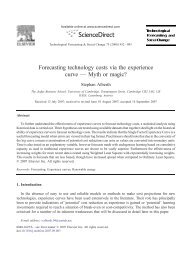
TABLE II: A summary of results comparing Hurst exponents for alternative volatilities <strong>to</strong> real time<br />
<strong>volatility</strong>. We perform regressions on the results in Figure 9 of the form H (a)<br />
i = a + bH (r)<br />
i , where<br />
is an alternative Hurst exponent and H (r)<br />
i is the Hurst exponent for real time <strong>volatility</strong> for the<br />
H (a)<br />
i<br />
i th s<strong>to</strong>ck. We do this for each data set and each of the exponents H(ν θ ) (transaction time), H(˜ν θ )<br />
(shuffled transaction real time), H(ν v ) (<strong>volume</strong> time), and H(˜ν v ) (shuffled <strong>volume</strong> real time). d is<br />
the average distance <strong>to</strong> the identity line H (a)<br />
i = H (r)<br />
i and R 2 is the goodness of fit of the regression.<br />
We see that in the <strong>to</strong>p two rows b is positive and statistically significant in all but one case, in<br />
contrast <strong>to</strong> the bot<strong>to</strong>m two rows. This and the fact that d is much smaller in the <strong>to</strong>p two rows<br />
makes it clear that neither <strong>volume</strong> nor transactions are important causes of long-memory.<br />
It is interesting that the data set appears <strong>to</strong> be the most significant fac<strong>to</strong>r determining<br />
H. For the NYSE the real time Hurst exponents during the 1/8 tick size period are all in<br />
the range 0.62 < H < 0.73, whereas in the penny tick size period they are in the range<br />
0.77 < H < 0.83. Thus the Hurst exponents for the two periods are completely disjoint – all<br />
the values of H during the penny tick size period are higher <strong>than</strong> any of the values during<br />
the 1/8 tick size period. The LSE Hurst exponents are roughly in the middle, spanning<br />
the range 0.72 < H < 0.82. It is beyond the scope of the paper <strong>to</strong> determine why this is<br />
true, but this suggests that changes in tick size or other aspects of market structure are very<br />
important in determining the strength of the persistence of <strong>volatility</strong>.<br />
VI.<br />
CONCLUSIONS<br />
The idea that clustered <strong>volatility</strong> and heavy tails in price returns can be explained by fluctuations<br />
in transactions or <strong>volume</strong> is seductive in its simplicity. Both transaction frequency<br />
and <strong>volume</strong> are strongly positively correlated with <strong>volatility</strong>, and it is clear that fluctuations<br />
in <strong>volume</strong> (or transaction frequency) can cause both clustered <strong>volatility</strong> and heavy tails, so<br />
this might seem <strong>to</strong> be an open and shut case. Our main result in this paper is <strong>to</strong> show that<br />
this is not true, at least for the data that we have studied here. For these data the effects of<br />
<strong>volume</strong> and transaction frequency are dominated by other effects. We have shown this for<br />
three different properties, the contemporaneous relationship with the size of price changes,<br />
the long-memory properties of <strong>volatility</strong>, and the distribution of returns. The results have<br />
been verified with three different large data sets, with tens of millions of transactions, and