There's more to volatility than volume - Santa Fe Institute
There's more to volatility than volume - Santa Fe Institute
There's more to volatility than volume - Santa Fe Institute

Create successful ePaper yourself
Turn your PDF publications into a flip-book with our unique Google optimized e-Paper software.
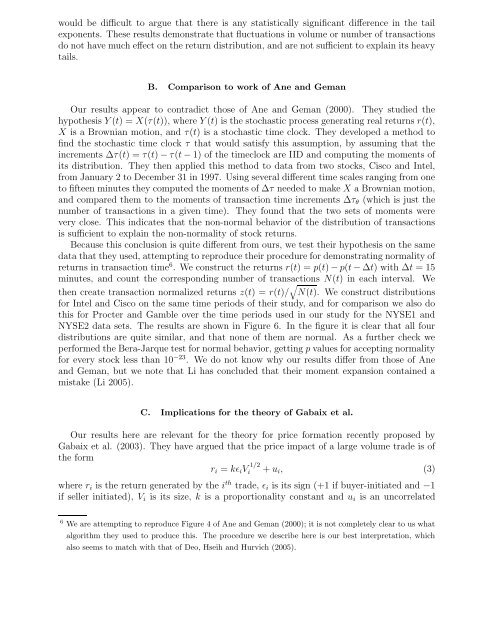
would be difficult <strong>to</strong> argue that there is any statistically significant difference in the tail<br />
exponents. These results demonstrate that fluctuations in <strong>volume</strong> or number of transactions<br />
do not have much effect on the return distribution, and are not sufficient <strong>to</strong> explain its heavy<br />
tails.<br />
B. Comparison <strong>to</strong> work of Ane and Geman<br />
Our results appear <strong>to</strong> contradict those of Ane and Geman (2000). They studied the<br />
hypothesis Y (t) = X(τ(t)), where Y (t) is the s<strong>to</strong>chastic process generating real returns r(t),<br />
X is a Brownian motion, and τ(t) is a s<strong>to</strong>chastic time clock. They developed a method <strong>to</strong><br />
find the s<strong>to</strong>chastic time clock τ that would satisfy this assumption, by assuming that the<br />
increments ∆τ(t) = τ(t) − τ(t − 1) of the timeclock are IID and computing the moments of<br />
its distribution. They then applied this method <strong>to</strong> data from two s<strong>to</strong>cks, Cisco and Intel,<br />
from January 2 <strong>to</strong> December 31 in 1997. Using several different time scales ranging from one<br />
<strong>to</strong> fifteen minutes they computed the moments of ∆τ needed <strong>to</strong> make X a Brownian motion,<br />
and compared them <strong>to</strong> the moments of transaction time increments ∆τ θ (which is just the<br />
number of transactions in a given time). They found that the two sets of moments were<br />
very close. This indicates that the non-normal behavior of the distribution of transactions<br />
is sufficient <strong>to</strong> explain the non-normality of s<strong>to</strong>ck returns.<br />
Because this conclusion is quite different from ours, we test their hypothesis on the same<br />
data that they used, attempting <strong>to</strong> reproduce their procedure for demonstrating normality of<br />
returns in transaction time 6 . We construct the returns r(t) = p(t) − p(t − ∆t) with ∆t = 15<br />
minutes, and count the corresponding number of transactions √ N(t) in each interval. We<br />
then create transaction normalized returns z(t) = r(t)/ N(t). We construct distributions<br />
for Intel and Cisco on the same time periods of their study, and for comparison we also do<br />
this for Procter and Gamble over the time periods used in our study for the NYSE1 and<br />
NYSE2 data sets. The results are shown in Figure 6. In the figure it is clear that all four<br />
distributions are quite similar, and that none of them are normal. As a further check we<br />
performed the Bera-Jarque test for normal behavior, getting p values for accepting normality<br />
for every s<strong>to</strong>ck less <strong>than</strong> 10 −23 . We do not know why our results differ from those of Ane<br />
and Geman, but we note that Li has concluded that their moment expansion contained a<br />
mistake (Li 2005).<br />
C. Implications for the theory of Gabaix et al.<br />
Our results here are relevant for the theory for price formation recently proposed by<br />
Gabaix et al. (2003). They have argued that the price impact of a large <strong>volume</strong> trade is of<br />
the form<br />
r i = kɛ i V 1/2<br />
i + u i , (3)<br />
where r i is the return generated by the i th trade, ɛ i is its sign (+1 if buyer-initiated and −1<br />
if seller initiated), V i is its size, k is a proportionality constant and u i is an uncorrelated<br />
6 We are attempting <strong>to</strong> reproduce Figure 4 of Ane and Geman (2000); it is not completely clear <strong>to</strong> us what<br />
algorithm they used <strong>to</strong> produce this. The procedure we describe here is our best interpretation, which<br />
also seems <strong>to</strong> match with that of Deo, Hseih and Hurvich (2005).