There's more to volatility than volume - Santa Fe Institute
There's more to volatility than volume - Santa Fe Institute
There's more to volatility than volume - Santa Fe Institute

You also want an ePaper? Increase the reach of your titles
YUMPU automatically turns print PDFs into web optimized ePapers that Google loves.
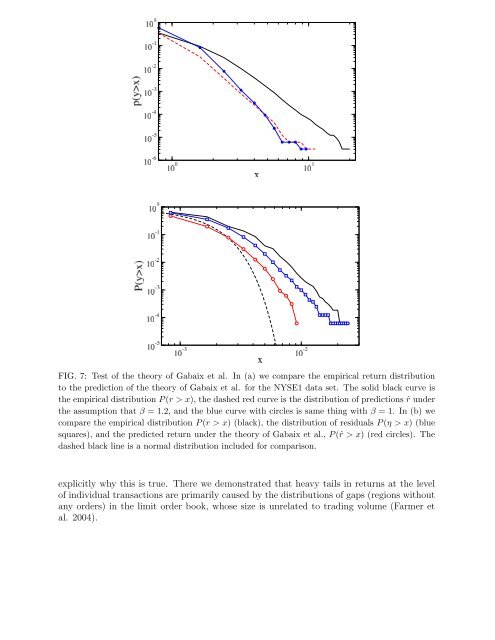
FIG. 7: Test of the theory of Gabaix et al. In (a) we compare the empirical return distribution<br />
<strong>to</strong> the prediction of the theory of Gabaix et al. for the NYSE1 data set. The solid black curve is<br />
the empirical distribution P (r > x), the dashed red curve is the distribution of predictions ˆr under<br />
the assumption that β = 1.2, and the blue curve with circles is same thing with β = 1. In (b) we<br />
compare the empirical distribution P (r > x) (black), the distribution of residuals P (η > x) (blue<br />
squares), and the predicted return under the theory of Gabaix et al., P (ˆr > x) (red circles). The<br />
dashed black line is a normal distribution included for comparison.<br />
explicitly why this is true. There we demonstrated that heavy tails in returns at the level<br />
of individual transactions are primarily caused by the distributions of gaps (regions without<br />
any orders) in the limit order book, whose size is unrelated <strong>to</strong> trading <strong>volume</strong> (Farmer et<br />
al. 2004).