Sustainability Report - Bank Sarasin-Alpen
Sustainability Report - Bank Sarasin-Alpen
Sustainability Report - Bank Sarasin-Alpen

Create successful ePaper yourself
Turn your PDF publications into a flip-book with our unique Google optimized e-Paper software.
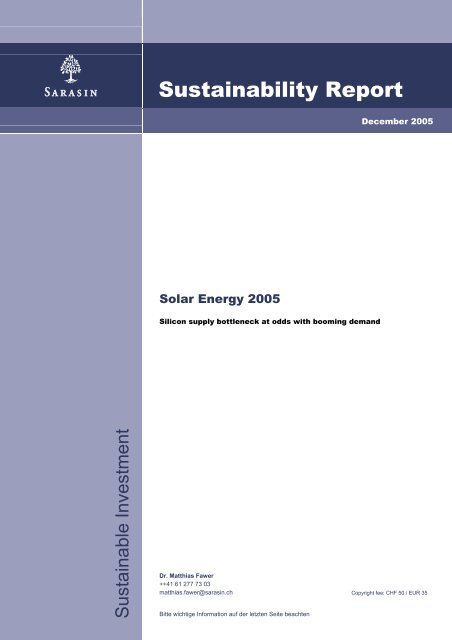
<strong>Sustainability</strong> <strong>Report</strong><br />
December 2005<br />
Solar Energy 2005<br />
Silicon supply bottleneck at odds with booming demand<br />
Sustainable Investment<br />
Dr. Matthias Fawer<br />
++41 61 277 73 03<br />
matthias.fawer@sarasin.ch<br />
Bitte wichtige Information auf der letzten Seite beachten<br />
Copyright fee: CHF 50 / EUR 35
Solar Energy 2005<br />
Contents<br />
Contents 3<br />
Executive Summary 3<br />
Introduction 6<br />
Photovoltaics (PV) 8<br />
Silicon supply 8<br />
Wafer production 11<br />
Solar cells 12<br />
The major PV markets 18<br />
PV market trends up to 2020 26<br />
Assessing the sustainability of PV systems 29<br />
Solar collectors 31<br />
Leading players in solar thermal power 31<br />
Principal global markets 34<br />
Market trends in Europe 38<br />
Global market trends up to 2020 42<br />
Solar-assisted cooling 43<br />
Solar thermal power stations 45<br />
Fields of application 45<br />
Existing plants and planned projects 45<br />
Market outlook 48<br />
Contacts 52<br />
Publications 53
Acknowledgements<br />
As in 2004, this year’s solar energy report was produced in collaboration with<br />
c4c-concepts for carbon in Berne.<br />
For the chapter on solar collectors we were once again able to rely on professional<br />
support and extensive data material from Werner Koldehoff.<br />
We are also grateful for a number of short articles (grey shaded inserts) contributed<br />
by the following experts:<br />
<br />
Felix Holz, Fraunhofer ISE, Institut Solare Energiesysteme, Head of Group<br />
Off-Grid Power Supply Systems, Freiburg (Germany).<br />
We would also like to thank the following organisations and persons for their professional<br />
advice and provision of useful information:<br />
<br />
<br />
<br />
<br />
<br />
Pius Hüsser, managing director of Nova Energie GmbH and member of the<br />
IEA-PVPS (Photovoltaic Power Systems) Programme, Task 1;<br />
Gerhard Stryi-Hipp, managing director of Germany’s national association for<br />
the solar industry, Bundesverband Solarindustrie (BSi);<br />
Professor Peter Woditsch, management board spokesman of Deutsche Solar<br />
AG;<br />
Raffaele Piria and Uwe Brechlin, managing directors of European Solar<br />
Thermal Industry Federation (ESTIF);<br />
Dr. Michael Geyer, executive secretary of IEA SolarPACES.
Solar Energy 2005<br />
Executive Summary<br />
Photovoltaics<br />
Last year global photovoltaic (PV) cell production rocketed more than 60%,<br />
from 750 MW in 2003 to well over 1,200 MW. The fifteen biggest PV cell manufacturers<br />
were responsible for roughly 90% of the total production volume.<br />
Fears of a world wide silicon shortage came true, and this has already curbed<br />
the rate of growth in 2004. New agreements have been reached between the<br />
photovoltaics industry and silicon manufacturers to increase production capacities<br />
for solar-grade silicon, and these capacities should come on stream during<br />
the course of 2008. But even then the supply bottleneck will not be fully removed.<br />
In future we are bound to see ingot and wafer producers enter into more<br />
joint ventures with silicon manufacturers in an attempt to ensure their own silicon<br />
requirements are met.<br />
This persistent shortage will force companies to develop new processes that<br />
consume fewer materials. These efficiency improvements will have a positive<br />
impact on costs. Except for a number of niche applications, photovoltaics will<br />
continue to rely on government subsidies, however. Apart from the three biggest<br />
markets of Germany, Japan and the US, other countries now have substantial<br />
programmes in place to promote solar energy, including Spain, China, India, Italy,<br />
Portugal, South Korea and Thailand.<br />
In 2004 the amount of PV capacity installed worldwide came to 840 MW,<br />
which corresponds to around two-thirds of solar cell production. This is equivalent<br />
to 40% growth on last year. Germany’s installed capacity (360 MW) overtook<br />
Japan’s (270 MW) for the first time, mainly thanks to the higher feed-in tariffs.<br />
The uncertainty in the German market about possible cuts in these generous tariffs<br />
has been allayed following the recent elections. No changes are expected<br />
until 2007 at the earliest, when the Renewable Energy Act (EEG) comes up for<br />
regular renewal.<br />
In the coming years the markets that currently dominate will become less important<br />
in relative terms. According to our estimates, Germany’s share of the global<br />
market, for example, will drop from its current level of 43% to just 6% in 2020.<br />
Within Europe, Spain is becoming increasingly important, while in Asia the big<br />
markets include not only China and India, but now also Thailand and South Korea.<br />
The fact that more than two billion people in the world still have no access to<br />
mains electricity clearly demonstrates the enormous potential of photovoltaics in<br />
future. In the longer term, off-grid applications are more compatible with the sustainable<br />
character of photovoltaics than heavily subsidised megawatt installations<br />
built on greenfield sites industrialised countries. There is thus a pressing<br />
need to push ahead more with supplying electricity in Africa, Asia and elsewhere,<br />
before photovoltaics comes up against its limits in the western world.<br />
Another challenge for photovoltaics is the avoidance of hazardous substances<br />
such as lead and cadmium in the manufacture of PV installations, and the establishment<br />
of take-back systems for equipment that has reached the end of its<br />
working life. As a form of renewable energy that still has a spotless “green im-<br />
Dezember 2005 3
Solar Energy 2005<br />
age”, and given its explosive rate of growth, the solar industry would do well to<br />
be proactive in anticipating certain legislative trends and collaborating as an industry<br />
in effective solutions at an early stage.<br />
For years now, our forecasts for the future growth of the PV market have been<br />
rather conservative compared with other market estimates. Given the shortage<br />
of silicon, however, we think our more cautious stance is justified for the coming<br />
two to three years. For the longer term, however, we have increased our previous<br />
forecasts and now estimate that newly installed global capacity will climb to<br />
around 3,000 MW by 2010. This is equivalent to an average annual growth rate<br />
of 24% for the period 2004 to 2010, and 18% for the following decade (2011-<br />
2020).<br />
Solar collectors<br />
Soaring oil and gas prices mean that more public attention is now being given to<br />
solar thermal power. Hardly any other technology saves as much fossil fuel and<br />
carbon dioxide as installations that generate solar thermal power. In many countries<br />
there has been no political and legislative support for this form of energy to<br />
date. Even so, solar thermal power already supplies more than 18 times more<br />
energy than photovoltaics at present.<br />
Worldwide more that 30% more solar collectors were installed (with a total<br />
capacity of 11,700 MW th ) in 2004 than in 2003, with roughly 75% of them in<br />
China. The dominant feature of the Chinese market is that energy is expensive<br />
and in short supply. Given this backdrop, solar-powered hot water supply for<br />
households (90% of the market) is a competitive technology purely on cost<br />
grounds.<br />
Europe’s solar thermal power market has developed well, growing by 13% in<br />
2004. The European market is still dominated by three countries, Germany,<br />
Greece and Austria, which have a combined market share of 75%. The biggest<br />
up-and-coming markets are France and Spain. Germany, Europe’s biggest market,<br />
only grew 4%. Solar thermal power seems to be a second choice for owners<br />
of detached homes in particular, because of the attractive feed-in subsidies for<br />
photovoltaics. But the situation could change rapidly in view of persistently high<br />
oil and gas prices and new legislation to encourage subsidies (at EU level as<br />
well). It should be possible for the existing expansionary trend to continue up to<br />
2010, although growth rates will be significantly higher if additional subsidy programmes<br />
are introduced.<br />
For the current year 2005 we predict that newly installed collector capacity<br />
worldwide will reach around 15.5 GW th , which is 32% more than last year. This<br />
growth will come mainly from the boom in China, but also from other non-<br />
European countries. The global growth rate is likely to remain between 25% and<br />
30% up to 2010. We therefore predict a market volume (newly installed capacity)<br />
of 55 GW th in 2010, with roughly 250 GW th on stream worldwide. As the market<br />
gradually matures, we expect average growth will then ease back in the following<br />
decade (2011- 2020) to around 20% p.a. The global market for newly installed<br />
solar collectors would therefore reach a volume of approximately 390 GW th in<br />
2020.<br />
Dezember 2005 4
Solar Energy 2005<br />
The technology for solar-assisted cooling will be an important growth driver in<br />
future, especially in countries with a lot of sunshine and rising demands for personal<br />
comfort. Here combined heating and cooling systems can help to alleviate<br />
the critical peak loads that can occur at the height of summer.<br />
Solar thermal power stations<br />
In the last two to three years plans have multiplied for new power generation projects<br />
in response to technological advances and also more attractive political and<br />
economic conditions, including climate protection agreements, soaring oil and<br />
gas prices, subsidy programmes for renewable energies and generous fixed rate<br />
payments for solar energy supplied to the mains grid. In Spain and the US especially,<br />
the conditions for encouraging solar thermal power stations have improved<br />
significantly. However, such large-scale projects involve protracted procedures<br />
to get planning permission and secure the funding.<br />
There have been very few changes to the list of projects we published in last<br />
year’s report. So far none of the planned power stations have come on stream.<br />
At the moment the total power station capacity actually in service worldwide is<br />
350 MW. This capacity originates exclusively from the first boom phase at the<br />
start of the nineties. Even so, concrete projects are now being constructed or are<br />
in an advanced planning stage. Future development relies heavily on the success<br />
and experiences of these pilot projects. Based on the projects planned, we<br />
think that power stations with a total capacity of 1,500 MW could be realised by<br />
the end of 2008.<br />
Dezember 2005 5
Solar Energy 2005<br />
Introduction<br />
Focus on total solar energy<br />
use<br />
Short-term forecast for the<br />
most important markets<br />
Solar industry facing<br />
supply bottleneck<br />
Focus on off-grid systems in<br />
developing countries<br />
Just how sustainable<br />
are PV systems?<br />
Effects of new European<br />
environmental legislation<br />
For the third consecutive year, <strong>Sarasin</strong>'s solar energy report studies the three<br />
solar applications photovoltaics, solar thermal power and large-scale solar<br />
thermal power stations. Our decision to concentrate not only on solar energy<br />
but also on solar thermal power now seems to be paying off, as public interest<br />
has risen sharply. The newly agreed conversion factor of 0.7 used to translate<br />
the surface area of the collector (in m 2 ) into energy output (megawatt thermal or<br />
MW th ), makes it easier to compare solar thermal power with other renewable energies<br />
and gives a better picture of its true importance.<br />
Our regional review of the three biggest PV markets – Germany, Japan and the<br />
US – and their performance revealed an upbeat picture. In particular, all eyes<br />
are on developments in the German market, whose progress could well set the<br />
course for the immediate future of the global photovoltaics industry.<br />
The shortage of solar-grade silicon referred to in last year’s report is becoming<br />
more and more acute. The big manufacturers of solar-grade silicon are working<br />
flat out to expand their production capacities. This year’s report provides the latest<br />
information on the future expansion of global capacities. The PV industry is<br />
also trying to make its production processes more efficient in order to produce<br />
more power (in megawatts) from less silicon. We also describe the latest technology<br />
trends.<br />
Despite the attraction of fixed-rate payments for solar energy supplied to the<br />
mains grid, it is important to look beyond the principal markets for grid-connected<br />
systems in Germany, Europe and Japan. A far more important dimension – at<br />
least as far as sustainability is concerned – is the supply of electricity to rural areas<br />
in the Third World, and this market segment is now gradually starting to develop.<br />
Considering the problems of global climate change, the use of photovoltaics<br />
in developing countries has high priority. This is not only true from the<br />
environmental or humanitarian perspective, but also from an economic viewpoint,<br />
since with these applications photovoltaics often compete with diesel generators<br />
and are increasingly becoming a competitive alternative in financial terms<br />
as well.<br />
For a long time the energy payback period, i.e. the time span for a system to<br />
produce more electricity than was required for its manufacture, was considered<br />
to be relatively unfavourable for PV systems especially. An environmental audit<br />
using new data material based on the latest technologies shows that the energy<br />
payback period is now only about two years, depending on the type of PV cell<br />
used.<br />
At the moment the photovoltaics industry is not affected (or only marginally affected)<br />
by the new EU directives on waste of electric and electronic equipment<br />
(WEEE) and the restriction of the use of certain hazardous substances (RoHS),<br />
such as lead in solder or cadmium. The solar industry would do well to take a<br />
proactive approach in meeting these challenges.<br />
Dezember 2005 6
Solar Energy 2005<br />
Long-term forecast<br />
up to 2020<br />
Solar collector chapter:<br />
country info and latest<br />
applications<br />
Solar-assisted cooling: an<br />
important new market<br />
Solar thermal power plants:<br />
IPO of Solar Millennium<br />
As usual, the PV chapter of our report finishes with a long-term forecast for the<br />
future of the PV market. This time our forecast is based on the new PV capacity<br />
installed each year. The two targets used in our forecast are 2010 and 2020.<br />
Our chapter on solar collectors provides a description of the most important markets<br />
such as China, Germany, Greece and Austria. As in our 2003 report, there<br />
is a separate chapter on the most important European players in the solar thermal<br />
power industry. We also provide a short-term forecast (up to 2007) for the<br />
European solar thermal energy market. Our long-term forecast shows global<br />
trends in solar thermal power up to 2020.<br />
The use of solar power for cooling and refrigeration is attracting more and more<br />
interest. Keeping rooms cool in summer creates enormous peak loads in many<br />
hotter regions of the world. Here the sun can provide a desperately needed alternative.<br />
Solar thermal power plants are now becoming an attractive proposition for financial<br />
markets as well. In August 2005 Germany’s big project development and<br />
construction company Solar Millennium floated on the stock market. It is already<br />
building its first new power plants in Spain. This chapter provides an update on<br />
all the global projects currently under way.<br />
Dezember 2005 7
Solar Energy 2005<br />
Photovoltaics (PV)<br />
Silicon supply<br />
Bottleneck in supply of solargrade<br />
silicon is holding back<br />
industry growth<br />
Silicon component more<br />
expensive<br />
The shortage of solar-grade silicon we predicted in our last report has now become<br />
reality and will prevent the solar industry from growing at its full potential in<br />
the coming years. With the current technology based on wafers cut from silicon<br />
ingots, the PV industry requires approximately thirteen tonnes of silicon per<br />
megawatt of solar cell capacity. In 2004 the industry needed just over 14,300<br />
tonnes of solar-grade silicon to produce roughly 1100 MW of silicon-based PV<br />
cells (around 92% of total cell production). Rocketing demand for solar-grade<br />
silicon, combined with limited opportunities for rapid expansion of capacities, has<br />
caused silicon prices to jump from around USD 25 per kilo in 2003 to roughly<br />
USD 50 at present. Prices as high as USD 60-70 per kilo are being paid on the<br />
spot market. Prices for semiconductor silicon have risen as well and are roughly<br />
USD 10 higher than the price of solar-grade silicon on average.<br />
With solar power, the creation of added value starts with silicon and moves in a<br />
clockwise direction in Fig. 1 below. The cost components shown apply for an average<br />
grid-connected PV system mounted on a roof. Compared with last year,<br />
prices have risen for silicon, ingots/wafers, cells and modules, which now make<br />
up more than 55% of total costs. By contrast, the cost of components that are<br />
not dependent on silicon has not risen. Prices for power inverters, for example,<br />
have dropped around 5% and we expect the prices for other accessories, distribution<br />
and installation to continue falling in the coming years.<br />
Fig. 1: Cost components (in %) of a PV system (excl. tax)<br />
Installation<br />
18.0%<br />
Silicon<br />
8.0%<br />
Ingot/Wafer<br />
12.0%<br />
Distribution<br />
10.0%<br />
Other components<br />
15.0%<br />
Cell<br />
19.0%<br />
Module<br />
18.0%<br />
Source: <strong>Sarasin</strong>, 2005<br />
Silicon accounts for about 8% of the total cost of a PV system. The increase of<br />
around 100% in the price of this key raw material has pushed up the end price of<br />
a PV system by roughly 6-7%. This has put increasing pressure on the margins<br />
of producers involved in the silicon-based value chain.<br />
The big silicon producers were slow to respond to the solar boom to begin with.<br />
Since the end of 2004, however, they have expanded their capacities, particularly<br />
for solar-grade silicon. Depending on the scale of the existing infrastructure,<br />
it can take up to 2-3 years to construct an additional production facility. The sili-<br />
Dezember 2005 8
Solar Energy 2005<br />
con supply bottleneck is therefore unlikely to improve much before 2008 at the<br />
earliest.<br />
Silicon and wafer manufacturers are exploiting the current shortage to force cell<br />
producers into making long-term supply agreements. These include purchase<br />
commitments over several years and in some cases even involvement in the<br />
pre-financing of new silicon production plants. SolarWorld, for example, has<br />
safeguarded its raw material supply by concluding 10-year contracts with the silicon<br />
producers Hemlock and Wacker.<br />
Expansion plans of<br />
silicon producers<br />
REC and Solar Grade Silicon as<br />
‘pure players’ for solar-grade<br />
silicon<br />
Only seven large companies are involved in silicon production worldwide, most<br />
of them part of big chemicals conglomerates. They supply silicon to both the<br />
semiconductor and the solar energy industry. The companies most active in the<br />
manufacture of solar-grade silicon include Hemlock (USA), Wacker (Germany)<br />
and Tokuyama (Japan). In 2004 all three companies supplied a large proportion<br />
of their production to the PV industry and are also striving to expand these capacities<br />
further. In 2004 their combined production came to approximately<br />
18,000 tonnes of polycrystalline silicon (polysilicon), with a target of more than<br />
33,000 tonnes in 2010.<br />
The only company that has so far specialised exclusively in the production of solar-grade<br />
silicon is the US company Solar Grade Silicon LLC (SGS), which is<br />
part of Norway’s REC Group. In 2004 SGS produced 2,100 tonnes of solargrade<br />
silicon, and plans to expand this capacity to 2,300 tonnes in 2005. A pilot<br />
plant with a capacity of 200 tonnes is currently in service, in which a new fluidised-bed<br />
reactor is being tested. If the results are positive, an additional 1,000<br />
tonnes of production capacity could come on stream by 2007. There are plans to<br />
increase this to around 5,000 tonnes by 2010. As of the end of July 2005, REC<br />
also owns 75% of the US silicon producer ASiMI (Advanced Silicon Materials<br />
LLC), which has a capacity of 2,400 tonnes. This production will gradually be<br />
made available to the solar industry.<br />
A newcomer to the scene is Norway’s Elkem, which plans to produce solargrade<br />
silicon using a metallurgical process. It hopes to produce around 2,000-<br />
5,000 tonnes next year. However, it’s not yet certain whether the silicon really<br />
will be pure enough to meet solar industry requirements.<br />
In addition Joint Solar Silicon (JSSI) – a joint venture between Degussa and SolarWorld<br />
– has produced its first prototype plant for making solar-grade silicon.<br />
Annual capacity should be in the region of 800 tonnes in 2007.<br />
New association for<br />
solar-grade silicon<br />
Solar industry caught between<br />
booming demand and silicon<br />
supply bottleneck<br />
One very promising development is the newly founded European Solargrade<br />
Silicon Association. The purpose of this association is to invite tenders for solargrade<br />
silicon production whose output will be destined solely for the PV industry.<br />
The founding members are PV Crystalox, Deutsche Cell, SolarWorld and Schott<br />
Solar. Membership of the association is open not only to the silicon processing<br />
industry, but to companies that produce solar cells and silicon.<br />
The current industry situation is rather unusual: capacity utilisation is usually determined<br />
by demand, but this is not the case here. Demand for solar modules is<br />
robust and rising, but companies are still unable to increase their cell and module<br />
production capacities because there is not enough solar-grade silicon avail-<br />
Dezember 2005 9
Solar Energy 2005<br />
able. This shortage of raw material obviously gives silicon manufacturers the upper<br />
hand: they will be able to improve their margins over the next 2-3 years and<br />
consequently see their earnings rise dramatically. This will be to the detriment of<br />
end customers of solar systems, as it is almost inevitable that the higher silicon<br />
prices will be passed on down the value chain and ultimately forced onto by the<br />
end buyer.<br />
Fig. 2: Production capacities for solar-grade silicon and maximum PV cell production<br />
2004 2005 2006 2007 2008 2009 2010<br />
Solar-grade silicon production (t) 6'800 9'100 10'300 15'000 16'200 22'200 26'200<br />
Inventories (t) 4'500 3'500 2'500 1'000 300 200 200<br />
Scrap material from the semiconductor industry (t) 2'988 2'733 2'886 2'748 4'028 5'040 5'350<br />
Total quantity available for solar industry (t) 14'288 15'333 15'686 18'748 20'528 27'440 31'750<br />
Amount of silicon per Wp (t) 13.0 12.0 11.0 10.2 9.5 9.0 8.5<br />
Total silicon-based PV cells (MWp) 1'099 1'278 1'426 1'838 2'161 3'049 3'735<br />
Proportion of silicon-based PV cells 92% 91% 88% 89% 90% 91% 92%<br />
Maximum potential PV cell production (MWp) 1'195 1'404 1'620 2'065 2'401 3'350 4'060<br />
Potential PV cell demand (MWp) 1'320 1'603 1'944 2'336 2'702 3'182 3'848<br />
Source: <strong>Sarasin</strong>, 2005<br />
PV industry: expansion or<br />
vertical integration?<br />
Supply shortage must not result<br />
in poorer quality<br />
More efficient use of silicon and<br />
investments in alternative<br />
technologies<br />
With raw materials in such short supply, larger producers of PV cells and modules<br />
obviously have a stronger negotiating position – in relative terms – and can<br />
exploit their purchasing power more effectively than the smaller players. We<br />
therefore expect that the major PV cell producers will be able to expand their<br />
market shares significantly in the coming years. There will also be a certain<br />
amount of industry consolidation. Under these circumstances a strategy of increased<br />
vertical integration by acquiring suppliers becomes more attractive, in<br />
order to secure better access to the desired pre-production materials (ingots and<br />
wafers). The companies that manage to anticipate the supply bottleneck in good<br />
time and make advance provisions for it will still manage to grow and capture a<br />
bigger share of the market.<br />
The industry agrees on one thing, however: on no condition may the current silicon<br />
bottleneck be allowed to compromise the quality of PV products. Rapidly organised<br />
but sub-standard raw materials would have disastrous consequences<br />
for the entire solar industry.<br />
Because of the shortage of silicon, as well as for cost reasons, the PV industry is<br />
working hard to steadily reduce the specific amount of silicon required for each<br />
unit of capacity. Big efforts are being made to minimise scrap when sawing silicon<br />
wafers, to cut the wafers themselves more thinly, to increase the use of<br />
more direct production methods, such as EFG (Schott) or string ribbon (Evergreen<br />
Solar), and to develop more efficient solar cells. Similarly, alternative solar<br />
technologies not based on crystalline silicon will benefit in the long run from further<br />
increases in the price of solar-grade silicon. In the medium term it is in the<br />
solar industry’s interest to build up an adequate supply of cheap silicon that is as<br />
independent as possible from the semiconductor industry. There is thus virtually<br />
no other choice for companies than to participate financially in a secured supply<br />
of solar-grade silicon.<br />
Dezember 2005 10
Solar Energy 2005<br />
Fig. 3: Silicon supply versus potential demand for PV cells (<strong>Sarasin</strong> forecast)<br />
Maximum potential cell production (MWp)<br />
Potential PV cell demand (MWp)<br />
4500<br />
4000<br />
3500<br />
3000<br />
2500<br />
2000<br />
1500<br />
1000<br />
500<br />
0<br />
2004 2005 2006 2007 2008 2009 2010<br />
Source: <strong>Sarasin</strong>, 2005<br />
Wafer production<br />
Wafer producers<br />
The production of silicon ingots and wafers is frequently undertaken by the same<br />
companies. In 2004, IEA-PVPS estimated that wafers with a capacity of 860 MW<br />
were manufactured. According to IEA, the most important European competitors<br />
in this area are the Norwegian company ScanWafer, Deutsche Solar and PV<br />
Crystalox, an Anglo-German company. Figure 4 provides an overview of the<br />
leading wafer manufacturers for the photovoltaics industry. For 2005 we expect<br />
wafer production to total 1,300 MW.<br />
Apart from wafer manufacturers, who sell their products to other solar cell producers,<br />
a number of companies are vertically integrated and make wafers primarily<br />
to meet their own requirements. The most important companies in this<br />
second category are Deutsche Solar, Kyocera, BP Solar and Shell Solar. Some<br />
competitors also use special technologies geared to their own solar cell production,<br />
such as the EFG method used by RWE Schott Solar.<br />
Fig. 4: Market shares of leading wafer producers for 2005. Total capacity<br />
approx. 1,300 MW<br />
Schott Solar<br />
3%<br />
Sharp<br />
3%<br />
Others<br />
10%<br />
Deutsche Solar<br />
14%<br />
Sumitomo/Sumco<br />
4%<br />
Sanyo<br />
4%<br />
Setek<br />
14%<br />
JFE<br />
6%<br />
Shell Solar<br />
5%<br />
Kyocera<br />
7%<br />
PV Crystalox<br />
8%<br />
BP Solar<br />
8%<br />
ScanWafer<br />
14%<br />
Source: Prof. Dr. Peter Woditsch, Deutsche Solar, October 2005<br />
Dezember 2005 11
Solar Energy 2005<br />
Solar cells<br />
Overview of PV cell production 2004<br />
Review of solar cell production<br />
Module prices rising<br />
The big PV cell production<br />
countries: Japan, Germany<br />
and the US<br />
Global production in 2004 was between 60% and 67% higher than in the previous<br />
year, depending on the data sources used. In last year’s report we predicted<br />
global cell production of 1,125 MW for 2004. According to published figures, the<br />
volume was 1,195 MW 1 or 1,256 MW 2 (basis 2003: 750 MW). Apparently growth<br />
rates would have been even higher if producers had had even more raw materials<br />
available. Since 1995 annual growth rates for solar cell production have<br />
therefore averaged more than 35%, with photovoltaics comfortably beating the<br />
growth rates of other renewable energies such as wind power.<br />
There have been no further price cuts, due to the growing shortage of solargrade<br />
silicon and the resulting bottlenecks in PV modules. Instead PV module<br />
prices have risen steadily over the last 14 months since June 2004. The increase<br />
was roughly 5% in the US and over 2% in Europe. This brought the average<br />
module prices of USD 5.22 per watt in America and EUR 5.75 per watt 3 in<br />
Europe to a level last seen in July 2003. At the moment, therefore, higher silicon<br />
prices can be passed on down the entire value chain. In the mid-term, however,<br />
prices should fall back into line with the annual 5% degression in the tariffs for<br />
renewable energy fed into the mains electricity grid.<br />
According to the latest figures from IEA PVPS 4 , global solar cell production in<br />
PVPS countries alone jumped from 686 MW in 2003 to 1,109 MW in 2004,<br />
equivalent to growth of 62%. Production increased more than the average in Japan<br />
(+ 65% to 604 MW) and Europe (+71% to 329 MW), while production in the<br />
US “only” increased 35% to 138 MW (see Fig. 5).<br />
Solar cell production in non-PVPS countries<br />
Production in non-PVPS<br />
countries shows high<br />
percentage increases<br />
China an important market and<br />
producer in PV business<br />
-> Suntech Power<br />
-> Baoding Yingli<br />
According to IEA-PVPS, non-PVPS countries produced cells with a capacity of<br />
around 124 MW in 2004, an increase of 60 MW, or 93%, compared with 2003.<br />
This is a much higher growth rate than in PVPS countries. The figure of 124 MW<br />
now corresponds to roughly 10% of total global cell production of 1,233 MW.<br />
The top country is China. The bulk of the Chinese solar industry consists of PV<br />
module producers, i.e. the part of the value chain that requires the least amount<br />
of know-how. Because labour is so cheap in China, solar modules can be built<br />
here more cheaply than anywhere else in the world. But China is also catching<br />
up in the area of actual cell production. Last year national cell production capacities<br />
climbed to 50 MW and production ran at 35 MW. Targets for the current year<br />
are additional production capacities of 100 MW for crystalline silicon cells and<br />
240 MW for modules. Chinese PV module producers thus require substantial<br />
quantities of imported cells. Acquiring sufficient cell material will therefore be a<br />
major challenge for module producers. The supply of cells will in turn be<br />
1<br />
2<br />
3<br />
4<br />
Paul Maycock, PV Energy Systems, March 2005, www.pvenergy.com<br />
Photon, April 2005<br />
www.solarbuzz.com/moduleprices: Solar module index excluding VAT<br />
Trends in Photovoltaic Applications; Survey <strong>Report</strong> of selected IEA countries between 1992 and 2004.<br />
IEA Photovoltaic Power Systems Programme – Task 1; September 2005. All subsequent IEA-PVPS references<br />
refer to this publication. www.iea-pvps.org<br />
Dezember 2005 12
Solar Energy 2005<br />
restricted due to silicon bottlenecks. The Chinese are also working to resolve this<br />
problem. They plan to increase silicon production from the current level of 650<br />
tonnes to at least 5,000 tonnes by 2010. All these figures clearly show that China<br />
will play an important role in the mid-term in the solar business, both as a producer<br />
and as a sales market.<br />
Fig. 5: Country breakdown: Top 10 solar cell producers in 2003 and 2004<br />
400<br />
350<br />
300<br />
365<br />
604<br />
Production 2003 Production 2004<br />
MW Cells<br />
250<br />
200<br />
150<br />
100<br />
50<br />
0<br />
198<br />
138<br />
110 102<br />
81<br />
59.3<br />
50<br />
8<br />
38<br />
26.3<br />
35.6 30 25<br />
14 11 11<br />
Japan<br />
Germany<br />
USA<br />
Spain<br />
China<br />
Taiwan<br />
Australia<br />
France<br />
Philippin es<br />
India<br />
Source: IEA-PVPS and <strong>Sarasin</strong>, 2005<br />
Taiwan<br />
-> Motech<br />
Philippines<br />
-> Sunpower<br />
India<br />
In 2004 Taiwan produced PV cells with a capacity of 39 MW (35 MW monocrystalline<br />
and polycrystalline; 4 MW amorphous silicon), an increase of more than<br />
100% on last year. Crystalline silicon cell production could even climb by as<br />
much as 140% to 85 MW by the end of this year.<br />
The American company Sunpower has recently initiated cell production at a<br />
plant near Manila in the Philippines. In the second half of 2004 this plant produced<br />
the first high-performance cells with an efficiency ratio of more than 20%.<br />
Production capacity is set to increase to 50 MW by the end of the year.<br />
India’s solar cell market has stagnated in recent years and capacity is still<br />
around 10 MW per year (modules approx. 40 MW p.a.).<br />
Top 15 solar cell producers<br />
Top 15<br />
Sharp<br />
The overview in Fig. 6 shows the world’s top 15 PV cell manufacturers with the<br />
volumes they produced last year, estimated production in the current year, and<br />
planned capacities for y/e 2005 and 2006.<br />
The Japanese electronics group Sharp produced solar cells with a total capacity<br />
of 324 MW in 2004. In January 2005 Sharp also brought on stream two new production<br />
lines at its Katsuragi manufacturing plant, increasing its production capacity<br />
from 315 to 420 MW per year. These new lines can process wafers with a<br />
thickness of 180 µm. The typical thickness found in the industry is 270 µm. This<br />
new thinner wafer is not sawn from a silicon ingot, but produced direct from molten<br />
silicon using a die process. This allows Sharp to produce cells that save<br />
costs and materials. In addition, the company already makes a module with rearcontact<br />
solar cells (20% efficiency ratio). The market leader has also developed<br />
a concentrator cell with an efficiency ratio of 40%. PV modules are now being<br />
produced for Sharp in China as well, by Shanghai Solar, for example. Here<br />
Sharp provides the materials and also the “baking recipe” for its modules.<br />
Dezember 2005 13
Solar Energy 2005<br />
Q-Cells<br />
Kyocera<br />
In 2004 Q-Cells was Europe’s biggest producer of solar cells, with a production<br />
volume of 76 MW. This year Q-Cells should continue to expand its market share<br />
and its estimated production of 162 MW should give it a global ranking of around<br />
second or third, compared with 11 th place in 2002. Its planned capacity of<br />
350 MW for 2007 would make Q-Cells clear number two after Sharp. At the start<br />
of October the company completed a successful IPO. Q-Cells has invested in<br />
the development of new technologies through joint ventures with partners in the<br />
US and Australia. In the first half of 2006 EverQ, its joint venture with the US<br />
company Evergreen Solar, is due to start production of solar cells using the<br />
string ribbon procedure, with an initial capacity of 30 MW. In its collaboration with<br />
the Australian company Pacific Solar, Q-Cells also plans to bring products to<br />
market in H1 2006 that were developed using the CSG thin-film process (CSG =<br />
crystalline silicon on glass). Both techniques use significantly less silicon than<br />
conventional applications.<br />
Japan’s Kyocera, the world’s second biggest integrated solar company, produced<br />
solar cells with a capacity of 105 MW last year. The company plans to<br />
more than double its cell capacity to 240 MW in 2005, and has set itself the ambitious<br />
target of becoming the world’s biggest fully integrated photovoltaics company.<br />
As of 2010 Kyocera only intends to mass-produce cells with a thickness of<br />
100 µm.<br />
Fig. 6: World’s top 15 solar cell producers and their expansion plans, ordered<br />
by estimated production volume in 2005<br />
600<br />
Production 2004 Production 2005e Capacity 2005e Capacity 2006e<br />
500<br />
400<br />
MW Cells<br />
300<br />
200<br />
100<br />
0<br />
Sha rp<br />
Q-Cells<br />
Kyoce ra<br />
Sanyo<br />
BP Solar<br />
Mitsubishi<br />
Suntech<br />
Schott Solar<br />
Shell Solar<br />
Motech<br />
Isofoton<br />
Deutsche Cell<br />
SunPower<br />
Photowatt<br />
GE<br />
Source: Photon, April 2005 and <strong>Sarasin</strong><br />
Sanyo<br />
BP Solar<br />
In 2004 Sanyo produced solar cells with a capacity of 65 MW. In response to the<br />
booming PV market, Sanyo has also announced its intention to increase capacities<br />
for its HIT technology (19.5% efficiency ratio) to 153 MW soon. Production<br />
capacity of amorphous solar cells is also due to be increased from 5 to 7 MW.<br />
BP Solar, a wholly owned subsidiary of the global oil and gas giant BP, produced<br />
solar cells with a capacity of 85 MW in 2004. BP Solar is currently working on<br />
expanding its capacity to 200 MW by the end of 2006. It has production plants in<br />
the US, Spain, India and Australia. In Spain it plans to build new production lines<br />
to increase output to 50 MW p.a. In 2006 BP Solar wants to start building the<br />
world’s biggest solar power station in Portugal. This project involves erecting<br />
Dezember 2005 14
Solar Energy 2005<br />
around 350,000 solar collectors on a greenfield site of 114 hectares producing a<br />
combined output of 62 MW by 2009.<br />
Mitsubishi Electric<br />
Suntech<br />
Schott Solar<br />
Shell Solar<br />
Motech<br />
Isofotón<br />
SolarWorld (Deutsche Cell)<br />
In 2004 the Japanese technology group Mitsubishi Electric produced solar cells<br />
with a total capacity of 75 MW. The annual output of the factories in Nakatsugawa<br />
and Kyoto were due to be increased from 90 MW to 135 MW by April<br />
2005. By 2006 the company wants to build a production plant with a capacity of<br />
230 MW.<br />
Suntech Power is a Chinese-Australian joint venture based in Shanghai that has<br />
only existed for three years and in 2004 already had a production capacity of 35<br />
MW polycrystalline and monocrystalline solar cells. Suntech is therefore the first<br />
Chinese company to reach the top 10 list of solar cell producers. The company<br />
assembles most of these cells itself into proprietary solar modules. Capacity<br />
should reach 100 MW by the end of 2005. In January Suntech signed a contract<br />
with SolarWorld for the licensed production of solar modules that is worth EUR<br />
100m over the next two years.<br />
On 1 October the specialist glass company Schott based in Mainz (Germany)<br />
bought out RWE’s stake in the joint venture RWE Schott Solar. The company<br />
was renamed Schott Solar GmbH. Cell production came to around 63 MW in<br />
2004. Capacity is being stepped up to 133 MW in 2005. One special feature is<br />
wafer production based on the “edge-defined film growth” (EFG) process which<br />
saves on material. The solar cell production plant in Heilbronn was taken over<br />
from Solarwatt in Dresden. The bulk of the high-performance PV cells produced<br />
at the new location have been supplied to Solarwatt for several years now. Over<br />
the next three years, production capacities in Heilbronn are due to be substantially<br />
increased from the current level of 6 MW.<br />
In 2004 Shell Solar produced solar cells with a capacity of 72 MW. In addition to<br />
modules made from crystalline cells, the company also produces thin-film modules<br />
based on a new generation of CIS technology. In 2005 total capacity should<br />
be some 110 MW.<br />
Last year Motech produced around 35 MW crystalline solar cells in Taiwan. This<br />
year the figure is expected to be as high as 70 MW. A new factory with an annual<br />
production capacity of 120-200 MW should be ready by March 2006.<br />
The Spanish solar energy company Isofotón produced cells with a capacity of 53<br />
MW in 2004. Apart from Spain and Italy, Isofotón is active as a solar energy provider<br />
in 48 other countries. With a new plant in Malaga, the company plans to<br />
step up its annual cell production to 120 MW by the end of 2006.<br />
SolarWorld has manoeuvred itself into a very strong position overall. As an integrated<br />
solar company, it is especially well positioned when there are supply bottlenecks.<br />
SolarWorld already owns around 15% of global wafer production capacity<br />
– a secure internal source for its own cell production. SolarWorld also<br />
fosters close relationships with its suppliers, whether they be producers of raw<br />
silicon or companies that recycle scrap silicon. This source, coupled with scrap<br />
silicon from Wacker Silitronic actually covers more than 20% of the group’s silicon<br />
requirements.<br />
Dezember 2005 15
Solar Energy 2005<br />
Deutsche Cell, a subsidiary of SolarWorld, produced cells with a capacity of 28<br />
MW last year. At the start of the year, production capacities were expanded to 60<br />
MW and are due to be increased to 120 MW by the end of 2006. At its site in<br />
Freiberg (Saxony) it wants to double annual wafer production to 240 MW by<br />
2007 and more than double module production in Freiberg and Gällivare (Sweden)<br />
to 120 MW.<br />
Sunpower<br />
Photowatt (ATS)<br />
GE Energy<br />
Other companies: ErSol,<br />
Evergreen Solar, Kaneka,<br />
Photowatt (ATS), Sunways<br />
America’s SunPower Corporation wants to expand its production capacity for solar<br />
cells to 50 MW by the end of the year. The new production line was installed<br />
at its Filipino subsidiary near the capital Manila. The building is designed to allow<br />
production to be expanded to 100 MW. In the coming years the company plans<br />
to install more production lines to bring capacity up to 75 MW. On the new line,<br />
production will be dedicated exclusively to the high-performance cell with an efficiency<br />
ratio of 21.5%. SunPower is one of the suppliers to Berlin’s Solon AG,<br />
with whom it signed a USD 300m contract in April to supply high-performance<br />
cells over five years. In autumn SunPower’s parent company, Cypress Semiconductor<br />
Corporation is expected to float SunPower on the stock exchange.<br />
The Canadian group Automation Tooling Systems (ATS) has a solar energy<br />
business called Photowatt that increased its capacity to 33 MW last year. Since<br />
the summer of 2004 it has been producing a new solar cell technology known as<br />
Spheral Solar Power (SSP). The factory is aiming for an annual capacity of 35<br />
MW. It has highly automated production lines that manufacture flexible solar<br />
cells in different colours. SSP is based on crystalline silicon.<br />
Astropower seems to have a new lease of life following its takeover by GE Energy.<br />
Last year GE Energy produced 25 MW, and this year the figure should be<br />
around 30 MW.<br />
ErSol, a cell and module manufacturer based in Erfurt, produced cells with a total<br />
capacity of 16 MW last year and wants to increase this to around 28 MW this<br />
year. Capacity will be expanded to 50 MW by the end of 2005. At the start of October<br />
the company completed a successful IPO. By acquiring ASi GmbH, headquartered<br />
in Kreuzlingen (Switzerland), and setting up production in Arnstadt<br />
(Germany), ErSol is now active in the manufacture of ingots and wafers as well.<br />
The availability of silicon is secured into the next decade thanks to long-term<br />
supply contracts with well-known silicon manufacturers. ErSol is also conducting<br />
research, in collaboration with the Erfurt Solar Centre, on a flexible solar cell that<br />
is only 100 µm thick.<br />
Evergreen Solar offers a patented string ribbon technology that provides attractive<br />
cost-savings potential in the medium term. Initially production capacity is set<br />
to increase to 15 MW by the end of the year. The company is examining ways of<br />
expanding this to 50 MW p.a. through a joint venture with Q-Cells (see above).<br />
Last year the Japanese conglomerate Kaneka produced 17 MW amorphous silicon<br />
thin-film cells. These cells are only around 0.3 µm [micrometres] thick, compared<br />
with 200 µm for a normal crystalline silicon cell. The company’s production<br />
target for this year is around 20 MW.<br />
In September Sunways, headquartered in Konstanz (S. Germany) opened its<br />
new production plant for PV cells in Arnstadt (N.E. Germany). The 3500 m 2<br />
Dezember 2005 16
Solar Energy 2005<br />
production hall is designed for a capacity of 80 MW solar cells with an efficiency<br />
ratio of more than 18%. At the moment Sunways has a total production capacity<br />
of 30 MW. Last year the company only produced 11 MW. It also has a cooperation<br />
agreement with the machinery firm Unaxis in Liechtenstein, with the aim of<br />
jointly constructing within the next two years a production plant to make solar<br />
cells based on thin-film technology.<br />
Sliver Cells from Origin<br />
Energy (AUS)<br />
Leading Chinese producers<br />
Baoding Yingli and<br />
Nanjing PV-Tech<br />
Silicon bottleneck prevents<br />
full utilisation of production<br />
capacities<br />
Origin Energy is Australia’s second largest energy provider. Its recently launched<br />
solar cell is based on sliver technology developed in association with the Australian<br />
National University. This thin-film silicon cell is bifacial and captures light<br />
from the rear as well, which means its production only requires approximately 3<br />
tonnes of silicon per MW. The first 10 W of Sliver modules were produced at the<br />
end of last year. Output is due to be increased to 40 W soon.<br />
Apart from Suntech Power, China has a number of up-and-coming producers of<br />
PV cells. Baoding Yingli produced cells with a capacity of 10 MW last year. The<br />
company has an ambitious three-year plan designed to expand wafer, cell and<br />
module capacity to 300 MW by the end of 2007. By the end of this year Nanjing<br />
PV-Tech wants to begin operations at the first of three production lines with a<br />
combined capacity of 100 MW. Another production hall is ready to move into<br />
which would allow expansion up to 300 MW. But no decision has been reached<br />
yet on when to build these production lines, and the go-ahead hinges mainly on<br />
a secure supply of solar-grade silicon.<br />
At the moment most big solar cell producers are expanding their production capacities.<br />
In 2006 the top 20 companies alone would have a combined capacity of<br />
more than 3.5 GW, equivalent to around 95% of global cell production capacity.<br />
Past experience shows, however, that ambitious expansion plans are not always<br />
fully implemented, or tend to be delayed. Although demand is booming, the new<br />
capacities are still unlikely to be fully utilised because of the limited availability of<br />
silicon. As already mentioned, the companies who are most adept and successful<br />
at securing a supply of silicon should have fewer problems with capacity utilisation.<br />
Solar cell technologies<br />
Optimisation of industrial<br />
production still a top priority<br />
Silicon-based cell<br />
technology continues<br />
to dominate<br />
Technological breakthroughs and announcements about record effectiveness<br />
and new materials in research are almost standard fare in the development of<br />
solar cells. But industry experts agree that the biggest challenges facing the solar<br />
industry are not primarily in the laboratory, but in the industrial-scale application<br />
of research findings. As far as manufacturing processes are concerned,<br />
there is still a lot of room for improvement from a technical and commercial<br />
viewpoint. Over the coming years the top priority is therefore still likely to be the<br />
optimisation of manufacturing processes in order to reduce costs.<br />
In 2004 the picture for cell technologies was pretty much unchanged. Almost<br />
90% of all solar cells produced are now mono or polycrystalline silicon cells.<br />
They still offer the best price/performance ratio. The enormous growth of recent<br />
years was mainly due to these technologies (see Fig. 7). String ribbon cells, as<br />
manufactured by Schott Solar and Evergreen Solar, may soon become more<br />
popular because less silicon is used in their manufacture. Despite an increase in<br />
Dezember 2005 17
Solar Energy 2005<br />
production output, thin-film technologies (amorphous silicon, CdTe, CIS, etc.)<br />
were unable to keep pace with the market.<br />
Despite optimisation,<br />
significant cost savings only<br />
possible with new technologies<br />
We think the shortage of silicon will encourage the development of more efficient<br />
technologies. In crystalline silicon technology, the focus is on thinner wafers with<br />
bigger dimensions and improved efficiency. Most providers are not attempting to<br />
make any fundamental changes in the design and manufacture of cells, and<br />
have still managed to achieve significant progress so far with this strategy.<br />
Fig. 7: Market shares of different solar cell technologies<br />
100%<br />
Monocrystalline Polycrystalline Ribbon/Sheet a-Si CdTe CIS<br />
90%<br />
80%<br />
70%<br />
60%<br />
50%<br />
40%<br />
30%<br />
20%<br />
10%<br />
0%<br />
1999 2000 2001 2002 2003 2004<br />
Source: Photon, April 2005<br />
Technological innovation<br />
across a broad front<br />
The second strategy manufacturers pursue is to research innovative materials<br />
and technologies and try them out in pilot production. These initiatives entail a lot<br />
of research and considerable risks, but they also potentially offer big cost savings<br />
in the long run by substantially improving efficiency ratios. Innovations include,<br />
for example, ultra-thin crystalline cells, tandem and concentrator cells or<br />
organic solar cells.<br />
The major PV markets<br />
Installed PV<br />
capacity up 62%<br />
Germany takes over the<br />
lead from Japan<br />
Preliminary comment: In contrast to information provided previously about the<br />
quantities of solar cells produced, in what follows we are dealing with PV capacity<br />
actually installed in the form of PV systems. According to IEA-PVPS, globally<br />
installed PV capacity reached approximately 840 MW in 2004 (PVPS countries<br />
770 MW + non-PVPS countries 70 MW) while the market report published by<br />
Solarbuzz put the figure as high as 927 MW. This is equivalent to growth of 43%<br />
(or 62%) on last year.<br />
Last year Germany overtook Japan with growth of 137%, to achieve 363 MW of<br />
newly installed capacity. In Japan 272 MW were installed last year, an increase<br />
of 22% on 2003. These two countries now account for 68% of globally installed<br />
PV systems. In 2004 growth in the US came to 43%, to reach 90 MW newly installed<br />
capacity. The dominant nations in installing PV capacity are still Germany,<br />
Japan the US (in that order). Together they accounted for roughly 86% of<br />
the newly installed global capacity in 2004. These countries have dominated the<br />
industry for years, as reflected in the cumulative totals for installed capacity.<br />
Here Japan leads the way (1,132 MW), followed by Germany (794 MW), the US<br />
Dezember 2005 18
Solar Energy 2005<br />
(365 MW), and then – after a big gap – India (86 MW), China (70 MW), Australia<br />
and the Netherlands (both 50 MW). The historical comparison between the three<br />
big players highlights the explosive growth in Germany, which has been fuelled<br />
during the last two years especially by attractive tariffs paid for renewable energy<br />
fed into the mains electricity grid (see Fig. 8).<br />
Fig. 8: Historical development of cumulative PV capacity installed in the<br />
three biggest markets: Japan, Germany and the USA<br />
1200<br />
Germany Japan USA<br />
1000<br />
800<br />
[MW]<br />
600<br />
400<br />
200<br />
0<br />
1992 1993 1994 1995 1996 1997 1998 1999 2000 2001 2002 2003 2004<br />
Source: IEA-PVPS, 2005<br />
Analysis of top three PV<br />
markets: Germany, Japan<br />
and the US<br />
The next section takes a closer look at the dominant PV markets of Germany,<br />
Japan, and the USA and describes the overall conditions that significantly influence<br />
PV demand in these countries.<br />
Germany<br />
German PV market<br />
takes the lead<br />
Renewable Energy Act provides<br />
crucial stimulus<br />
Massive capacity expansion by<br />
producers of modules and cells<br />
Last year Germany’s PV market experienced explosive growth, with 363 MW of<br />
newly installed capacity. This is equivalent to 173% growth on last year<br />
(133 MW). According to figures published by the German solar industry association<br />
(BSi), cumulative installed capacity already passed the one gigawatt threshold<br />
in the first half of 2005. The new feed-in tariffs following the revision of the<br />
Renewable Energy Act (EEG) gave the market the required boost and stability.<br />
Since the summer of 2004 booming demand can no longer be satisfied, and delivery<br />
times of six months are commonplace.<br />
At the moment solar energy installations pay for themselves purely thanks to the<br />
attractive tariffs paid for renewable energy fed into the mains electricity grid. The<br />
strong market growth and the bulging order books of module producers show<br />
that people are very keen to invest in modern green technologies if the financial<br />
incentives are attractive enough. Apart from this purely financial aspect, solar<br />
energy also benefits from the very high acceptance of renewal energies among<br />
the general public.<br />
In the past five years German manufacturers have invested a total of more than<br />
EUR 1.5 billion in building up new capacities for PV cell and module production.<br />
According to information from German providers, this production capacity is set<br />
to double again by the end of 2005. German manufacturers still have faith that<br />
the PV boom will continue.<br />
Dezember 2005 19
Solar Energy 2005<br />
Grand coalition<br />
Export business<br />
increasingly important<br />
Short and mid-term forecast for<br />
the PV market in Germany<br />
The change of government following premature elections most probably does<br />
not signify any dramatic worsening of the conditions for government subsidies. A<br />
consensus still exists between the two coalition parties concerning the promotion<br />
of solar energy, particularly since approximately 30,000 people are now employed<br />
in Germany’s solar industry.<br />
Irrespective of what happens with the new government, it would be wise for<br />
Germany’s solar companies to use the period up to 2007, when the next regular<br />
review of feed-in tariffs is scheduled, to reduce their dependency on the German<br />
market by building up their export business. Important export markets include<br />
Spain, Portugal, France, Italy, Greece and Cypress. Some of these countries<br />
have also created subsidy programmes for solar installations. The growing market<br />
potential of India and China should also provide attractive opportunities for<br />
German solar companies. Our forecast shows a gradual convergence between<br />
German production and installed domestic capacity (see Fig. 9). It is therefore<br />
essential for the German solar industry to expand its international distribution<br />
network and significantly increase its export quota.<br />
In view of the expansion plans of German module producers, we expect production<br />
capacities to rise over the next three years from 200 MW (y/e 2004) to 350<br />
MW (2005) and almost 410 MW (2006). Over the same period module production<br />
is set to increase from 174 MW (2004) to 300 MW (2006). If we add up the<br />
2006 capacity forecasts published by the module producers, total production capacity<br />
would work out at around 600 MW. Companies would therefore be well<br />
advised to carefully review their capacity expansion plans. Otherwise they will<br />
find it difficult to maintain in the long run the 100% capacity utilisation that many<br />
of them currently enjoy, especially in view of the shortage of solar-grade silicon<br />
discussed previously. We expect slightly moderated growth in the number of installed<br />
systems in Germany. Annual newly installed capacity is likely to rise from<br />
363 MW (y/e 2004) to 440 MW (+21% in 2005) and 505 MW (+15% in 2006).<br />
Fig. 9: Short and mid-term forecast for the PV market in Germany<br />
700<br />
Module production p.a. Production cap. at y/e Annual installed PV capacity<br />
600<br />
500<br />
MWp<br />
400<br />
300<br />
200<br />
100<br />
0<br />
2000 2001 2002 2003 2004 2005 2006 2007 2008 2009 2010<br />
Source: BSi, IEA-PVPS 2005, company information and <strong>Sarasin</strong> estimates<br />
The circle of listed solar<br />
companies is growing<br />
Investors have benefited from Germany’s solar boom as well. Shares in German<br />
solar companies have been surging ahead in recent months. Many companies<br />
seem to want to take advantage of the industry’s positive trend to float on the<br />
Dezember 2005 20
Solar Energy 2005<br />
stock market. After Conergy made a strong debut this year, companies such as<br />
Q-Cells, ErSol and others have followed suit.<br />
Germany as a driving force for<br />
achieving EU targets for<br />
renewables<br />
Very ambitious targets have been set in Germany for the growth of the PV market<br />
over the longer term, both on the part of the government and the industry associations<br />
(which are naturally more optimistic). Germany acts as a role model<br />
for the achievement of the goals set by the EU for renewables in its White Book<br />
in 1997: the percentage of renewables used is to be doubled from 6% to 12% by<br />
2010 across the whole of Europe. To achieve the target in 2010, growth has to<br />
continue at a rate of more than 30% p.a. This is an ambitious goal, and one that<br />
requires other countries to expand their photovoltaics as significantly as Germany.<br />
Japan<br />
Solar energy as a constituent of<br />
overriding energy targets<br />
In Japan, incentives to promote photovoltaics are an integral part of national energy<br />
policy. In sharp contrast to the US, the Kyoto protocol also plays a very important<br />
role. The government is committed to achieving a 7% reduction in 1990<br />
CO 2 emissions. Photovoltaics have been singled out as a means of achieving<br />
this reduction. The Ministry of Economy, Trade and Industry (METI) wants 10%<br />
of energy requirements to be met by renewables by 2030, with half of this<br />
(approx. 100 GW) coming from photovoltaics. A more concrete interim target of<br />
4.8 GW installed PV capacity has been set for 2010.<br />
Fig. 10: Short and mid-term market forecast for Japan<br />
Japan 2000 -2010<br />
Module production p.a. Production cap. at y/e Annual installed PV capacity<br />
1000<br />
900<br />
800<br />
700<br />
600<br />
[MWp]<br />
500<br />
400<br />
300<br />
200<br />
100<br />
0<br />
2000 2001 2002 2003 2004 2005 2006 2007 2008 2009 2010<br />
Source: up to 2004 IEA-PVPS, from 2005 <strong>Sarasin</strong><br />
RPVD programme ends<br />
in March 2006…<br />
The successful Residential PV System Dissemination Programme (RPVDP) to<br />
promote PV systems for private houses has made Japan a leader in PV in recent<br />
years. Despite falling lower subsidies for each solar system installed (JPY 900/W<br />
in 2003; JPY 450/W in 2004, JPY 20/W in 2004), Japan has found a good balance<br />
between costs for individual consumers and state spending. Seemingly the<br />
RPVD programme had already used up the entire subsidies available by the end<br />
of September – well before its official end in March 2006. It’s not yet clear what<br />
will come after that. At the same time there are a number of local programmes<br />
whose future is also uncertain. Japanese utility companies have also announced<br />
that they would only extend their voluntary Net-Metering System, which compen-<br />
Dezember 2005 21
Solar Energy 2005<br />
sates customers for feeding solar energy into the mains grid, if the government<br />
maintains its PV subsidies.<br />
… but PV systems for public<br />
buildings will be promoted<br />
instead<br />
Instead of subsidising PV system for residential buildings, the METI is planning a<br />
programme of subsidies for 30-50 kW systems mounted on public buildings,<br />
schools, factories and office premises. Full details and a budget proposal will be<br />
submitted this autumn.<br />
There was no fall in the number of applications for funding from the RPVD programme<br />
even in the last year of its existence, despite the fact that its degressive<br />
tariffs meant it only provided a 3% subsidy (JPY 20/W) towards installation costs.<br />
This is strong evidence to suggest that the Japanese market for smaller PV systems<br />
owned by private customers can now be classed as virtually self-sufficient.<br />
Heavy export pressure likely<br />
In 2004 Japanese capacities for PV module production were around 650 MW.<br />
On the other hand, 273 MW new capacity was installed in Japan itself. This<br />
massive “capacity overhang” shows the strong export bias of Japanese producers,<br />
which is set to increase over the next 2-3 years. But the export business<br />
also carries risks: because Germany’s PV cell and module producers will soon<br />
outgrow the limits of their home market as well, pressure will inevitably mount on<br />
margins unless other countries take over the role of growth motor from Japan<br />
and Germany by then, and absorb the anticipated surplus production. Annual<br />
newly installed capacity is likely to rise from 273 MW (y/e 2004) to 340 MW<br />
(+25% in 2005) and 405 MW (+19% in 2006).<br />
USA<br />
Installed capacity up 43%<br />
Bush’s Energy Bill – Solar<br />
industry gets a sweetener<br />
Hold-ups in California’s<br />
support for solar power<br />
So far there has been no federal programme of subsidies for solar energy in the<br />
US. Some subsidies are available in individual states. This relatively modest<br />
support is also the reason why growth in the US has lagged Germany and Japan.<br />
Even so, 90 MW of new capacity was installed in 2004, which is equivalent<br />
to 43% growth on 2003.<br />
In August Congress passed a new Energy Bill offering investment tax credits<br />
(ITC) worth 30% of investment costs for commercially operated solar systems.<br />
This programme is due to start in January 2006. Private operators also receive a<br />
tax credit of 30%, but only on investments up to USD 2,000 per system. However,<br />
this subsidy applies to all forms of solar energy: both photovoltaics and solar<br />
thermal power. Since the incentive only runs to the end of 2007, the US solar<br />
industry (as well as the wind power industry) will be obliged to constantly fight for<br />
these investment tax credits to be extended. The new time limit will therefore do<br />
very little to encourage the expected security of investment, especially since for<br />
many Americans this incentive will not be enough to persuade them to purchase<br />
a solar system. For this to happen, individual states need to offer programmes<br />
with specific subsidies as well. The Energy Bill passed by Bush is therefore<br />
unlikely to trigger a PV boom in the US for the time being.<br />
Many people were also hoping for a new public subsidy programme in California,<br />
where the planned “Million Solar Roofs” programme is currently being delayed<br />
and watered down. Trade unions demanded a change so that only highly qualified<br />
electricians are allowed to install solar systems. But such a move would inflate<br />
installation costs and virtually cancel out the tax credit. Governor Schwar-<br />
Dezember 2005 22
Solar Energy 2005<br />
zenegger has recognised this threat and vetoed the law. Unfortunately this puts<br />
the entire programme on ice for the time being. Interest in solar energy has traditionally<br />
been very high in California, and last year almost half of America’s entire<br />
PV capacity was installed in this state. Electricity consumption is particularly high<br />
in the summer in this region, when air conditioners are turned up high. Solar energy<br />
can meet this need very well, as it is particularly suited to dealing with this<br />
type of peak load.<br />
Fig. 11: Short and mid-term market forecast for the US<br />
700<br />
USA 2000 - 2010<br />
Module production p.a. Production cap. at y/e Annual installed PV capacitiy<br />
600<br />
500<br />
[MWp]<br />
400<br />
300<br />
200<br />
100<br />
0<br />
2000 2001 2002 2003 2004 2005 2006 2007 2008 2009 2010<br />
Source: up to 2004 IEA-PVPS, from 2005 <strong>Sarasin</strong><br />
In the entire USA there are more than 50 different PV programmes of individual<br />
federal states and utility companies. However, these fragmented measures have<br />
not had the same sweeping effect as the unified subsidy mechanisms in Germany<br />
and Japan. The key to the US solar market therefore still lies in California.<br />
Cell and module production<br />
pick up again in 2004<br />
Last year cells with a capacity of 138 MW and modules with a capacity of 139<br />
MW were produced in the US. After production fell in 2003, it picked up again by<br />
35% in 2004, while module production rose as much as 95%. This fosters the<br />
hope that the trend will turn positive again. For 2005 we forecast newly installed<br />
capacity of 125 MW (+39%) and 2006 a capacity of 180 MW (+44%).<br />
Other important markets<br />
Spain has attractive<br />
conditions for solar energy<br />
Good conditions for a future booming market exist in Spain, which has now introduced<br />
feed-in tariffs for renewable energy that are even more attractive than<br />
Germany’s. Spain currently offers a tariff of EUR 0.42 per kWh for PV systems<br />
under 100 kW and a rate of EUR 0.22 EUR for systems with an output of over<br />
100 kW (incl. solar thermal power stations), payable over a period of 25 years.<br />
After that, 80% of the tariff is paid until the end of the system’s working life. Soon<br />
the threshold for the programme is due to be raised from the current level of 150<br />
MW to 400 MW for PV systems and from 200 MW to 500 MW for solar thermal<br />
power stations. Some initial teething problems led to certain bureaucratic obstacles,<br />
and made the formulation of the legislation more complicated. But Spain is<br />
obviously a very attractive country for solar energy because of its ample sunshine.<br />
Last year 10 MW of new capacity was installed (+53%). Interestingly, almost<br />
half the installations were greenfield sites (solar parks). Just recently Euro-<br />
Dezember 2005 23
Solar Energy 2005<br />
pressedienst conducted a detailed study of Spain’s photovoltaics market. 5 Its<br />
forecast for installed PV capacity is 265 MW by 2010. Our estimates are around<br />
228 MW, with an average annual growth rate of 68% over the period 2004 to<br />
2010.<br />
Italy also has feed-in<br />
legislation<br />
Portugal soon to have the<br />
world’s biggest solar<br />
installation<br />
South Korea also has<br />
a feed-in tariff<br />
Where does the future of<br />
photovoltaics lie?<br />
Development in non-PVPS<br />
countries<br />
In Italy systems up to 20 kW are entitled to a feed-in tariff of EUR 0.445 per<br />
kWh, while those with an output between 20 and 50 kW receive EUR 0.46 per<br />
kWh. Systems above 50 kW and up to a limit of 1 MW have to submit a tender,<br />
and can receive a maximum reimbursement of EUR 0.49 per kWh. These tariffs<br />
initially apply for 2005 and 2006, and then drop by 2% every year for new systems.<br />
The amount of subsidised PV capacity is expected to be roughly 100 MW<br />
by 2015, but can be increased to 300 MW if the ceiling is already reached before<br />
then. However, the law is based on a confusing mix of different incentive systems<br />
(net energy fed in, invitation to tender, reimbursement, etc.) and will take<br />
time to make an impact. Our estimates are for 73 MW of newly installed capacity<br />
in 2010, with an average annual growth rate of 58% over the period 2004 to<br />
2010.<br />
Feed-in tariffs have also been recently revised upwards in Portugal as well. Tariffs<br />
are currently EUR 0.41 per kWh for systems under 5 kW and EUR 0.244 per<br />
kWh for those over 5 kW. The government is aiming for 150 MW of installed<br />
power up to 2010. But this figure could be far higher considering that the system<br />
planned by BP Solar, and due to be connected to the grid in 2009, will boast a<br />
capacity of 62 MW.<br />
South Korea is a very promising growth market for solar energy. As a country<br />
with few natural resources, South Korea’s government is attempting to reduce its<br />
dependency on oil imports by introducing an attractive programme of market incentives<br />
to encourage the expansion of renewable energies. As in Germany, the<br />
construction of solar systems is being encouraged with tax credits and every<br />
kilowatt hour of solar energy fed into the mains grid is reimbursed at a tariff of 58<br />
cents, a rate guaranteed for 15 years.<br />
Installations in developing and newly industrialised countries<br />
It’s important to remember that despite the huge boom in Germany, electricity<br />
from PV installations still only makes up a relatively small share of total electricity<br />
consumption. Since at our latitude we can expect around 800 kWh per kWp per<br />
year, the 1,000 MW capacity accumulated in spring results in an electricity output<br />
of approximately 0.8 billion kWh (0.8 TWh). By comparison, Germany’s annual<br />
electricity consumption is around 500 TWh. Solar energy therefore accounts<br />
for less than 0.2%. Again, by way of comparison: Last year hydroelectric power<br />
contributed 21 TWh, and wind energy as much as 25 TWh.<br />
According to information from IEA-PVPS, the use of photovoltaics in countries<br />
outside the OECD, or non-PVPS countries 6 , is mainly limited to smaller residential<br />
systems (solar home systems) and applications on public buildings such as<br />
5<br />
6<br />
The Spanish photovoltaics market 2005/06 – Risks and opportunities of up-and-coming export markets;<br />
Europressedienst EuPD, Bonn, September 2005<br />
OECD countries that are not PVPS members: Belgium, Czech Republic, Finland, Greece, Hungary, Iceland,<br />
Ireland, Luxembourg, New Zealand, Poland, Slovakia and Turkey.<br />
Dezember 2005 24
Solar Energy 2005<br />
hospitals, schools, water utilities and telecommunications. Off-grid PV systems<br />
are the main application in developing and newly industrialised countries (see<br />
Fig. 12). In total non-PVPS countries already had over 230 MW capacity (cumulative)<br />
installed in 2004, equivalent to roughly 9% of the 2,600 MW PV capacity<br />
installed in PVPS countries.<br />
Fig. 12: Total installed PV capacity (cumulative) in non-PVPS countries<br />
100<br />
90<br />
80<br />
70<br />
60<br />
[MW]<br />
50<br />
40<br />
30<br />
20<br />
10<br />
0<br />
India<br />
China<br />
Thailand<br />
South Africa<br />
Morocco**<br />
Indonesia<br />
Zimbabwe*<br />
Nepal<br />
Brazil*<br />
Kenya*<br />
Malaysia<br />
Sri Lanka<br />
Source: IEA PVPS 2005; figures from 1999*, 2003*, otherwise 2004<br />
India in fourth place for offgrid<br />
PV systems<br />
China forging ahead with<br />
photovoltaics<br />
Thailand sets itself goals for<br />
PV expansion<br />
Off-grid PV systems<br />
are the future<br />
With a cumulative capacity of around 86 MW, India is number four in the world<br />
rankings behind the big three – Japan, Germany and the US. Already more than<br />
320,000 solar home systems (SHS) have been installed with subsidies from the<br />
government’s PV programme. The government’s target is 280 MW of capacity by<br />
2012, including solar thermal installations.<br />
China’s cumulative capacity has trebled since 2001 to approximately 70 MW,<br />
boosted especially by a National Township Electrification Programme (SDDX).<br />
By the end of the year, more than 600 towns are to be supplied with 16 MW solar<br />
power under the programme. SDDX will be followed next year by a National<br />
Village Electrification Programme (SDDC) which will install 265 MW of solar energy<br />
in 10,000 villages by 2010. In January 2006 a Renewable Energy Act<br />
should provide a further boost for photovoltaics through feed-in tariffs and attractive<br />
tax credits. The feed-in tariffs for the individual technologies are still being<br />
haggled over. We expect China to install more than 200 MW per year up to<br />
2010.<br />
Thailand also wants to achieve installed capacity of 250 MW by 2011. To this<br />
end the government has set up a “Renewable Portfolio Standard” programme<br />
which alone should contribute 200 MW in capacity.<br />
The above examples show that developing and newly industrialised countries<br />
will be important markets for photovoltaics in future. In these regions some two<br />
billion people have no access to mains electricity. Small decentralised solar<br />
home systems (SHS) or PV hybrid systems for supplying electricity to villages<br />
are often the quickest and cheapest way to substantially improve the living standards<br />
of predominantly rural populations. Not just PV cell and module manufacturers,<br />
but the entire business of solar systems technology stands to benefit from<br />
this huge sales market. Export markets for rural electrification programmes encompass<br />
the financing, supply, installation and operation of off-grid power plants.<br />
Dezember 2005 25
Solar Energy 2005<br />
The insert in the next box outlines the special criteria that have to be met in order<br />
to exploit this enormous potential:<br />
Criteria that PV systems have to meet for use in non-OECD countries<br />
Selling PV systems to developing and newly industrialised countries carries certain risks for<br />
all parties involved. Ultimately photovoltaics are certainly the cheapest solution in rural areas,<br />
because the energy requirement of each individual is so small that it is not economical<br />
to install or extend a mains supply. But the direct purchase of a PV system by the end users<br />
is usually not an option either, as they do not have the necessary financial means. Many of<br />
them are used to spending USD 3-10 of their tiny household budget every month on candles,<br />
kerosene or batteries. But there is seldom any financial institution available to offer micro<br />
credit (USD 300-500) for such a major investment. Another stumbling block is the creditworthiness<br />
of the end user. This problem can be solved with the help of international<br />
development agencies, such as the KfW development bank or the World <strong>Bank</strong>.<br />
Another obvious difficulty is that even though the technical quality of the systems may be<br />
good, minimum regular maintenance is still required and this has to be organised locally. To<br />
be successful in this market, companies therefore need adequately qualified local staff. The<br />
cost of training these people cannot usually be recouped through the sale of PV systems. In<br />
this case close collaboration between the industry and institutions for technical collaboration,<br />
such as GtZ or KfW, can be of mutual benefit. With this in mind, the industry association<br />
Club for Rural Electrification was set up in 2000 under the leadership of the Fraunhofer-<br />
Institut Solare Energiesysteme ISE in order to promote rural electrification through renewable<br />
energies.<br />
One of the defining characteristics of successful rural electrification projects is therefore that<br />
sufficient consideration is also given to social aspects and to the fact that ultimately advanced<br />
technology will need to be integrated into a society that is not usually technically<br />
oriented. This market holds enormous potential for the solar industry. Simply supplying 1%<br />
p.a. of the non-electrified population with 10 W of power per person equates to a market<br />
volume of 200 MW per year. If, taking into account all the components and services, we assume<br />
a price of roughly EUR 10 per watt in an off-grid PC system, this corresponds to potential<br />
annual sales of EUR 2 billion.<br />
Felix Holz, Fraunhofer ISE, Institut Solare Energiesysteme, Head of Group<br />
Off-Grid Power Supply Systems, Freiburg (Germany).<br />
PV market trends up to 2020<br />
Approx. 1,100 MW of new<br />
capacity installed in 2005<br />
2010: newly installed PV<br />
capacity of 3.0 GW<br />
According to our estimates, around 840 MW of new PV capacity was installed in<br />
2004 and this year the figure will be around 1,100 MW. This is equivalent to a<br />
growth rate of 30%. Our long-term forecast shows the development of new PV<br />
capacity installed globally every year, rather than annual PV cell production<br />
(as in last year‘s report). We based our forecast on the market estimates for the<br />
most important countries. The historical data are based on information from IEA-<br />
PVPS. The annual comparison shows that the PV capacity actually installed is<br />
much lower than the figure for solar cell production. One plausible explanation<br />
for this, however, is the time lag between the production of PV cells and the installation<br />
of complete PV systems, at the same time as growth rates are soaring.<br />
This year, and in the next 2-3 years, the installed capacity will be curbed by the<br />
availability of PV modules, which is in turn due to the shortage of solar-grade<br />
silicon. The silicon supply bottleneck should improve after 2008. For 2010 we<br />
forecast around 3.0 GW of newly installed PV capacity worldwide. This corresponds<br />
to an average annual growth rate of 23.6% for the period 2004-2010.<br />
Dezember 2005 26
Solar Energy 2005<br />
Fig. 13:<br />
<strong>Sarasin</strong> forecast for national PV markets (newly installed capacity p.a. in MW)<br />
Newly installed<br />
2003 2004 2005 2006 2007 2008 2009 2010 04-10<br />
Germany 153 363 440 505 571 611 641 673 10.8%<br />
Italy 4 5 9 15 23 34 51 73 58.1%<br />
Spain 7 10 22 30 45 77 134 228 68.3%<br />
Rest of Europe 35 17 26 32 35 40 46 58 22.5%<br />
Europe 198 395 497 582 673 761 872 1032 17.4%<br />
USA 63 90 125 180 230 304 395 506 33.4%<br />
China 11 30 55 70 98 142 213 330 49.2%<br />
India 16 20 35 40 54 73 106 159 41.2%<br />
Japan 223 272 340 405 474 551 634 724 17.7%<br />
Rest of Asia 5 14 21 26 38 55 85 131 46.1%<br />
Asia 254 336 451 541 664 820 1038 1344 26.0%<br />
Rest of the world 15 23 32 37 43 58 81 123 32.0%<br />
Newly installed capacity p.a. 531 844 1105 1340 1611 1944 2386 3005 23.6%<br />
Annual growth rate 48% 59% 31% 21% 20% 21% 23% 26%<br />
Source: IEA-PVPS figures up to 2004, <strong>Sarasin</strong> estimates<br />
CAGR<br />
Shift in regional emphasis<br />
Off-grid systems becoming<br />
more important<br />
Main risks for the PV market<br />
Germany and Japan will become less important PV markets in relative terms, as<br />
their current prominence inevitably starts to wane. Our estimates show that<br />
Germany’s share of the global market, for example, will gradually drop from 43%<br />
(2004) to 23% (2010), and Japan’s from 32% to 24%. Other European markets<br />
such as Spain, Portugal or Italy, all of whom have a low starting level, will become<br />
increasingly important. In Asia, China, India, South Korea, Taiwan and<br />
Thailand will be the biggest winners and develop into important PV markets.<br />
At the moment grid-connected PV systems dominate, especially in the major<br />
markets of the industrialised world. But with the Asian markets growing so rapidly,<br />
along with developing and newly industrialised countries, off-grid systems<br />
will become increasingly important. The solar industry therefore needs to develop<br />
more products specifically for these markets and their applications.<br />
The following factors present risks that could constrain the anticipated positive<br />
development of the PV market:<br />
<br />
<br />
Persistent shortage of solar-grade silicon. Failure or delay in tackling the<br />
expansion of production capacities up to 2008 and beyond in a systematic<br />
way. This will prolong the silicon bottleneck.<br />
Delays or changes to important subsidy programmes. The solar industry<br />
is still heavily dependent on a number of individual markets where photovoltaics<br />
are still supported by subsidy programmes.<br />
- The change of government in Germany poses a certain risk. However, we<br />
do not expect to see any significant amendment to the Renewable Energy<br />
Act until it comes up for regular renewal in 2007.<br />
- Further delay to California’s “Million Solar Roofs” programme could postpone<br />
the expected boom in the US market.<br />
- Critical transition phase in Japan: It’s not clear yet whether the Japanese<br />
market is fully developed enough to cope with the loss of subsidies when<br />
the PVRDP runs out in 2006.<br />
Dezember 2005 27
Solar Energy 2005<br />
<br />
<br />
Higher interest rates. Because of the high capital costs associated with PV<br />
systems, rising financing costs due to higher interest rates exert their full impact<br />
on total costs, which could dampen demand. This is particularly true for<br />
commercial operators of PV systems.<br />
Increasing competition from their own camp in the form of alternative solar<br />
technologies such as solar power stations (see chapter 3).<br />
Threatening energy crisis<br />
implies upside potential<br />
Diminishing resources and soaring prices in the oil market could promise additional<br />
upside potential for solar energy. There has been a marked increase in<br />
governments’ willingness to promote renewable energies through incentives<br />
such as feed-in payments or tax breaks. In addition, conventional energy production<br />
is generally becoming more expensive, so the gap with solar energy is narrowing.<br />
In the field of hybrid systems, photovoltaics can either replace or supplement<br />
diesel generators. Here the price of oil has a direct influence on demand for PV<br />
systems. This market is limited mainly to the USA and developing countries, and<br />
is only of secondary importance compared with the currently dominant gridconnected<br />
applications.<br />
For thermal solar energy use, the costs of fossil alternatives (usually heating oil)<br />
are an even more important factor than for photovoltaics. This economic substitution<br />
mechanism is showing its first measurable results, since the oil price has<br />
been so high for a long time and because people think it will remain at that level.<br />
Conclusion: Modest but<br />
steady growth over<br />
the longer term<br />
In the longer term, however, the opportunities afforded by photovoltaics are still<br />
far from being exhausted. The easing of growth rates caused by the silicon bottleneck<br />
helps to prevent the market from overheating and therefore encourages<br />
healthy growth in the long run. We expect costs to be significantly reduced as a<br />
result of advances in manufacturing methods (bigger units, automation) and<br />
various new technologies reaching market maturity. This should allow production<br />
capacity to revert to the growth path it has shown since the end of the nineties.<br />
According to this scenario, the annual installed capacity will therefore more than<br />
quadruple from 3.0 GW in 2010 to around 15.5 GW in 2020. This is equivalent to<br />
an annual average growth rate of 18%.<br />
Fig. 14: <strong>Sarasin</strong>’s long-term forecast for the global PV market<br />
New ly installed p.a. (left scale)<br />
Annual grow th rate (right scale)<br />
16000<br />
80%<br />
14000<br />
70%<br />
12000<br />
60%<br />
10000<br />
8000<br />
6000<br />
4000<br />
2000<br />
0<br />
2000<br />
2001<br />
2002<br />
2003<br />
2004<br />
2005<br />
2006<br />
2007<br />
2008<br />
2009<br />
2010<br />
2011<br />
2012<br />
2013<br />
2014<br />
2015<br />
2016<br />
2017<br />
2018<br />
2019<br />
2020<br />
Newly installed p.a. [MW]<br />
50%<br />
40%<br />
30%<br />
Annual growth rate<br />
20%<br />
10%<br />
0%<br />
Source: <strong>Sarasin</strong>, 2005<br />
Dezember 2005 28
Solar Energy 2005<br />
Assessing the sustainability of PV systems<br />
It is frequently assumed that renewable energies must, a priori, be sustainable.<br />
The manufacture of PV cells in particular is an energy-intensive process that<br />
uses a lot of chemicals, and it is therefore worth taking a closer look at this issue.<br />
EU project “Crystal Clear”<br />
confirms PV systems’ short<br />
energy payback times<br />
An EU project conducted in this area under the name “Crystal Clear” 7 , which<br />
runs to 2008, is currently examining the entire life cycle of the PV cell from the<br />
silicon raw material to the finished PV module. The aim is to reduce the production<br />
costs for solar modules by approximately 60%. The intention is also to try<br />
and cut the energy payback time from the current 3-5 years to just two years.<br />
Before this could happen, more up-to-date figures had to be collected, as all<br />
studies on the subject of energy payback times of crystalline solar systems had<br />
previously been based on a study published in 1992 by the Munich energy research<br />
institute Forschungsstelle für Energiewirtschaft. This was in turn based<br />
on German production lines using technology developed in the eighties.<br />
Preliminary Crystal Clear results, which were presented in June at the 20th<br />
European Photovoltaics Conference in Barcelona, show an improvement of<br />
around 25% in energy payback times compared with five years ago. This is<br />
mainly attributable to advances in the efficient use of the silicon raw material.<br />
Further improvements are anticipated with the wafer thickness being reduced to<br />
150 µm. The project examined solar modules with polycrystalline and monocrystalline<br />
cells and modules with string ribbon cells. With the latter type of cell,<br />
there is no sawing of the wafer, thereby resulting in highly efficient use of silicon,<br />
which is a very energy-intensive material. The energy payback time for PV systems<br />
in Central Europe (750 kWh/kW) is 2.6 to 4.4 years, and for Southern<br />
Europe (1,275 kWh/kW) 1.5 to 2.5 years.<br />
Fig. 15: Energy payback time for modern solar systems (preliminary results)<br />
5<br />
Southern Europe<br />
Central Europe<br />
4<br />
3<br />
Years<br />
2<br />
1<br />
0<br />
Ribbon/sheet Polycrystalline Monocrystalline<br />
Source: EU Crystal Clear project, 2005<br />
The environmental rating of photovoltaics is determined not only by the energy<br />
payback time, but also by the disposal and recycling problem. The PV industry is<br />
not directly affected by the new European environmental directives WEEE and<br />
RoHS 8 . Even so, a preliminary warning needs to be sounded.<br />
7<br />
8<br />
Project results can be found under: www.chem.uu.nl/nws/www/publica/E2005-32.pdf<br />
www.bmu.de/elektrogesetz<br />
Dezember 2005 29
Solar Energy 2005<br />
WEEE directive<br />
The WEEE directive (waste of electric and electronic equipment) makes it compulsory<br />
for the industry to take back used electronics products.<br />
At present PV modules are explicitly excluded. But solar-powered calculators,<br />
clocks, etc. already fall under the directive. It is quite feasible that the legal situation<br />
could change once photovoltaics develop from a niche product into a massproduced<br />
technology.<br />
Initial initiatives are already under way for the recycling of solar modules.<br />
Deutsche Solar has set up a recycling plant and feeds the recovered solar-grade<br />
silicon back into its production process. Although the procedure for recycling wafers<br />
is rather laborious, it makes both environmental and financial sense because<br />
of the high manufacturing costs and the general shortage of raw material.<br />
Fragments of cells cannot be worked up directly into wafers, but first have to be<br />
melted and formed into silicon ingots. This leads to high energy consumption<br />
and substantial material loss. On the other hand, the recycled wafers can now<br />
also be produced in bigger dimensions.<br />
First Solar also takes back its CIS cells. However, this company uses the harmful<br />
substance cadmium, and its public reputation is therefore more vulnerable.<br />
A “green industry” such as photovoltaics would do well to proactively engage<br />
with these problems. Only if the industry takes the initiative itself in organising<br />
the return and disposal of its products will it be able to avoid the WEEE being<br />
extended to PV components as the quantities of materials it uses continue to<br />
grow in future.<br />
RoHS directive<br />
<strong>Sustainability</strong> also an issue<br />
in the IEA-PVPS<br />
PV components are not currently affected by the EU’s RoHS directive (restriction<br />
of the use of certain hazardous substances). As of 1 July 2006 lead, mercury,<br />
cadmium, hexavalent chromium and other substances can basically no longer be<br />
used in the manufacture of electrical and electronic equipment. The plan to ban<br />
lead in particular presents a challenge to the solar industry. Traditionally solder<br />
containing lead has almost always been used to join together the individual PV<br />
cells. But lead-free products are already available. Schott Solar uses solder<br />
made of 96.5% tin and 3.5% silver; the percentage of lead is tiny and complies<br />
with RoHS requirements. Crystalline modules produced by Mitsubishi Electric<br />
have been lead-free since 2003, according to company information. The RoHS<br />
directive presents a special challenge for manufacturers of thin-film modules<br />
based on cadmium telluride (CdTe). They will need to be granted a special exemption<br />
from the RoHS rules.<br />
At the 20th European Photovoltaics Conference in Barcelona the IEA-PVPS 9 organised<br />
a workshop on the topic of sustainability. Experts from the fields of environmental<br />
audit, recycling, product return systems and legislative bodies discussed<br />
the status quo. The results of the workshops reveal a common<br />
awareness of the issues and the need for further research into this area, as well<br />
as improved technical conditions.<br />
9<br />
www.iea-shc.org<br />
Dezember 2005 30
Solar Energy 2005<br />
Solar collectors<br />
Overview<br />
High energy prices<br />
fuel demand<br />
Contribution from solar<br />
thermal power is<br />
underestimated<br />
As in 2003 and 2004, the second section of our report deals with the active application<br />
of solar thermal energy with the help of solar collectors, i.e. generating<br />
heat from the sun’s thermal radiation. Please refer to our 2003 report for a detailed<br />
description of the technologies used. In this year’s review we concentrate<br />
on a description of European companies, an overview of the market and an update<br />
to our forecasts.<br />
Higher oil and gas prices are actually fuelling demand for solar heating systems<br />
more strongly than for photovoltaics. On the other hand, many countries do not<br />
offer adequate political support for solar thermal power. With photovoltaics, feedin<br />
tariffs for renewable energy provide the necessary investment security, but<br />
there is no equivalent legislation in the solar thermal power segment.<br />
Compared with other forms of renewable energy, solar heating’s contribution towards<br />
meeting global energy demand is second only to wind power, and much<br />
bigger than photovoltaics’ contribution. This fact is often underestimated. The<br />
newly defined conversion factor of 0.7 kW th per m 2 of collector area makes it<br />
simple to compare the capacities of the different renewable energies currently in<br />
use. Fig. 16 shows the projected cumulative capacity (GW e/th ) at the end of 2005<br />
for wind, geothermal, photovoltaics, solar heating and solar thermal power stations,<br />
as well as the energy produced in one year (TWh e/th ). In its World Energy<br />
Assessment based on figures from 1998, the UNDP showed a similar table. 10<br />
Fig. 16: Cumulative capacity (GW) at y/e 2005 and energy generated (TWh)<br />
Cumulative capacity y/e 2005 (left scale)<br />
Estimated energy production (right scale)<br />
100<br />
150<br />
90<br />
80<br />
70<br />
60<br />
80<br />
60<br />
120<br />
135<br />
120<br />
105<br />
90<br />
[GW]<br />
50<br />
68.56<br />
75<br />
[TWh]<br />
40<br />
58<br />
60<br />
30<br />
45<br />
20<br />
10<br />
0<br />
10<br />
4<br />
4<br />
0.5 1.3<br />
Solar collectors Wind Geothermal Photovoltaics Solar thermal PP<br />
30<br />
15<br />
0<br />
Source: <strong>Sarasin</strong> estimates, 2005<br />
Leading players in solar thermal power<br />
Concentration<br />
at the top<br />
The global solar collector industry is very fragmented and has many small players.<br />
As far as European companies go, however, certain major players are<br />
slowly starting to crystallise. The Austrian company GreenOneTec, Europe’s<br />
biggest producer of flat-plate collectors, has taken over the European number<br />
10<br />
World Energy Assessment, Energy and the challenge of sustainability, UNDP, 2000, New York<br />
Dezember 2005 31
Solar Energy 2005<br />
two, the Greek company Foco. A third important player is involved in this merger:<br />
Denmark’s VKR Holding, which owns a stake in both companies. Other important<br />
companies who want to compete in the premier league include Schüco, Viessmann<br />
and BBT. All three have announced or already completed additional<br />
expansion plans for their solar business. Fig. 17 provides an overview of the<br />
most important European players in the solar heating industry.<br />
Fig. 17: The most important European players in the solar heating industry<br />
Company Production 2004 Sales 2004 Employees 2004<br />
(1000 m2 collector area) (EUR m)<br />
Total Solar heating Total Solar heating<br />
Alanod-Sunselect (DE) 900 (C) 255
Solar Energy 2005<br />
lectors will be concentrated in one plant operated by Solarcap (see VKR Holding)<br />
in Denmark, in an attempt to exploit synergy effects and economies of scale.<br />
Giordano Industries<br />
GreenOneTec<br />
Huemer Group<br />
KBB<br />
Paradigma/Ritter Solar<br />
Rheem/Solahart<br />
Schott Rohrglas<br />
Schüco<br />
Jacques Giordano Industries has been producing solar heating systems for more<br />
than 20 years. Giordano not only offers glazed solar collectors, but a solarpowered<br />
shower and plastic absorbers for swimming pools. In particular, the<br />
company is also active in France’s overseas territories.<br />
GreenOneTec is a technology leader and easily the biggest producer of solar<br />
collectors in Europe. Following the integration of Foco’s production facilities,<br />
production of roughly 500,000 m 2 is planned for 2006. According to statements<br />
from CEO Robert Kanduth, a second phase of capacity expansion to 1 million m 2<br />
is on the cards.<br />
The Huemer Group comprises the companies Böhm (absorber production),<br />
Sunmaster (collector production) and Xolar (regional trading and assembly). This<br />
up-and-coming company is focused on OEM production, but also develops new<br />
connection techniques for absorbers.<br />
The young company KBB has sold its production facilities and know-how in the<br />
field of soldering technology and laser welding of absorbers to Viessmann, which<br />
has traditionally been the biggest customer of KBB products. In future KBB plans<br />
to concentrate not only on absorber production, but increasingly on the manufacture<br />
of flat-plate collectors (OEM).<br />
Paradigma/Ritter Solar is now the leading provider of evacuated tube collectors<br />
(ETC) in Germany. The joint venture with the Chinese company Linuo is very<br />
successful. Ritter Solar now offers an ETC product, the “Aqua-System”. Here the<br />
hot water flows directly through the ETC and existing storage modules can be<br />
included in the system.<br />
With a collector area of 320 Tm 2 , Australia’s Rheem/Solahart is a globally active<br />
company and a leader in the field of hot water systems (gas, electric and solar<br />
powered). The market focus is on the southern hemisphere, mainly the sale of<br />
thermosiphon systems. The company also makes flat-plate and tube collectors<br />
(a recent addition). The acquisition of Edwards, Australia’s number two in hot<br />
water systems, enabled Rheem/Solahart to significantly strengthen its position.<br />
Schott Rohrglas is best known for its collector tubes with high vacuum insulation.<br />
Schott Rohrglas also makes tubes for parabolic through receivers, a key component<br />
in solar thermal power stations. The receiver tube is 4 m long. This makes<br />
Schott one of the global leaders in the solar industry, and it is the only company<br />
to offer components for virtually all the application fields of photovoltaics and solar<br />
thermal power.<br />
Schüco is working hard to expand its solar heating business, especially in Germany.<br />
In mid-August the company announced that the future “theoretical production<br />
capacity” of its collector plant in Bielefeld would be 1.5 million m 2 . Schüco<br />
pursues a successful marketing policy and offers integrated solutions (integration<br />
of solar heating and PV systems into buildings/façades).<br />
Dezember 2005 33
Solar Energy 2005<br />
Thermomax<br />
TiNOX<br />
Viessmann<br />
Wagner Solar<br />
VKR Holding<br />
With an output of 38 Tm 2 collector area, the British company Thermomax is<br />
Europe’s biggest producer of evacuated tube collectors (ETC). The company<br />
makes substantial investments in quality assurance and process optimisation. It<br />
is increasingly developing applications in the field of solar-assisted cooling<br />
(SAC). Its quota of exports to non-EU countries is rising.<br />
TiNOX, the original pioneer of the distinctive blue titanium absorber tapes, was<br />
taken over by MAGE Industrie Holding in the summer of 2003 and is now number<br />
two behind Alanod-Sunselect. The MAGE Group combines several mediumsized<br />
industrial companies that are internationally active in the ancillary construction<br />
trade, specialising in roof technology, facade technology and fastening technology.<br />
Within the Group, TiNOX represents the main arm of the renewable energies<br />
business.<br />
Having increased its collector area capacity by 30%, Viessmann is now joint<br />
leader in solar systems in Germany, along with BBT. But Viessmann is also expanding<br />
its plant in Faulquemont (France). In addition to the coating line, a soldering<br />
and laser welding facility is planned for next year. This would enable the<br />
company to cover the entire production chain. Viessmann also offers PV systems<br />
based on flat-plate collectors.<br />
Wagner Solar grew from a pioneer to an SME company with a strong innovation<br />
drive, including non-reflective solar glass and flat-plate collectors that currently<br />
offer the highest energy yield. The company offers Europe’s most powerful flatplate<br />
collector using Iso-AR-Glass. Wagner Solar is also successful at selling PV<br />
modules and (a recent addition) heating systems powered by wood pellets. In<br />
2005 the company expects to achieve more than 100,000 m 2 of collector area<br />
and sales in excess of EUR 100 m for the first time. Wagner Solar is also expanding<br />
in other EU countries and has set up several local offices for this purpose.<br />
VKR Holding is one of the companies behind the merger between GreenOneTec<br />
and Foco. This Danish holding company, which includes the leading manufacturer<br />
of roof windows Velux, owned a majority shareholding in Foco through its<br />
Danish company Solarcap, and also has a significant holding in GreenOneTec.<br />
Last year the combined output of the two OEM manufacturers was a collector<br />
area of around 400,000 m 2 (280 MW th ). This gives them a European market<br />
share of almost 25%.<br />
Principal global markets<br />
Global growth<br />
of 30% in 2004<br />
There are still huge differences between national markets in terms of newly installed<br />
collector area. China, easily the world’s biggest market, continues to enjoy<br />
dynamic expansion and sets the global pace of growth. Newly installed capacity<br />
in 2004 came to 11,700 MW 11 th (16.72 million m 2 ), an increase of roughly<br />
30% on 2003 (see Fig. 18). Around 75% of this capacity was installed in China.<br />
Apart from China, other important markets include Germany, Greece, Austria<br />
and also Turkey, Israel and Japan. The biggest markets for solar collectors are<br />
11<br />
In this report the installed solar collector capacity is no longer expressed in square metres, but for the<br />
sake of consistency in kilowatts of thermal energy based on the new conversion factor of 0.7 kW th /m 2 .<br />
For more details, visit www.iea-shc.org<br />
Dezember 2005 34
Solar Energy 2005<br />
therefore located in Asia and Europe, even though other regions would be more<br />
advantageous as they enjoy more sunshine.<br />
Fig. 18: newly installed collector capacity (MW th ) in 2004<br />
Australia 154<br />
Japan 186<br />
Israel 266<br />
Turkey 336<br />
Europe 1'121<br />
Latin America 224<br />
Rest of A sia 370<br />
Africa 98<br />
USA /CDN 91<br />
RoW 119<br />
China 8'750<br />
Underlying data: W.B. Koldehoff, October 2005<br />
Top ten solar collector<br />
countries: China and Australia<br />
overtake Germany<br />
Australia expanding, but<br />
2004 was a difficult year<br />
Enormous potential<br />
for solar heating<br />
China’s dominance in newly installed area is mainly due to the huge size of its<br />
population. But even in pro capita terms, China's capacity of 6.7 kW th per 1,000<br />
inhabitants now puts it in fifth place, which means it has overtaken the stagnating<br />
German market (6.4 kW th /1,000 inhabitants) during the last year. Since 2000<br />
China’s pro capita installation has risen by 20% p.a. and still shows no sign of<br />
slowing (see Fig. 18). Israel is still undisputed leader when measured by “newly<br />
installed capacity per 1,000 inhabitants”. Last year Israel managed to put a stop<br />
to the downturn it has suffered since 2001, and capacity rose again by 7%. Austria<br />
and Greece (second and third place) also increased their capacity again in<br />
2004, by 10% and 28% respectively. Turkey, Switzerland and Denmark all<br />
posted moderate growth. Spain has broken into the Top Ten for the first time,<br />
pushing out Japan by a whisker.<br />
Australia was unable to repeat its stunning 2003 performance of +136%, but still<br />
managed to grow well over 30%. It was a difficult year for Australia in relative<br />
terms. The 2003 boom was obviously fuelled by the Renewable Energy<br />
(Electricity) Act 2000, which came into effect in April 2001 12 . The rebate for installing<br />
a solar hot water system has since been cut from AUD 1,100 to 700. We<br />
therefore do not anticipate overly dynamic growth for the current year either.<br />
Next year new orders are anticipated from the State of Victoria, which passed a<br />
new building ordinance effective 1 July 2005. This stipulates that solar energy<br />
must ultimately cover 60% of hot water generation. With one stroke, this has<br />
created a potential market of some 30,000 systems.<br />
The example of Australia shows how sensitively a young market can react to<br />
changes or uncertainties in state subsidy programmes. The cost of purchasing<br />
12<br />
www.greenhouse.gov.au/markets/mret/index.html<br />
Dezember 2005 35
Solar Energy 2005<br />
heating systems powered by solar collectors is higher than for a conventional<br />
heating system. A sensible programme of subsidies, combined with rising or high<br />
fossil fuel prices, can open up enormous potential here. Unlike photovoltaics, solar<br />
heating directly replaces valuable gas, oil or electricity that is used for heating<br />
or cooling purposes. This would allow Europe to replace around 30% of its oil<br />
imports form the Middle East, for example.<br />
Fig. 19: Top ten countries – Market size per head of population: Annual newly<br />
installed collector capacity in kW th per 1,000 inhabitants<br />
New ly installed collector area in m2/1000 people<br />
Sw eden<br />
2.01<br />
2.24<br />
Israel<br />
52.33<br />
56.98<br />
Austria<br />
Greece<br />
Australia<br />
3.63<br />
8.54<br />
15 .0 7<br />
14 .3 0<br />
20.50<br />
18 .7 9<br />
2003<br />
2002<br />
2001<br />
1995<br />
China (PRC)<br />
7.37<br />
6.32<br />
Germany<br />
9.09<br />
6.79<br />
Turkey<br />
6.08<br />
6.89<br />
Sw itzerland<br />
3.65<br />
3.66<br />
Denmark<br />
3.53<br />
2.42<br />
0 10 20 30 40 50 60 70<br />
Underlying data: W.B. Koldehoff, October 2005<br />
Cumulative collector<br />
capacity rose 19% worldwide<br />
Fig. 20 illustrates the collector capacity currently in service in the individual countries<br />
and regions at the end of 2004. Compared with 2003, this capacity has<br />
grown 19% to a total of 73 GW th . The geographical spread has stayed relatively<br />
stable. China is also in top place in terms of the amount of solar collector capacity<br />
actually in service, with a share of 62% compared with 59% last year.<br />
Fig. 20: Total global solar heating systems in service at y/e 2004. Total<br />
capacity = 73 GW th<br />
Israel<br />
4.4%<br />
Turkey<br />
7.2%<br />
Japan<br />
7.3%<br />
RoW<br />
6.1%<br />
Europe<br />
13.6%<br />
China<br />
61.5%<br />
Underlying data: W.B. Koldehoff, October 2005<br />
Dezember 2005 36
Solar Energy 2005<br />
China<br />
China: biggest market<br />
still growing<br />
China is the world’s biggest market for solar heating, with a share of almost 75%<br />
of the total collector capacity installed worldwide in 2004. This is equivalent to a<br />
newly installed capacity of 8,750 MW th , a percentage increase of roughly 31.5%.<br />
The cumulative capacity at y/e 2004 was around 44,900 MW th . 90% of systems<br />
are installed to heat water in private households, 10% in hospitals, schools, hotels,<br />
etc. About 85% are flat-panel collectors with thermosiphon systems and<br />
15% evacuated tube collectors. There is a trend towards higher quality flat-panel<br />
collectors with longer service life, especially for large showpiece projects. More<br />
and more of these high-quality collectors will also be destined for export. To this<br />
end China is increasingly looking to enter collaborations with western/European<br />
institutions in the areas of quality and standardisation. A number of providers of<br />
evacuated tube collectors are already outsourcing manufacture of their glass<br />
tubes to China. Growth in China does not benefit from government subsidisation<br />
programmes for installing the systems. Funding is only provided for research and<br />
development. But volume growth is expected to remain high for the coming<br />
years, because rural and suburban regions are likely to experience increasing<br />
energy shortages with booming industry taking up more and more of the limited<br />
energy supply. The government’s target is for a cumulative collector capacity of<br />
100 MW th in 2010, and 190 MW th in 2020.<br />
Japan<br />
Japanese market in crisis<br />
Last year around 186 MW th of new collector capacity was installed in Japan. This<br />
represents an increase in newly installed capacity of just 1% compared with<br />
2003. At year-end 2004 a total of around 5,330 MW th of collector capacity was in<br />
service. The Japanese market has been more or less stagnating since 1998. Up<br />
to the end of 2005 the government provides a subsidy of around EUR 100-140<br />
EUR/m 2 for a collector with a closed-loop system (no thermosiphon). This represents<br />
about 10% of the investment costs. Subsidies will stop next year, because<br />
the government thinks that the collector market is big enough and stable enough<br />
to stand on its own feet. But this could tip the Japanese market into crisis. Furthermore,<br />
the products are not state of the art and some of them are aesthetically<br />
unappealing. Consumers see solar collectors as being rather outdated. The<br />
government target of 25 GW th cumulative collector capacity in 2010 is unlikely to<br />
be reached without additional supportive measures. This would require annual<br />
growth of 25% in the years to come. Our forecasts of newly installed capacity for<br />
the Japanese market are 192 MW th for 2005 and 198 MW th for 2006.<br />
Turkey<br />
Closed Turkish market<br />
is opening up<br />
Last year the Turkish market expanded by 3%, or 336 MW th . Per capita installation<br />
was 4.7 kW th per 1,000 inhabitants in 2004, placing Turkey seventh in the<br />
world rankings. People can afford solar collectors without government subsidies.<br />
It is quite simply the cheapest way to provide hot water. Because domestic demand<br />
is so high, a strong Turkish solar industry has developed. Over the years<br />
the quality of the systems has improved significantly, in particular in a drive to<br />
increase exports to Western Europe. Like Israel, Turkey was a relatively closed<br />
market for a long time, with its own product standards and own philosophy.<br />
There are now joint ventures between EU companies and Turkish firms to boost<br />
Dezember 2005 37
Solar Energy 2005<br />
sales of highly efficient solar collectors in the top price segment. 13 These products<br />
are particular attractive to the Turkish tourist industry.<br />
USA<br />
Rising oil & gas prices, and a<br />
new Energy Bill<br />
In the USA, solar collectors (mainly unglazed black tube systems) have been<br />
used exclusively to heat swimming pools. But now soaring oil and gas prices are<br />
kindling interest in combined hot water and heating systems powered by solar<br />
energy. This considerably shortens the payback period. In addition, many federal<br />
states have created incentive programmes for solar systems (both PV and solar<br />
heating). The recently passed national Energy Bill proposes tax credits for the<br />
installation of solar systems and explicitly includes solar heating systems as well.<br />
Our forecasts of newly installed capacity for the US market are 120 MW th for<br />
2005 and 157 MW th for 2006.<br />
Market trends in Europe<br />
2001 records beaten<br />
13% growth in<br />
installed solar collector<br />
capacity in 2004<br />
In 2004 Europe’s solar heating market more than made up the ground it lost in<br />
the past two years, and the 1,130 MW th newly installed solar collector capacity<br />
was more than in the record year of 2001 (1,030 MW th ). This was despite uncertainties<br />
about subsidisation conditions in the most important market, Germany,<br />
and increasing competition from photovoltaics in private household installations.<br />
According to figures published by ESTIF 14 in June 2005 for Europe 15 , newly installed<br />
collector capacity in 2004 rose 13% to 1,120 MW th (1.60 million m 2 ). This<br />
year we predict 17% growth to 1,311 MW th . We expect growth to average 13% in<br />
both the coming years (see Fig. 21).<br />
Fig. 21: Trends for solar collectors in Europe (EU 25, CH and Norway).<br />
<strong>Sarasin</strong> estimates for 2005 to 2007: 1311, 1488 and 1687 MW th<br />
In operation (left scale) New ly installed (right scale)<br />
In operation [GWth]<br />
18<br />
16<br />
14<br />
12<br />
10<br />
8<br />
6<br />
4<br />
2<br />
1'800<br />
1'600<br />
1'400<br />
1'200<br />
1'000<br />
800<br />
600<br />
400<br />
200<br />
Newly installed [MWth/a]<br />
0<br />
0<br />
1987<br />
1988<br />
1989<br />
1990<br />
1991<br />
1992<br />
1993<br />
1994<br />
1995<br />
1996<br />
1997<br />
1998<br />
1999<br />
2000<br />
2001<br />
2002<br />
2003<br />
2004<br />
2005<br />
2006<br />
2007<br />
Source: ESTIF, June 2005; W.B. Koldehoff, October 2005 and own estimates<br />
75% of collectors installed<br />
in Germany, Greece and Austria<br />
In Europe, sales of solar collectors are still concentrated in three countries: Germany,<br />
Greece and Austria (see Fig. 22). 75% of new capacity is installed in<br />
these nations. As far as the other countries are concerned, the main trends were<br />
13<br />
14<br />
15<br />
Turkey Special, pages 42 – 50, Sun & Wind Energy 2/2005<br />
ESTIF: European Solar Thermal Industry Federation, www.estif.org; Trends and Market Statistics 2004,<br />
June 2005<br />
EU 25 incl. Switzerland and Norway, excl. Luxembourg<br />
Dezember 2005 38
Solar Energy 2005<br />
higher than average growth rates in Italy, Spain and France, as well in the UK,<br />
Belgium and Ireland – although the last three started from a very low base. The<br />
10 new EU member states had a combined total of 6% of the solar collectors in<br />
service. These markets are not listed separately yet, because the data sources<br />
still need to be harmonised.<br />
Fig. 22: Solar heating market in Europe 2004: Overview listed by market share, with capacity now in MW th<br />
Europe Market growth 2003-2004 2005 market 2006 market<br />
2004 in service market Installed Installed Market forecast forecast<br />
Country (MW th ) share (%) 2003 2004 growth Total Total<br />
Germany 3'923 40% 504 525 4.2% 637 700<br />
Greece 1'979 20% 113 151 34% 119 126<br />
Austria 1'460 15% 116 128 11% 140 151<br />
Italy 311 3% 35 43 22% 52 56<br />
Spain 294 3% 49 65 33% 98 140<br />
Switzerland 247 3% 19 22 16% 27 28<br />
Denmark 221 2% 13 14 5% 17 18<br />
Netherlands 198 2% 19 20 1% 21 23<br />
France (EU) 192 2% 27 39 41% 67 84<br />
Sweden 130 1% 13 14 11% 18 20<br />
UK 118 1% 15 20 32% 25 28<br />
Portugal 101 1% 4 6 50% 8 9<br />
Belgium 34 0.3% 8 10 34% 13 15<br />
Norway 13 0.1% 2.1 2.1 0% 3 3<br />
Finland 8 0.1% 1.4 1.4 0% 1 1<br />
Ireland 5 0.1% 0.4 1.4 233% 2 2<br />
New EU-10 542 6% 52 60 15% 64 83<br />
Total 9'776 100% 991 1'121 13% 1'311 1'488<br />
Underlying data: ESTIF, June 2005; W.B. Koldehoff, October 2005 and own estimates<br />
Germany<br />
German market grew<br />
4% in 2004<br />
Market incentives provide<br />
valuable support<br />
21% growth predicted<br />
for 2005<br />
After a poor year in 2002, sales of solar collectors rose an impressive 33% in<br />
2003. But they are expected to have fallen back sharply in 2004, although<br />
growth of 4% is still likely. Germany is Europe’s biggest market (40%), with approximately<br />
4,000 MW th cumulative capacity currently in service.<br />
Solar heating systems receive substantial support in Germany through the market<br />
incentive programme (MIP). As of 1 July 2005, the MIP 16 grants differentiated<br />
subsidies for solar collector systems. The level of subsidy for systems used to<br />
heat greywater is EUR 105 /m 2 of gross collector area, and for combi systems<br />
(hot water and support for space heating) as high as EUR 135/m 2 . To qualify for<br />
a state subsidy, the collectors must now produce a minimum yield of 525<br />
kWh/m 2 (750 kWh/kW) and also meet the criteria of the ecolabel Blue Angel<br />
(RAL UZ 73), status 2004 17 . A current overview of the subsidy programmes provided<br />
by the government and individual federal states is available from BSi. 18<br />
In the first eight months of 2005 there was a 75% increase in the number of MIP<br />
applications compared with last year. The inflow of new applications continues to<br />
be high thanks to the sunny autumn and persistently high prices for fossil fuels.<br />
16<br />
17<br />
18<br />
Marktanreizprogramm für erneuerbare Energien des Bundesamtes für Wirtschaft und Ausfuhrkontrolle<br />
(BaFa), www.bafa.de<br />
www.blauer-engel.de<br />
www.bsi-solar.de/foerderprogramme.asp<br />
Dezember 2005 39
Solar Energy 2005<br />
The market received an additional boost from the change in the incentive rules<br />
as of 1 July, which gave lower subsidies for small systems but higher subsidies<br />
for space heating systems. We predict full-year growth of 21% in newly installed<br />
systems. Our forecasts of newly installed capacity for the German market are<br />
637 MW th for 2005 and 700 MW th for 2006. The government target of 7 GW th<br />
cumulative solar collector capacity by 2006 will probably not be achieved. We<br />
predict around 5.26 GW th .<br />
In recent years there have been big fluctuations in the entire solar collector market<br />
in Germany. The market shares of individual players have oscillated wildly as<br />
well. The position of the two leaders, Buderus and Viessmann, has been fairly<br />
constant and uncontested. Wagner came third in 2003. Winners in recent years<br />
include Sonnenkraft, Wolf and Schüco (see Fig. 23).<br />
Cost reductions have also been made in recent years following more industrialised<br />
manufacturing and economies of scale in marketing and distribution. Increasing<br />
concentration is also apparent in production, while at the same time distribution<br />
is now extending more over to providers of traditional heating boilers.<br />
Fig. 23: Market shares of manufacturers and providers of flat-plate collectors<br />
in Germany in 2004 (total 480 m 2 MW th , or 91% of total market).<br />
Other Importers<br />
pro solar<br />
Westfa (G-o-T)<br />
VELUX (Foco)<br />
Viessmann<br />
Importers:<br />
34%<br />
Brötje (G-o-T)<br />
Manufacturers<br />
66%<br />
SUNSET (Chromagen)<br />
Buderus<br />
Sonnenkraft (G-o-T)<br />
Selbstbauer (inkl. BUSO)<br />
Schüco<br />
Sunset<br />
(Chromagen)<br />
Solvis<br />
Wagner<br />
KBB<br />
Wolf<br />
NA U<br />
Vaillant<br />
Citrin<br />
Other Manufacturers<br />
Underlying data: W.B. Koldehoff, October 2005. OEMs in brackets (G-o-T: GreenOneTec)<br />
Difficult situation<br />
in solar heating<br />
In Germany the attractive payments for solar energy fed into the mains grid<br />
seem to have made solar heating slightly less popular with owner occupiers. But<br />
high oil and gas prices are helping to reverse this trend. According to a survey of<br />
1,700 plumbing and heating installation firms conducted by Europressedienst 19 ,<br />
most customers cite cost savings as the main motive for purchasing a solar heating<br />
system. The Regenerative Heat Act (Regeneratives-Wärme-Gesetz,<br />
RegWG), which the industry hopes will be introduced soon, would provide additional<br />
support. By imposing a carbon tax on the use of conventional forms of energy<br />
such as oil and gas, this law aims to provide a financial incentive for producing<br />
heat from renewable sources. But the government is also considering an<br />
19<br />
Perspektiven der Solarthermie in Deutschland 2005/06, Europressedienst EuPD, Bonn, July 2005<br />
Dezember 2005 40
Solar Energy 2005<br />
ordinance that makes the use of solar-powered heating systems compulsory<br />
when building new single- or multi-occupancy dwellings, or imposes an obligation<br />
to use such systems. But it will be at least a couple of years before such<br />
regulations provide new stimulus to Germany’s solar heating market. As far as<br />
climate protection is concerned, solar heating definitely deserves more support,<br />
since specialist publications show that when in service a solar collector saves<br />
well over twice as much CO 2 (relative to area) than a comparable PV system.<br />
Greece<br />
Saturation point reached?<br />
Last year many existing solar heating systems were replaced, resulting in 151<br />
MW th of newly installed capacity. This is equivalent to 34% growth on last year.<br />
Greece therefore took Austria’s place as number two in new installations. The<br />
cumulative capacity of 180 kW th per 1,000 inhabitants is already the second<br />
highest after Israel, so a certain amount of saturation is likely. Additional stimulus<br />
could come from the wider promotion of systems for solar-assisted cooling. Our<br />
forecasts of newly installed capacity for the Greek market are 119 MW th for 2005<br />
and 126 MW th for 2006.<br />
Austria<br />
Austria becomes the biggest<br />
exporter of solar collectors<br />
Market forecast for Austria<br />
up to 2010<br />
The positive market growth that Austria has enjoyed since 2000 continued in<br />
2004. Last year glazed collectors with a capacity of approximately 350 MW th<br />
were produced in Austria (2003 production: 285 MW th ). In 2004 around 65% or<br />
collectors produced were exported, compared to 59% in 2003 20 . Austria’s<br />
GreenOneTec is Europe’s biggest producer of flat-plate collectors. The company<br />
operates around two-thirds of Austria’s entire production capacity. The domestic<br />
market volume for glazed collectors was 128 MW th (117 MW th in 2003), which is<br />
9.4% higher than last year. Cumulative capacity of 1,460 MW th was in service at<br />
y/e 2004. Subsidies vary from one federal state to another. They average around<br />
EUR 4,900 for a solar system providing heating support (20 m 2 collector area,<br />
1,500 l storage tank).<br />
Austria’s solar heating market posted average annual growth of 15% during the<br />
period 1990-2000. If additional market impulses managed to fuel this growth up<br />
to 2010, Austria would have almost 2,800 MW th collector capacity installed in this<br />
Kyoto target year. Total sales in the solar heating industry would rise to EUR 318<br />
m per year (2004: EUR 178 m). The CO 2 reduction achievable every year would<br />
therefore be almost one million tonnes. Our forecasts of newly installed capacity<br />
for the Austrian market are 140 MW th for 2005 and 151 MW th for 2006.<br />
Switzerland<br />
Solar heating market: Trend<br />
reversal confirmed<br />
Last year a total of 21.8 MW th new capacity was installed in Switzerland. 21 This is<br />
equivalent to 16% growth on last year. The installation rate has therefore increased<br />
for the second consecutive year. The lion’s share (96%) was flat-plate<br />
collectors. Previous sales figures were only higher in 1998 (22.2 MW th ). High energy<br />
prices, coupled with the campaign to promote solar energy launched two<br />
years ago, seem to be making an impact and confirm the trend reversal<br />
20<br />
21<br />
Solarmarkt in Österreich 2004, Austria Solar, www.austriasolar.at<br />
Solar - Schweiz. Fachverband für Sonnenenergie, market survey 2004; www.solarpro.ch<br />
Dezember 2005 41
Solar Energy 2005<br />
observed last year. Our forecasts of newly installed capacity for the Swiss market<br />
are 27 MW th for 2005 and 28 MW th for 2006.<br />
Other markets<br />
Two rising stars:<br />
France…<br />
… and Spain<br />
The French collector market has seen very dynamic expansion over the last four<br />
years, with growth rates of more than 40%. The state subsidisation programme<br />
“Plan Soleil” has provided an important stimulus and ensured that around<br />
36 MW th new capacity was installed in 2004. Since January 2005 up to 40% of<br />
the purchase cost of solar heating systems can be offset against income tax.<br />
This figure will even increase to 50% as of 2006. The potential is still massive,<br />
because the per capita collector area in France is still very low. Our forecasts of<br />
newly installed capacity for the French market are 67 MW th for 2005 and<br />
84 MW th for 2006.<br />
Spain is another market where expectations have been high for some time. Now<br />
it finally seems to meeting these expectations, notching up growth of 33% to 65<br />
MW th last year. We still have high hopes, as almost 30 cities and local authorities<br />
have since passed building ordinances that make it compulsory to install solar<br />
heating systems when building or renovating properties (“Barcelona model”).<br />
This commitment to solar power is due to be extended across the entire country.<br />
Our forecasts of newly installed capacity for the Spanish market are 98 MW th for<br />
2005 and 140 MW th for 2006.<br />
Global market trends up to 2020<br />
China growing steadily<br />
New markets will emerge<br />
For several years now China has shown itself to be a dynamic and self-sufficient<br />
market with annual growth rates of over 20%. Demand for solar collectors will<br />
continue to rise in future because the Chinese economy is booming. Taking into<br />
consideration the government’s renewable energy projects mentioned earlier<br />
and soaring fossil fuel prices, we think this current trend is set to continue.<br />
We can expect to see new markets emerge in countries that enjoy a lot of sunshine.<br />
These include southern European countries, the USA and Australia, as<br />
well as newly industrialised countries such as India, Indonesia, Mexico and Brazil.<br />
EU well short of its targets<br />
Growth in Europe of<br />
at least 13% up to 2010<br />
Heating and cooling with<br />
renewable energies<br />
In its White Book, the European Commission has set a 2010 target of 70 GW th<br />
for solar collectors in service. Despite the respectable growth rate of 13% in the<br />
period 2003-2004, however, only 9.8 GW th capacity was in service at the end of<br />
last year. Given the current growth rates, we estimate that the EU target will not<br />
be reached until 2020 at the earliest.<br />
After collapsing in 2002 (-22%), the European market has quickly recovered and<br />
reverted to 13% growth in 2003/04. Taking a conservative view, the market<br />
should also be able to maintain this rate of growth up to 2010. If, however, new<br />
legislative or political measures provide additional support in different countries,<br />
and gas & oil remain expensive, growth rates could well be much higher.<br />
Heating energy accounts for roughly 50% of total EU energy consumption by<br />
end users. This magnitude is unfortunately totally out of proportion to the public<br />
and political attention devoted to heating energy. To provide stronger support to<br />
solar heating in the important energy segment of “heating and cooling”, there<br />
Dezember 2005 42
Solar Energy 2005<br />
need to be more effective public subsidisation programmes or legal measures,<br />
such as the previously mentioned “Barcelona model” in Spain or the planned<br />
“Regenerative Heat Act” in Germany. The European industry association ESTIF,<br />
together with the European Renewable Energy Council (EREC) 22 and other organisations,<br />
has published a declaration calling for an EU directive to ensure that<br />
renewable energies (solar thermal power, biomass and geothermal energy) will<br />
cover roughly 20% of heating and cooling energy by 2020.<br />
Fig. 24: <strong>Sarasin</strong> forecast for the global solar collector market. Newly<br />
installed collector capacity in GW th per year<br />
New ly installed capacity p.a. (left scale)<br />
Annual grow th rate (right scale)<br />
400<br />
40%<br />
350<br />
35%<br />
Newly installed capacity [GWth/a]<br />
300<br />
250<br />
200<br />
150<br />
100<br />
50<br />
30%<br />
25%<br />
20%<br />
15%<br />
10%<br />
5%<br />
0<br />
2000<br />
2001<br />
2002<br />
2003<br />
2004<br />
2005<br />
2006<br />
2007<br />
2008<br />
2009<br />
2010<br />
2011<br />
2012<br />
2013<br />
2014<br />
2015<br />
2016<br />
2017<br />
2018<br />
2019<br />
2020<br />
Annual growth rate<br />
0%<br />
Source: <strong>Sarasin</strong>, 2005<br />
Global growth of<br />
25-30% up to 2010<br />
In 2004 the world’s newly installed collector capacity was 11.7 GW th , roughly<br />
30% higher than in 2003. For the current year 2005 we predict that newly installed<br />
collector capacity worldwide will reach around 15.5 GW th , which is 32%<br />
more than last year. This growth will come mainly from the boom in China, but<br />
also from other non-European countries. The global growth rate is likely to remain<br />
between 25% and 30% up to 2010. In 2010 we therefore predict a market<br />
volume (newly installed collector capacity) of 55 GW th , with roughly 250 GW th on<br />
stream worldwide. As the market starts to become saturated, we expect average<br />
growth will then ease back in the following decade (2011- 2020) to around 20%<br />
p.a. The global market for newly installed solar collectors would therefore reach<br />
a volume of approximately 390 GW th in 2020 (see Fig. 24).<br />
Solar-assisted cooling<br />
Conventional AC systems<br />
can cause power cuts<br />
Solar-assisted cooling (SAC) is becoming increasingly important worldwide, not<br />
least because of global warming. Demand for air conditioning is also booming as<br />
standards of personal comfort rise. In cities such as Houston, Sydney, Madrid<br />
and Rome, for example, almost all the buildings are now fully air-conditioned.<br />
Even in Germany around half the large office buildings already have air conditioning,<br />
with a steep upward trend. In some countries this surge in demand is increasingly<br />
causing network overload and failure of the mains grid on hot summer<br />
days. Solar-assisted cooling therefore has enormous potential for saving electricity<br />
worldwide. Air conditioning is also a huge market in commercial terms. The<br />
22<br />
Joint Declaration for a European Directive to promote renewable heating and cooling; European Renewable<br />
Energy Council (EREC), Brussels, April 2005; www.erec-renewables.org<br />
Dezember 2005 43
Solar Energy 2005<br />
industry’s turnover was around USD 50 billion in 2003, with 10% of sales generated<br />
in Europe. Conventional air conditioning units that use compressors consume<br />
a lot of electricity, most of it during peak load times. 23<br />
Market of the future:<br />
solar cooling<br />
Something that is common in other areas – using thermal energy to generate<br />
cold – is a very promising option for solar thermal power as well: Traditional air<br />
conditioners and refrigerators use electrical compressors whose energy consumption<br />
rises disproportionately when the ambient air temperature is higher.<br />
The novel idea behind SAC is to use what actually causes the high temperatures<br />
– namely the sun itself – to power the cooling units. Demand for cool air rises<br />
and falls almost in synchronisation with the supply of solar energy. Compared<br />
with traditional AC units, efficient solar-powered systems can reduce the electricity<br />
costs for a building’s air conditioning by at least 40-70%. Furthermore, the solar<br />
power can be used all year round for heating water, and on cold days as a<br />
support for the main heating system.<br />
At the moment Europe has around 40 systems (25 of them in Germany) in service<br />
for solar-powered air conditioning of buildings, with a combined collector<br />
area of approx. 17,000 m 2 and a total capacity of 4.4 MW th . SAC is a very promising<br />
solar application in buildings and is attracting increasing interest from private<br />
customers, hotel owners and industry. Now the market needs more companies<br />
that can offer integrated solutions for heating and cooling residential or<br />
commercial premises.<br />
23<br />
Klimatisieren mit Sonne und Wärme; Dr. Hans-Martin Henning. BINE, themen-infos 1/04; www.bine.info<br />
Dezember 2005 44
Solar Energy 2005<br />
Solar thermal power stations<br />
Fields of application<br />
Concentrating<br />
Solar Power (CSP)<br />
Solar power stations<br />
combined with conventional<br />
plants or with a storage system<br />
Decentralised generation of<br />
electricity and heat<br />
A solar thermal power station usually generates electricity with the use of steam<br />
turbines. The steam is produced with the help of solar energy. The “conventional”<br />
part of the power station (steam circulation, steam turbine and generator)<br />
is not very different from traditional power stations that work with coal, oil or gas.<br />
The basic principle of solar steam generation involves concentrating the solar<br />
power with a system of mirrors. This is referred to as Concentrating Solar Power<br />
(CSP).<br />
Solar thermal power stations are usually designed to generate electricity and are<br />
therefore mostly large installations with an output of 30 - 200 MW, working at<br />
high temperatures (400-800°C). At the moment these systems are the only solar<br />
technology capable of replacing comparably sized traditional power stations<br />
powered by fossil or nuclear fuels. Apart from ‘pure’ solar systems, hybrid systems<br />
are also planned that are integrated in conventional power stations (e.g.<br />
gas and steam) and are responsible for generating some of the steam during<br />
daylight hours, thereby saving on fossil fuels. Besides this, more and more systems<br />
are being fitted with a heat storage system (e.g. phase-changing media<br />
such as molten salts), in order to tailor electricity production more effectively to<br />
demand. This allows expensive peak load power to be generated as well. These<br />
systems can achieve peak efficiency rates of over 20% when converting solar<br />
irradiation into net current fed into the mains grid – not just at selected times, but<br />
throughout the day.<br />
Apart from centralised generation of electricity, smaller decentralised power<br />
plants based on parabolic trough technology can be used to generate electricity<br />
or industrial process heat (for example, to replace diesel generators). Please refer<br />
to our 2003 report for a detailed description of the technology. In what follows<br />
we limit our comments to a progress report on the various projects.<br />
Existing plants and planned projects<br />
First commercial CSP<br />
systems installed in the 80s in<br />
California and Spain<br />
New power station projects<br />
progressing slowly<br />
Since the early eighties, a number of pilot and demonstration plants have been<br />
erected and operated, mainly in the USA and Spain. This was within the framework<br />
of the development programme of the US Department of Energy (SunLab<br />
research facility) and the joint German-Spanish test centre, Plataforma Solar de<br />
Almeria. Nine SEGS power plants, financed purely with private money and built<br />
around parabolic trough technology, were constructed between 1984 and 1991<br />
in the Mojave desert in California with an investment volume of USD 1.2 billion<br />
and a total capacity of 350 MW el . They are still operated on a purely commercial<br />
basis to this date.<br />
In the last two to three years plans have multiplied for new power generation projects<br />
in response to technological advances and also more attractive political and<br />
economic conditions, including climate protection agreements, soaring oil and<br />
gas prices, subsidy programmes for renewable energies and generous fixed-rate<br />
payments for solar energy supplied to the mains grid. However, such large-scale<br />
Dezember 2005 45
Solar Energy 2005<br />
projects involve protracted procedures to obtain planning permission and secure<br />
the necessary funding. One year on, there is therefore little news to report on the<br />
project implementation front.<br />
Solar Millennium<br />
floats on the stock exchange<br />
“Solar tower” being built<br />
in Spain<br />
Iberdrola planning new solar<br />
power stations<br />
Boost for solar termal power<br />
projects in the USA?<br />
On 27 July 2005 trading started in shares of the German project development<br />
company Solar Millennium AG. The company is confident that it will manage, in<br />
collaboration with various partners, to implement a series of projects in the<br />
months ahead, especially the parabolic trough projects Andasol 1-3 (Fig. 25, project<br />
no. 12) in southern Spain. In accordance with Spain’s programme of subsidies,<br />
the solar power station will receive EUR 0.18 on top of the normal electricity<br />
price as a payment for renewable energy fed into the mains grid.<br />
A 100 m “solar tower” is due to be built near the Spanish city of Seville. A subsidiary<br />
of the listed Spanish environmental technology group Abengoa, the company<br />
Solucar Energia, wants to build this plant with a capacity of 11 MW under<br />
the project name “PS10” (Fig. 25, project no. 13). This project thus involves the<br />
commercialisation of a technology in the field of solar energy that has for the<br />
most part been shunned in the USA. The tower has 75,000 m 2 of mirrors attached<br />
to it via computer-controlled mounts which concentrate the sunlight at the<br />
top of the tower and generate steam to power a turbine that provides the electricity.<br />
The listed company Telvent GIT, headquartered in Madrid, supplies the control<br />
system for the moving mirrors, or heliostats.<br />
The Spanish energy group Iberdrola plans to build nine solar thermal power stations<br />
in the south and south east of Spain (project no. 16). The parabolic trough<br />
power stations should each have a capacity of 50 MW. Iberdrola is already<br />
Europe’s biggest producer of wind power, with a total capacity of 3,000 MW. But<br />
the Spanish also have conventional power stations fuelled by gas, coal and nuclear<br />
energy. Iberdrola’s announcement was made against a backdrop of new<br />
government targets for expanding renewable energy in Spain which were<br />
passed at the end of August. These set a target of 500 MW for national solar<br />
power station capacity by 2010.<br />
The new Energy Bill has at least improved conditions for large-scale solar thermal<br />
power projects in the USA. One of the world’s biggest solar thermal power<br />
stations is due to be constructed in California (project no. 19). Stirling Energy<br />
Systems from Arizona wants to erect and operate a solar thermal power station<br />
near San Diego that will initially provide the local utility company, San Diego Gas<br />
& Electric (SDG&E) with 300 MW of electricity. The plan is to increase this capacity<br />
to 900 MW by 2015. SDG&E is committed to increasing its quota of green<br />
electricity to 20% by 2010. The “Renewable Portfolio Standard” obliges US electricity<br />
providers to generate and sell a specific (and increasing) proportion of their<br />
electricity from renewable energy sources.<br />
Dezember 2005 46
Solar Energy 2005<br />
Fig. 25: Overview of current projects in the field of solar thermal power plants<br />
Location<br />
Financing<br />
Solar<br />
technology<br />
Engineering, supplier<br />
Hybrid<br />
operation<br />
Solar<br />
capacity<br />
(MWel)<br />
Total<br />
capacity<br />
(MWel)<br />
Project<br />
status a)<br />
due to<br />
come on<br />
stream<br />
1 Algeria<br />
Algerian Renewable<br />
Energy Act / loan<br />
following RfP<br />
parabolic trough Bid Selection<br />
Gas & steam<br />
plant<br />
25 150 2 2007<br />
2 Australia<br />
Partly from Australian<br />
Greenhouse Gas subsidy<br />
Updraught SBP/EnviroMission No 200 200 2 n/a<br />
3 Egypt GEF/World <strong>Bank</strong> parabolic trough<br />
Selection after prequalification,<br />
RfP & bid<br />
selection<br />
Gas & steam<br />
plant<br />
30 135 2 2007<br />
4 India MNES, GEF, KfW parabolic trough<br />
Fichtner Solar (Consultant to<br />
Indian EVU and KfW)<br />
Gas & steam<br />
plant<br />
35 120-160 2 2007<br />
5 Iran<br />
Depending on project<br />
structure, to be decided /<br />
IPDO<br />
parabolic trough<br />
Fichtner Solar and Flabeg<br />
Solar (Consultants to IPDO)<br />
Gas & steam<br />
plant<br />
70 300-400 3 n/a<br />
6 Israel<br />
Israeli technology<br />
programme + banks<br />
parabolic trough<br />
Solel as promoter / selection<br />
process not yet agreed<br />
Yes, but high<br />
solar quota<br />
100 100 3 n/a<br />
7 Italy<br />
Italian research<br />
programme<br />
Parabolic trough<br />
(with molten<br />
salts)<br />
ENEA (state research centre),<br />
industry and Enel<br />
Gas & steam<br />
plant<br />
40 500 2 2006<br />
8 Jordan<br />
Depending on project<br />
structure, to be decided<br />
parabolic trough<br />
Feasibility study by Solar<br />
Millennium; RfP & Bid<br />
Selection<br />
Steam or gas<br />
& steam plant<br />
30-130 130 3 n/a<br />
9 Crete<br />
Greek Ren.Energy Act &<br />
renewable energy finance<br />
programmes<br />
parabolic trough<br />
THESEUS A.E. (Solar<br />
No. 50 50 2-3 2007<br />
Millennium, OADYK, Fichtner)<br />
10 Morocco GEF/WB/O.N.E. parabolic trough<br />
F/S by Pilkington Soar &<br />
INITEC; RfP & Bid Selection<br />
Gas & steam<br />
plant<br />
30 220 2 2007<br />
11 Mexico GEF/WB/CFE parabolic trough<br />
F/S by Spencer Management;<br />
Bid under way since 2002<br />
Gas & steam<br />
plant<br />
30 300 2 2007+<br />
12 Spain,<br />
AndaSol 1-3<br />
Spanish Ren. Energy Act<br />
+ project financing<br />
parabolic trough<br />
Solar Millennium + ACS<br />
Cobra<br />
Yes, with<br />
approx. 90%<br />
solar quota<br />
3 x 50 3 x 50 1<br />
1 st plant:<br />
2006<br />
13 Spain,<br />
PS10<br />
Spanish Ren. Energy Act<br />
+ project financing<br />
Tower<br />
Inabensa/Solucar/Abengoa<br />
Yes, with<br />
approx. 90%<br />
solar quota<br />
11 11 1 2005/6<br />
14 Spain,<br />
Solar Tres<br />
Spanish Ren. Energy Act<br />
+ project financing<br />
Tower<br />
SENER / Solar Tres<br />
Yes, with<br />
approx. 90%<br />
solar quota<br />
15 15 3 n/a<br />
15 Spain,<br />
Euro SEGS<br />
Spanish Ren. Energy Act<br />
+ project financing<br />
parabolic trough EHN / Solargenix<br />
Yes, with<br />
approx. 90%<br />
solar quota<br />
15 15 3 n/a<br />
16 Spain<br />
Spanish Ren. Energy Act<br />
+ project financing<br />
parabolic trough Iberdrola<br />
Yes, with<br />
approx. 90%<br />
solar quota<br />
9 x 50 9 x 50 3-4 n/a<br />
17 South Africa Unknown Tower ESKOM No 100 100 3 n/a<br />
18 USA,<br />
Nevada<br />
PPA with Nevada Power /<br />
project financing<br />
parabolic trough Solargenix/Schott Solar<br />
Yes, with<br />
addition of<br />
25% fossil fuel<br />
64 64 1 2007<br />
19 USA,<br />
San Diego<br />
PPA with San Diego Gas<br />
& Electric<br />
parabolic trough Stirling Energy Systems No. 300 300 2 2007<br />
a) Project status: 1 = under construction; 2 = projects in planning phase; 3 = projects in pre-planning (feasibility study under way); 4 = intended projects<br />
Source: SolarPaces, September 2005 and <strong>Sarasin</strong><br />
Dezember 2005 47
Second US project using<br />
German technology<br />
High development costs hold<br />
back the boom<br />
Another project with a parabolic trough is being constructed in Boulder City in the<br />
state of Nevada (project no. 18). Germany’s Schott Solar GmbH is supplying the<br />
solar receivers for the project. These are one of the key components for parabolic<br />
trough power stations. The 64 MW power station is due to come on stream<br />
in June 2007 and generate electricity for 40,000 homes. The project partner is<br />
the US company Solargenix. This will be the first commercially operated solar<br />
thermal power station to be built in the US for 15 years. The implementation of<br />
this project in Nevada will be an initial trigger for the further expansion of this<br />
technology.<br />
The high development costs for solar thermal power stations are the main obstacle<br />
to the technology experiencing a boom. Solar Millennium, for example, had to<br />
spend EUR 20 m on bringing the technology for the two Spanish power plants to<br />
market and developing the projects. The entire investment cost for realising the<br />
three solar thermal powers stations each with a capacity of 50 MW in Andalucia<br />
is in the region of EUR 500 m.<br />
Market outlook<br />
Commercialisation – 2006<br />
will be the “year of truth”<br />
Opportunities<br />
Fig. 25 provides an overview of the status of the global projects. 2006 may well<br />
turn out to be the “year of truth” for some projects and for the technology’s commercialisation.<br />
Overall we think the opportunities for this solar technology are<br />
very good. At the same time, however, there are substantial risks that could obstruct<br />
or delay the use of this technology.<br />
Solar thermal plant technologies offer enormous potential because they depend<br />
on intense sunlight and are primarily suited to countries in the sun belt, such as<br />
the southern states of the USA, Mexico, southern Europe, Africa, Middle and Far<br />
East, India and Australia. The following conclusions can be drawn from the technical<br />
progress achieved and the improved overall conditions:<br />
<br />
<br />
<br />
The cost efficiency of these technologies, i.e. comparable costs to conventional<br />
power station technology, looks as if it will become more acceptable in<br />
the near future.<br />
Unlike photovoltaics, this technology is suitable for large power stations that<br />
can be extensively used for central power supply and in the long term could<br />
even be a substitute for power stations using nuclear and fossil fuels.<br />
The subsidy programmes and incentives in Spain and the USA especially are<br />
a general expression of a stronger emphasis in national energy policies on<br />
promoting renewable technologies. In this context centralised solar thermal<br />
power is now being “rediscovered“.<br />
Threats<br />
There are also certain risks associated with the further development of solar<br />
thermal power plant technologies:<br />
<br />
<br />
Continuity of the finance terms and subsidy programmes<br />
Country risks (projects are often located in countries where the overall conditions<br />
are uncertain)
The future of solar thermal power plant technologies depends – far more than<br />
in the case of photovoltaics and solar collectors – on their ability to compete<br />
on the level of cost. It therefore depends on whether the cost savings projected<br />
for the new generation of power plants can effectively be realised.<br />
Industry association says<br />
the technology is ready<br />
Conclusion: Prospects are<br />
still intact<br />
According to a study by Greenpeace 24 and the European Association of the Solar<br />
Thermal Power Industry ESTIA, more electricity could be generated worldwide<br />
by solar thermal power stations in 2040 than is currently generated by nuclear<br />
and hydroelectric power stations. By 2040 five percent of electricity<br />
consumed worldwide could come from solar thermal power stations – despite the<br />
fact that electricity consumption is expected to double by then. The study gives<br />
practical advice on what needs to be done to ensure the technology becomes<br />
established. The Middle East and North Africa could assume a pioneering role.<br />
Up to 100 million people living in the sunniest areas on earth could make use of<br />
this clean energy source.<br />
As we explained in last year’s report, the future of solar thermal power plant<br />
technologies is heavily dependent on the success of projects currently in the<br />
planning stage. Progress has not been as swift as expected. At the moment the<br />
entire installed capacity is still “only” 354 MW, most of it originating from the<br />
boom years in the nineties. No new power station will be connected to the grid in<br />
the current year. But in 2006 around 150 MW may come on stream. If these installations<br />
fulfil expectations regarding reliability and cost efficiency, it could lead<br />
to further exploitation of the enormous market potential and a surge in growth. It<br />
is still very difficult to give a quantitative forecast. The global market initiative for<br />
solar thermal power stations (CSP GMI) 25 wants to create new solar thermal capacities<br />
of around 5,000 MW by 2015. Given the current project status, this goal<br />
seems ambitious, but not impossible. As Table 25 shows, about 3000 MW of capacity<br />
should be achieved as early as 2008 if all the projects are successfully<br />
completed. But at the moment most of the projects are still at the stage of a feasibility<br />
study, which means the percentage of failures before final completion is<br />
likely to be relatively high. Realistically we therefore think capacity will only reach<br />
around 1,500 MW by 2008.<br />
24<br />
25<br />
Concentrated Solar Thermal Power – Now! Greenpeace, ESTIA, Solarpaces, Brussels, September 2005<br />
GMI Broschüre, www.solarpaces.org
Contacts<br />
Andreas Knörzer Tel. +41 61 277 74 77<br />
Head of <strong>Sarasin</strong> Sustainable Investment<br />
andreas.knoerzer@sarasin.ch<br />
Gabriele Grewe Tel. +41 61 277 70 73<br />
Head. Bonds and Balanced Portfolios<br />
gabriele.grewe@sarasin.ch<br />
Catrina Vaterlaus-Rieder Tel. +41 61 277 78 05<br />
Deputy Head, Equity Portfolios<br />
catrina.vaterlaus@sarasin.ch<br />
Arthur Hoffmann Tel. +41 61 277 73 22<br />
Equity Portfolios<br />
arthur.hoffmann@sarasin.ch<br />
Johannes Weisser Tel. +41 61 277 72 67<br />
Bonds and Balanced Portfolios<br />
johannes.weisser@sarasin.ch<br />
Romeo Burri Tel. +41 61 277 73 60<br />
Support<br />
romeo.burri@sarasin.ch<br />
<strong>Sustainability</strong> Research<br />
Dr. Eckhard Plinke Tel. +41 61 277 75 74<br />
Head. Machinery, Electronics and<br />
eckhard.plinke@sarasin.ch<br />
Electrical Engineering<br />
Makiko Ashida Tel. +41 61 277 74 70<br />
Insurance, Consumer Goods<br />
makiko.ashida@sarasin.ch<br />
Dr. Michaela Collins Tel. +41 61 277 77 68<br />
Retail, Tourism, Contries<br />
michaela.collins@sarasin.ch<br />
Dr. Matthias Fawer Tel. +41 61 277 73 03<br />
Energy, Food, Water Utilities<br />
matthias.fawer@sarasin.ch<br />
Andreas Holzer Tel. +41 61 277 70 38<br />
Chemicals, Pharmaceuticals, Medical & Healthcare, andreas.holzer@sarasin.ch<br />
Paper, Mining<br />
Klaus Kämpf Tel. +41 61 277 77 80<br />
<strong>Bank</strong>s, Institutions, Business Services, Software, klaus.kaempf@sarasin.ch<br />
Recycling & Waste Management<br />
Dr. Gabriella Ries Tel. +41 61 277 71 66<br />
Media, Telekommunications, Building Materials, gabriella.ries@sarasin.ch<br />
Transport/Logistics<br />
Balazs Magyar Tel. +41 61 277 71<br />
Research Assistant<br />
Marketing/Support<br />
Erol Bilecen Tel. +41 61 277 75 62<br />
Marketing Support<br />
erol.bilecen@sarasin.ch<br />
Dr. Mirjam Würth Tel. +41 61 277 73 42<br />
Marketing Support<br />
mirjam.wuerth@sarasin.ch<br />
Gabriela Pace Tel. +41 61 277 73 31<br />
Administrative Support/Secretariat<br />
gabriela.pace@sarasin.ch<br />
Contact<br />
<strong>Bank</strong> <strong>Sarasin</strong> & Co. Ltd<br />
Gabriela Pace<br />
Elisabethenstrasse 62<br />
CH – 4002 Basel<br />
gabriela.pace@sarasin.ch
Publications<br />
Pharma<br />
Always read the label. An analysis of the social and environmental aspects of the<br />
pharmaceutical industry. Andreas Holzer, October 2005<br />
Covered Bonds<br />
The <strong>Sustainability</strong> of Covered Bonds. Klaus Kämpf, July 2005<br />
Country Sovereign Bonds<br />
Emerging Country Sovereign Bonds: A Sustainable Investment? Michaela Collins, June 2005<br />
Financial Institutions<br />
The <strong>Sustainability</strong> of Public Financial Institutions. Klaus Kämpf, March 2005<br />
Solar Energy 2004<br />
Solar energy – sunny days ahead? Current status and outlook for photovoltaics and solar thermal<br />
energy. Matthias Fawer, November 2004<br />
China<br />
“Made in China” - Is this a Sustainable Label? Makiko Ashida/Eckhard Plinke, September 2004<br />
Media<br />
Corporate Social Responsibility Issues of the Media Industry. Gabriella Ries, June 2004 (only<br />
available in German)<br />
Biotechnology<br />
Will Medicinal Biotechnology sustain its promise? Delivering on potential – to patients, investors<br />
and society. Andrew DeBoo, March 2004<br />
Government Bonds<br />
<strong>Sustainability</strong> of Sovereign Bonds? Approach and results of the <strong>Sarasin</strong> country evaluation.<br />
Michaela Collins/Astrid Frey, January 2004<br />
Photovoltaics 2003<br />
Solar energy – is the outlook cloudy or bright? Current status and future prospect for photovoltaics<br />
and solar thermal energy. Matthias Fawer/Eckhard Plinke, November 2003<br />
Social responsibility<br />
Measuring corporate social responsibility – <strong>Bank</strong> <strong>Sarasin</strong>’s social criteria for sustainable investments.<br />
Eckhard Plinke, September 2003<br />
Telecom<br />
On course for sustainability – How is the Telecommunications industry faring? Themes, Trends<br />
and Leaders. Gabriella Ries/Christoph Ladner, July 2003<br />
Water<br />
Solutions to the water crisis – Can an investor focused on sustainability make a contribution?<br />
Andreas Knörzer/Eckhard Plinke, März 2003 (only available in German)<br />
Performance<br />
Share Performance and <strong>Sustainability</strong> – Does environmental and social performance have any<br />
influence on share performance? Eckhard Plinke et al., September 2002<br />
Food<br />
Forestry<br />
How sustainable is the food industry? A study of environmental and social performance in the<br />
food and beverage industry. Matthias Fawer/Christoph Butz/ Catrina Vaterlaus-Rieder, August<br />
2001<br />
Are the founders of sustainability true to their roots? An overview of the forestry and paper industry.<br />
Christoph Butz/Catrina Vaterlaus-Rieder, July 2000
Important information<br />
This report, prepared by <strong>Bank</strong> <strong>Sarasin</strong> & Co. Ltd (“BSC”), bases on public available information and data (“the Information”). This publication was not produced by<br />
our financial research department. Therefore, the "Directives on the Independence of Financial Research" of the Swiss <strong>Bank</strong>ers Association were not applied. BSC<br />
neither has examined the Information to be accurate and complete, nor guarantees its accuracy and completeness. Possible errors or incompleteness of the<br />
Information do not constitute grounds for liability, neither with regard to direct nor to indirect or consequential damages. In particular, BSC is not liable for the<br />
statements, plans or other details contained in the Information concerning the examined companies, their associated companies, strategies, economic situations,<br />
market and competitive situations, regulatory environment, etc. Although due care has been taken in compiling this report, it cannot be excluded that it is<br />
incomplete or contains errors. BSC, their shareholders and employees are not liable for accuracy and completeness of the statements, estimations and the<br />
conclusions derived form the Information contained in this report. Provided this report is being transmitted in connection with an existing contractual relationship,<br />
i.e. financial advisory or similar services, the liability of BSC shall be restricted to gross negligence and willful misconduct. Only in case of failure in essential tasks,<br />
BSC is liable for normal negligence. In any case, the liability of BSC is limited to typical expectable damages and the liability for any indirect damages is excluded.<br />
This report does not constitute an offer or a solicitation of an offer for the purchase or sale of any security. BSC may perform investment banking services or other<br />
services for companies and partners, directors or employees of BSC may serve on the board of directors of companies mentioned in this report. Although<br />
measures are taken to avoid conflicts of interests raising form such services or relations to partners, directors or employees, BSC can not guaranty that such<br />
conflicts of interests will not occur. BSC shall, therefore, not be liable for any direct nor indirect or consequential damages out of such conflict of interests. Opinions<br />
or prices expressed in this report are subject to change without notice.<br />
This document must not be distributed to any person directly or indirectly in the US or to US persons or Canada or Japan. Persons domiciled in other countries<br />
should note the sales restrictions that apply to the products in question.<br />
© Copyright <strong>Bank</strong> <strong>Sarasin</strong> & Co. Ltd. All rights reserved