Sustainability Report - Bank Sarasin-Alpen
Sustainability Report - Bank Sarasin-Alpen
Sustainability Report - Bank Sarasin-Alpen

You also want an ePaper? Increase the reach of your titles
YUMPU automatically turns print PDFs into web optimized ePapers that Google loves.
Solar Energy 2005<br />
Solar collectors<br />
Overview<br />
High energy prices<br />
fuel demand<br />
Contribution from solar<br />
thermal power is<br />
underestimated<br />
As in 2003 and 2004, the second section of our report deals with the active application<br />
of solar thermal energy with the help of solar collectors, i.e. generating<br />
heat from the sun’s thermal radiation. Please refer to our 2003 report for a detailed<br />
description of the technologies used. In this year’s review we concentrate<br />
on a description of European companies, an overview of the market and an update<br />
to our forecasts.<br />
Higher oil and gas prices are actually fuelling demand for solar heating systems<br />
more strongly than for photovoltaics. On the other hand, many countries do not<br />
offer adequate political support for solar thermal power. With photovoltaics, feedin<br />
tariffs for renewable energy provide the necessary investment security, but<br />
there is no equivalent legislation in the solar thermal power segment.<br />
Compared with other forms of renewable energy, solar heating’s contribution towards<br />
meeting global energy demand is second only to wind power, and much<br />
bigger than photovoltaics’ contribution. This fact is often underestimated. The<br />
newly defined conversion factor of 0.7 kW th per m 2 of collector area makes it<br />
simple to compare the capacities of the different renewable energies currently in<br />
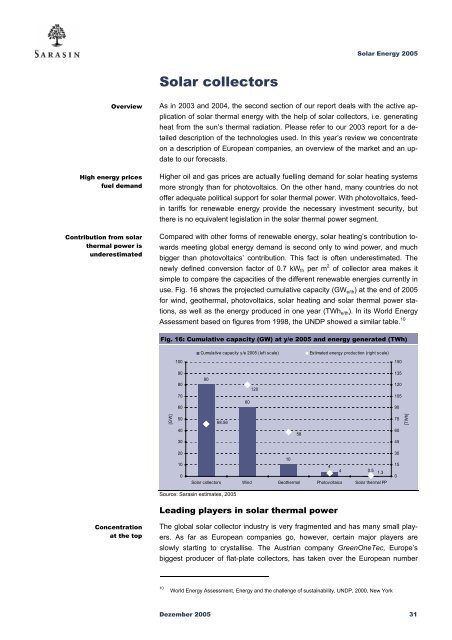
use. Fig. 16 shows the projected cumulative capacity (GW e/th ) at the end of 2005<br />
for wind, geothermal, photovoltaics, solar heating and solar thermal power stations,<br />
as well as the energy produced in one year (TWh e/th ). In its World Energy<br />
Assessment based on figures from 1998, the UNDP showed a similar table. 10<br />
Fig. 16: Cumulative capacity (GW) at y/e 2005 and energy generated (TWh)<br />
Cumulative capacity y/e 2005 (left scale)<br />
Estimated energy production (right scale)<br />
100<br />
150<br />
90<br />
80<br />
70<br />
60<br />
80<br />
60<br />
120<br />
135<br />
120<br />
105<br />
90<br />
[GW]<br />
50<br />
68.56<br />
75<br />
[TWh]<br />
40<br />
58<br />
60<br />
30<br />
45<br />
20<br />
10<br />
0<br />
10<br />
4<br />
4<br />
0.5 1.3<br />
Solar collectors Wind Geothermal Photovoltaics Solar thermal PP<br />
30<br />
15<br />
0<br />
Source: <strong>Sarasin</strong> estimates, 2005<br />
Leading players in solar thermal power<br />
Concentration<br />
at the top<br />
The global solar collector industry is very fragmented and has many small players.<br />
As far as European companies go, however, certain major players are<br />
slowly starting to crystallise. The Austrian company GreenOneTec, Europe’s<br />
biggest producer of flat-plate collectors, has taken over the European number<br />
10<br />
World Energy Assessment, Energy and the challenge of sustainability, UNDP, 2000, New York<br />
Dezember 2005 31