Sustainability Report - Bank Sarasin-Alpen
Sustainability Report - Bank Sarasin-Alpen
Sustainability Report - Bank Sarasin-Alpen
Create successful ePaper yourself
Turn your PDF publications into a flip-book with our unique Google optimized e-Paper software.
Solar Energy 2005<br />
heating systems powered by solar collectors is higher than for a conventional<br />
heating system. A sensible programme of subsidies, combined with rising or high<br />
fossil fuel prices, can open up enormous potential here. Unlike photovoltaics, solar<br />
heating directly replaces valuable gas, oil or electricity that is used for heating<br />
or cooling purposes. This would allow Europe to replace around 30% of its oil<br />
imports form the Middle East, for example.<br />
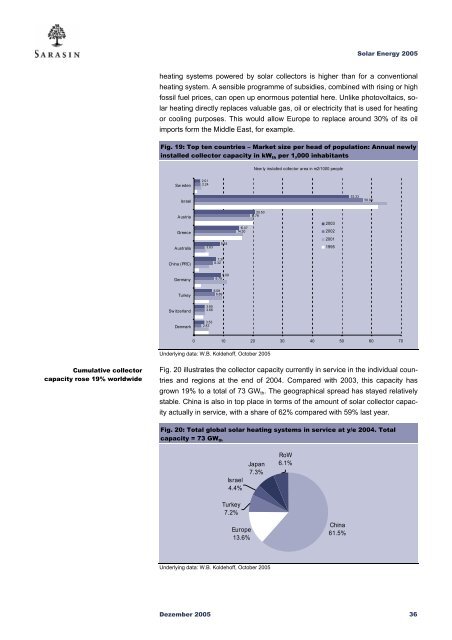
Fig. 19: Top ten countries – Market size per head of population: Annual newly<br />
installed collector capacity in kW th per 1,000 inhabitants<br />
New ly installed collector area in m2/1000 people<br />
Sw eden<br />
2.01<br />
2.24<br />
Israel<br />
52.33<br />
56.98<br />
Austria<br />
Greece<br />
Australia<br />
3.63<br />
8.54<br />
15 .0 7<br />
14 .3 0<br />
20.50<br />
18 .7 9<br />
2003<br />
2002<br />
2001<br />
1995<br />
China (PRC)<br />
7.37<br />
6.32<br />
Germany<br />
9.09<br />
6.79<br />
Turkey<br />
6.08<br />
6.89<br />
Sw itzerland<br />
3.65<br />
3.66<br />
Denmark<br />
3.53<br />
2.42<br />
0 10 20 30 40 50 60 70<br />
Underlying data: W.B. Koldehoff, October 2005<br />
Cumulative collector<br />
capacity rose 19% worldwide<br />
Fig. 20 illustrates the collector capacity currently in service in the individual countries<br />
and regions at the end of 2004. Compared with 2003, this capacity has<br />
grown 19% to a total of 73 GW th . The geographical spread has stayed relatively<br />
stable. China is also in top place in terms of the amount of solar collector capacity<br />
actually in service, with a share of 62% compared with 59% last year.<br />
Fig. 20: Total global solar heating systems in service at y/e 2004. Total<br />
capacity = 73 GW th<br />
Israel<br />
4.4%<br />
Turkey<br />
7.2%<br />
Japan<br />
7.3%<br />
RoW<br />
6.1%<br />
Europe<br />
13.6%<br />
China<br />
61.5%<br />
Underlying data: W.B. Koldehoff, October 2005<br />
Dezember 2005 36


