Sustainability Report - Bank Sarasin-Alpen
Sustainability Report - Bank Sarasin-Alpen
Sustainability Report - Bank Sarasin-Alpen

Create successful ePaper yourself
Turn your PDF publications into a flip-book with our unique Google optimized e-Paper software.
Solar Energy 2005<br />
therefore located in Asia and Europe, even though other regions would be more<br />
advantageous as they enjoy more sunshine.<br />
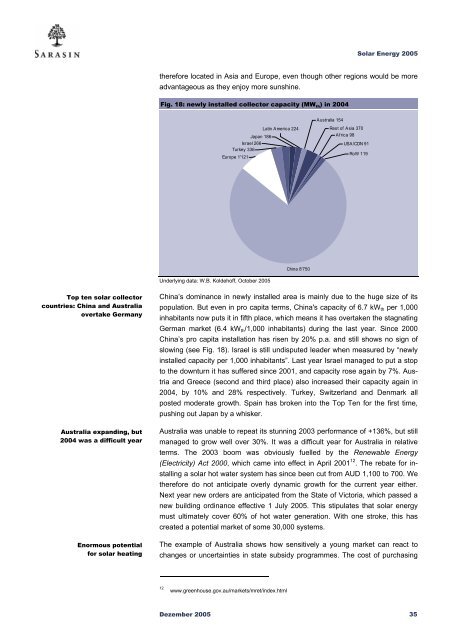
Fig. 18: newly installed collector capacity (MW th ) in 2004<br />
Australia 154<br />
Japan 186<br />
Israel 266<br />
Turkey 336<br />
Europe 1'121<br />
Latin America 224<br />
Rest of A sia 370<br />
Africa 98<br />
USA /CDN 91<br />
RoW 119<br />
China 8'750<br />
Underlying data: W.B. Koldehoff, October 2005<br />
Top ten solar collector<br />
countries: China and Australia<br />
overtake Germany<br />
Australia expanding, but<br />
2004 was a difficult year<br />
Enormous potential<br />
for solar heating<br />
China’s dominance in newly installed area is mainly due to the huge size of its<br />
population. But even in pro capita terms, China's capacity of 6.7 kW th per 1,000<br />
inhabitants now puts it in fifth place, which means it has overtaken the stagnating<br />
German market (6.4 kW th /1,000 inhabitants) during the last year. Since 2000<br />
China’s pro capita installation has risen by 20% p.a. and still shows no sign of<br />
slowing (see Fig. 18). Israel is still undisputed leader when measured by “newly<br />
installed capacity per 1,000 inhabitants”. Last year Israel managed to put a stop<br />
to the downturn it has suffered since 2001, and capacity rose again by 7%. Austria<br />
and Greece (second and third place) also increased their capacity again in<br />
2004, by 10% and 28% respectively. Turkey, Switzerland and Denmark all<br />
posted moderate growth. Spain has broken into the Top Ten for the first time,<br />
pushing out Japan by a whisker.<br />
Australia was unable to repeat its stunning 2003 performance of +136%, but still<br />
managed to grow well over 30%. It was a difficult year for Australia in relative<br />
terms. The 2003 boom was obviously fuelled by the Renewable Energy<br />
(Electricity) Act 2000, which came into effect in April 2001 12 . The rebate for installing<br />
a solar hot water system has since been cut from AUD 1,100 to 700. We<br />
therefore do not anticipate overly dynamic growth for the current year either.<br />
Next year new orders are anticipated from the State of Victoria, which passed a<br />
new building ordinance effective 1 July 2005. This stipulates that solar energy<br />
must ultimately cover 60% of hot water generation. With one stroke, this has<br />
created a potential market of some 30,000 systems.<br />
The example of Australia shows how sensitively a young market can react to<br />
changes or uncertainties in state subsidy programmes. The cost of purchasing<br />
12<br />
www.greenhouse.gov.au/markets/mret/index.html<br />
Dezember 2005 35