Download - Station Biologique de Roscoff - Portail des applications
Download - Station Biologique de Roscoff - Portail des applications
Download - Station Biologique de Roscoff - Portail des applications

Create successful ePaper yourself
Turn your PDF publications into a flip-book with our unique Google optimized e-Paper software.
Brief Communications<br />
Table 1.<br />
Sampling methods applied in the studies of population genetics of P. oceanica using distinct molecular markers<br />
Markers SD N md Md SA L(p)/P A References<br />
Allozymes H 4–51 — — 5000 8(2) 2 Capiomont et al. (1996)<br />
RAPD 1 Lr 16 10 40 — 65(1)/11 1 Procaccini et al. (1996)<br />
RAPD 2 H 9–15 5–10 — — 28(26)/2 2 Jover et al. (2003)<br />
M tc Lr 20–47 5–8 145–232 — 5 4 Procaccini et al. (2001)<br />
M d (popul. 1–4, 8) R 38–50 0.5–1.5 67–79 1600 8 12.5 Present study<br />
(popul. 5–7) Lr 29–40 5–8 145–232 —<br />
Details are given as to the markers used (M tc : tri- and heptanucleoti<strong>de</strong> microsatellites, M d : dinucleoti<strong>de</strong> microsatellites), the sampling <strong>de</strong>sign (SD; Lr: linear<br />
transect with equally spaced sampling points; R: random coordinates in 80 m 3 20 m; H: haphazard sampling), sample size (N), the approximate minimum<br />
and maximum distances (md, Md, respectively) in meters between sampled shoots, as well as the area sampled when nonlinear sampling was used (SA, in<br />
m 2 ), the number of loci (L), and when distinct, the number of polymorphic loci (p) analyzed, or the number of RAPD primers used (P), the average number<br />
of alleles per polymorphic loci (A), and the corresponding references.<br />
reliable accounts of the genetic diversity of these populations<br />
or reflect the limitations of these markers (Reusch 2001).<br />
Here we propose a combined approach using both the<br />
exploration of all marker combinations and the likelihood<br />
probability of i<strong>de</strong>ntical multilocus genotypes (MLGs) to be<br />
shared by distinct individuals to ascertain a priori the <strong>de</strong>pen<strong>de</strong>nce<br />
of the estimates of genetic diversity of clonal organisms on<br />
the number and efficiency of the markers used. This approach<br />
can also be used to optimize, in terms of cost-efficiency, the<br />
choice of markers to <strong>de</strong>rive unbiased estimates of genetic<br />
diversity of the clonal organism studied. We <strong>de</strong>monstrate this<br />
approach using microsatellite markers for two clonal sea grass<br />
species, P. oceanica and Cymodocea nodosa (Alberto et al. 2003a,b).<br />
Materials and Methods<br />
For P. oceanica, approximately 40 shoots were collected from<br />
each of eight localities (Table 2). A portion of each shoot was<br />
<strong>de</strong>siccated and preserved in silica crystals. For C. nodosa, 38<br />
shoots were collected in patches in Alfacs Bay (northern<br />
Spain). A sample of 45 seedlings collected in Cadiz Bay was<br />
used as a control for marker power, since no clonal replicates<br />
are expected in seedlings.<br />
Clonal diversity<br />
0.7<br />
0.6<br />
0.5<br />
0.4<br />
0.3<br />
0.2<br />
0.1<br />
0.0<br />
allozymes RAPD's trinucleoti<strong>de</strong>s dinucleoti<strong>de</strong>s<br />
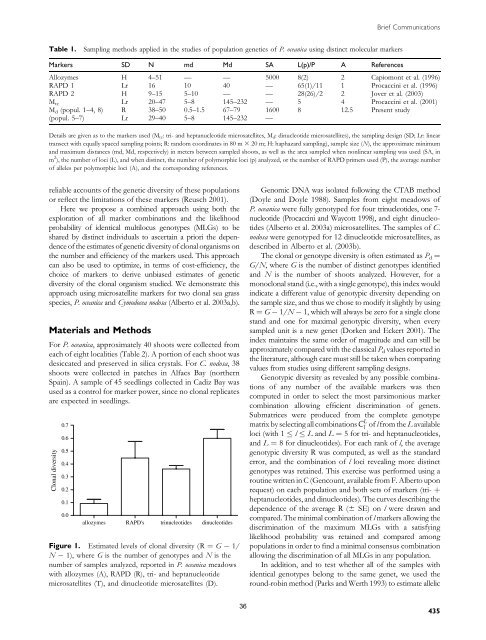
Figure 1. Estimated levels of clonal diversity (R ¼ G ÿ 1/<br />
N ÿ 1), where G is the number of genotypes and N is the<br />
number of samples analyzed, reported in P. oceanica meadows<br />
with allozymes (A), RAPD (R), tri- and heptanucleoti<strong>de</strong><br />
microsatellites (T), and dinucleoti<strong>de</strong> microsatellites (D).<br />
Genomic DNA was isolated following the CTAB method<br />
(Doyle and Doyle 1988). Samples from eight meadows of<br />
P. oceanica were fully genotyped for four trinucleoti<strong>de</strong>s, one 7-<br />
nucleoti<strong>de</strong> (Procaccini and Waycott 1998), and eight dinucleoti<strong>de</strong>s<br />
(Alberto et al. 2003a) microsatellites. The samples of C.<br />
nodosa were genotyped for 12 dinucleoti<strong>de</strong> microsatellites, as<br />
<strong>de</strong>scribed in Alberto et al. (2003b).<br />
The clonal or genotype diversity is often estimated as P d ¼<br />
G/N, whereG is the number of distinct genotypes i<strong>de</strong>ntified<br />
and N is the number of shoots analyzed. However, for a<br />
monoclonal stand (i.e., with a single genotype), this in<strong>de</strong>x would<br />
indicate a different value of genotypic diversity <strong>de</strong>pending on<br />
the sample size, and thus we chose to modify it slightly by using<br />
R ¼ G ÿ 1/N ÿ 1, which will always be zero for a single clone<br />
stand and one for maximal genotypic diversity, when every<br />
sampled unit is a new genet (Dorken and Eckert 2001). The<br />
in<strong>de</strong>x maintains the same or<strong>de</strong>r of magnitu<strong>de</strong> and can still be<br />
approximately compared with the classical P d values reported in<br />
the literature, although care must still be taken when comparing<br />
values from studies using different sampling <strong>de</strong>signs.<br />
Genotypic diversity as revealed by any possible combinations<br />
of any number of the available markers was then<br />
computed in or<strong>de</strong>r to select the most parsimonious marker<br />
combination allowing efficient discrimination of genets.<br />
Submatrices were produced from the complete genotype<br />
matrix by selecting all combinations C L l of l from the L available<br />
loci (with 1 l L and L ¼ 5 for tri- and heptanucleoti<strong>de</strong>s,<br />
and L ¼ 8 for dinucleoti<strong>de</strong>s). For each rank of l, the average<br />
genotypic diversity R was computed, as well as the standard<br />
error, and the combination of l loci revealing more distinct<br />
genotypes was retained. This exercise was performed using a<br />
routine written in C (Gencount, available from F. Alberto upon<br />
request) on each population and both sets of markers (tri- þ<br />
heptanucleoti<strong>de</strong>s, and dinucleoti<strong>de</strong>s). The curves <strong>de</strong>scribing the<br />
<strong>de</strong>pen<strong>de</strong>nce of the average R (6 SE) on l were drawn and<br />
compared. The minimal combination of l markers allowing the<br />
discrimination of the maximum MLGs with a satisfying<br />
likelihood probability was retained and compared among<br />
populations in or<strong>de</strong>r to find a minimal consensus combination<br />
allowing the discrimination of all MLGs in any population.<br />
In addition, and to test whether all of the samples with<br />
i<strong>de</strong>ntical genotypes belong to the same genet, we used the<br />
round-robin method (Parks and Werth 1993) to estimate allelic<br />
36<br />
435