Optical tweezers and dynamic light scattering Introduction ...
Optical tweezers and dynamic light scattering Introduction ...
Optical tweezers and dynamic light scattering Introduction ...
You also want an ePaper? Increase the reach of your titles
YUMPU automatically turns print PDFs into web optimized ePapers that Google loves.
ANNALS OF OPTICS - XXV ENFMC - 2002<br />
<strong>Optical</strong> <strong>tweezers</strong> <strong>and</strong> <strong>dynamic</strong> <strong>light</strong> <strong>scattering</strong><br />
Nathan B. Viana * , Rodrigo T. S. Freire <strong>and</strong> Oscar N. Mesquita<br />
*Departamento de Física, ICEX, Universidade Federal de Minas Gerais, Caixa Postal 702, Belo<br />
Horizonte, CEP 30123-970, MG, Brazil<br />
nathan@fisica.ufmg.br<br />
Abstract<br />
In this work we study the Brownian motion of an optically trapped bead using the <strong>light</strong> intensity<br />
correlation technique. By measuring backscattered profiles <strong>and</strong> temporal-intensityautocorrelation<br />
functions (ACFs) we determine the trap stiffness using two different methods. As<br />
an application we measure the Stokes friction coefficient of a trapped bead as a function of its<br />
distance from a surface.<br />
<strong>Introduction</strong><br />
Lasers can be used to trap small dielectric objects. This fact was first perceived by Ashkin <strong>and</strong> coworkers in their<br />
pioneer works about pressure radiation [1].<br />
They made a sample with polystyrene micro spheres in water <strong>and</strong> passed through it a laser in the TEM 00 mode.<br />
They were interested in the study of laser action over the micro spheres observing their motion. For a typical<br />
laser power 10 -3 W, a force in the pN range would act upon the micro sphere. They observed that when the laser<br />
beam reached the spheres the spheres started to move towards the beam center where the <strong>light</strong> intensity is<br />
maximum. When they focused the beam with a lens the micro spheres were trapped near its focus. This<br />
apparatus has been named an optical tweezer.<br />
In 1987 [2] an experiment with the Tobacco virus turned out to be one of the most important applications for the<br />
optical tweezer. They were in trouble with the <strong>light</strong> <strong>scattering</strong> experiments <strong>and</strong> suspected that sample bacterial<br />
contamination was the source of the problems. They mounted the optical tweezer in a microscope <strong>and</strong><br />
confirmed that contamination was present. In addition they observed that the bacteria were trapped <strong>and</strong> after few<br />
seconds in the trap they died. Changing the argon laser by an infrared one, they could trap, manipulate <strong>and</strong><br />
isolate the bacteria E. Coli [3] for hours.<br />
In this work we present a study of optical <strong>tweezers</strong> using as a sample polystyrene beads in water <strong>and</strong> as a tool the<br />
<strong>light</strong> intensity correlation technique. The trap stiffness was measured from <strong>light</strong> intensity fluctuations caused by<br />
the Brownian movement of the spheres. As an application we measure the parallel Stokes friction coefficient of a<br />
trapped bead as function of its distance from a surface.<br />
Experimental Setup<br />
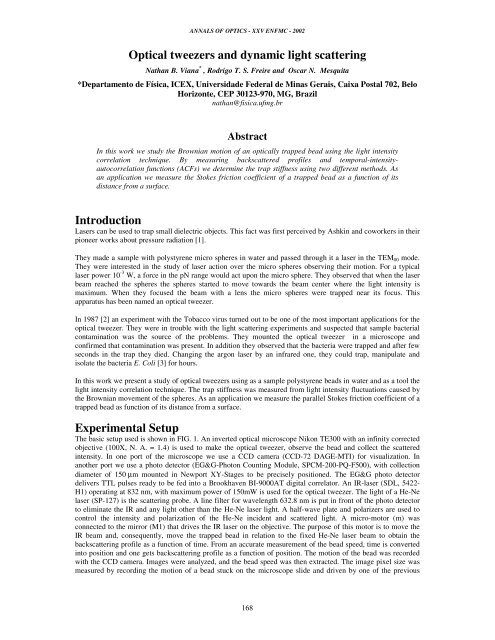
The basic setup used is shown in FIG. 1. An inverted optical microscope Nikon TE300 with an infinity corrected<br />
objective (100X, N. A. = 1.4) is used to make the optical tweezer, observe the bead <strong>and</strong> collect the scattered<br />
intensity. In one port of the microscope we use a CCD camera (CCD-72 DAGE-MTI) for visualization. In<br />
another port we use a photo detector (EG&G-Photon Counting Module, SPCM-200-PQ-F500), with collection<br />
diameter of 150 µm mounted in Newport XY-Stages to be precisely positioned. The EG&G photo detector<br />
delivers TTL pulses ready to be fed into a Brookhaven BI-9000AT digital correlator. An IR-laser (SDL, 5422-<br />
H1) operating at 832 nm, with maximum power of 150mW is used for the optical tweezer. The <strong>light</strong> of a He-Ne<br />
laser (SP-127) is the <strong>scattering</strong> probe. A line filter for wavelength 632.8 nm is put in front of the photo detector<br />
to eliminate the IR <strong>and</strong> any <strong>light</strong> other than the He-Ne laser <strong>light</strong>. A half-wave plate <strong>and</strong> polarizers are used to<br />
control the intensity <strong>and</strong> polarization of the He-Ne incident <strong>and</strong> scattered <strong>light</strong>. A micro-motor (m) was<br />
connected to the mirror (M1) that drives the IR laser on the objective. The purpose of this motor is to move the<br />
IR beam <strong>and</strong>, consequently, move the trapped bead in relation to the fixed He-Ne laser beam to obtain the<br />
back<strong>scattering</strong> profile as a function of time. From an accurate measurement of the bead speed, time is converted<br />
into position <strong>and</strong> one gets back<strong>scattering</strong> profile as a function of position. The motion of the bead was recorded<br />
with the CCD camera. Images were analyzed, <strong>and</strong> the bead speed was then extracted. The image pixel size was<br />
measured by recording the motion of a bead stuck on the microscope slide <strong>and</strong> driven by one of the previous<br />
168
ANNALS OF OPTICS - XXV ENFMC - 2002<br />
calibrated stages. Samples were made with polystyrene spheres of diameter 2.8 µm (Polysciences) in deionized<br />
water. The setup was mounted on a homemade isolating table.<br />
Figure 1: Experimental setup.<br />
Results <strong>and</strong> Discussions<br />
In FIG. 2 we show a typical intensity time auto-correlation function, ACF. In that figure we can see two decay<br />
times. The shortest one is related to the bead Brownian movement in the direction perpendicular to the objective<br />
axis <strong>and</strong> the largest is related to the axial Brownian movement. The decay time <strong>and</strong> the trap stiffness are related<br />
by τ = γ/ k where τ is the decay time, k is the trap stiffness <strong>and</strong> γ is the Stokes friction coefficient on the bead.<br />
169
ANNALS OF OPTICS - XXV ENFMC - 2002<br />
Figure 2: Typical ACF.<br />
Another way to obtain the trap stiffness is measuring the backscattered profile. With the intensity versus position<br />
profile we can relate intensity fluctuations to bead position fluctuations<br />
depend of the trap stiffness as<br />
x<br />
2<br />
kBT<br />
= , then we can obtain k.<br />
k<br />
2<br />
x<br />
. The bead position fluctuations<br />
For a bead of 1.4 µm radius positioned 10 µm above the microscope glass-slide <strong>and</strong> laser power in the bead of 6<br />
mW , the trap stiffness obtained from the decay time is<br />
5 .8 ± 5% mdyn/ cm <strong>and</strong> from amplitude<br />
fluctuations 5 .9 ± 5% mdyn/ cm , in good agreement.<br />
The method we are using has an important advantage over others. We can measure the trap stiffness <strong>and</strong> friction<br />
coefficient independently. From the bead position fluctuations we get the trap stiffness. From the stiffness<br />
obtained <strong>and</strong> the decay time measured we get the friction coefficient on the bead.<br />
So as an application of this technique we measure the parallel γ<br />
||<br />
Stokes friction coefficient as a function of the<br />
bead´s distance (h) from the glas-slide. The result is shown in the FIG. 3. The continuous curve is a fit of :<br />
γ<br />
γ<br />
||<br />
0<br />
<br />
= 1<br />
−<br />
<br />
9<br />
16<br />
R 1 R<br />
+ −<br />
h 8 h <br />
3<br />
45<br />
256<br />
4<br />
R<br />
<br />
h <br />
−<br />
1<br />
16<br />
R<br />
<br />
h<br />
<br />
<br />
5<br />
−1<br />
<br />
<br />
<br />
,<br />
where γ<br />
0<br />
is the friction far from the slide. There is a good agreement with theory [4] <strong>and</strong> our data.<br />
Conclusions<br />
Figure 3: Parallel Stokes friction coefficient.<br />
We used the intensity correlation technique to measure the trap stiffness of an optical trap. In addition we<br />
measure the Stokes coefficient friction as a function of the bead distance from a surface. Theory <strong>and</strong><br />
experiments are in good agreement indicating that the method developed here can be consistently used.<br />
Acknowledgements<br />
This work was supported by the Brazilian Agencies: Fundação de Amparo à Pesquisa do Estado de Minas<br />
Gerais – FAPEMIG, Conselho Nacional de Desenvolvimento Científico e Tecnológico – CNPq <strong>and</strong> FINEP-<br />
PRONEX.<br />
170
ANNALS OF OPTICS - XXV ENFMC - 2002<br />
References<br />
[1] A. Ashkin, Proc. Natl. Acad. Sci. USA, 94, 4853 (1997).<br />
[2] A. Ashkin, <strong>and</strong> J. M. Dziedzic, Science, 235, 1517 (1987).<br />
[3] L. Stryer, Biochemistry, (W. H. Freeman <strong>and</strong> Company, New York, 1995).<br />
[4] N. B. Viana, R. T. S. Freire, <strong>and</strong> O. N. Mesquita, to appear in PRE (2002).<br />
171


