HIGH-SENSITIVITY ABSORPTION MEASUREMENTS IN LIQUIDS ...
HIGH-SENSITIVITY ABSORPTION MEASUREMENTS IN LIQUIDS ...
HIGH-SENSITIVITY ABSORPTION MEASUREMENTS IN LIQUIDS ...

You also want an ePaper? Increase the reach of your titles
YUMPU automatically turns print PDFs into web optimized ePapers that Google loves.
XXIX ENFMC - Annals of Optics 2006<br />
<strong>HIGH</strong>-<strong>SENSITIVITY</strong> <strong>ABSORPTION</strong> <strong>MEASUREMENTS</strong> <strong>IN</strong><br />
<strong>LIQUIDS</strong> AND SOLIDS<br />
R. A. Cruz, C. Jacinto, and T. Catunda.<br />
Instituto de Física de São Carlos, Universidade de São Paulo, USP, C.P. 369, CEP 13560-<br />
970, São Carlos, São Paulo, Brasil.<br />
A. Marcano O.<br />
Centro de Física, Instituto Venezolano de Investigaciones Científicas, Apartado 21827,<br />
Caracas 1020 A, Venezuela.<br />
renato@if.sc.usp.br<br />
Abstract<br />
We report on a mode-mismatched pump-probe thermal lens experiment performed to measure<br />
low absorption. The use of a collimated probe beam in the presence of a focused excitation<br />
beam optimizes the thermal lens experiment. The signal becomes independent on the Rayleigh<br />
parameters and waists positions of the beams. We apply this method to study BK7 optical glass<br />
and pure water. Linear optical absorption coefficient spectra in the range of 457-528 nm were<br />
determined.<br />
Introduction<br />
Measurement of absorption coefficient with high sensitivity is important by several reasons, for instance, for<br />
the identification of constituents such as impurity of a given sample. At low absorption, the optical<br />
transmission decreases exponentially with the absorption path length following Beer’s law. Based on this law,<br />
optical techniques can measure changes in the transmission of about 10 -3 , where to increase the sensitivity in<br />
the absorption measurement multipass cells have been used. The transmission technique is not the only<br />
method for the absorption determination. The thermal lens (TL) spectrometry [1,4] has been developed as<br />
alternative way for the characterization of absorption in optical samples. In this work, we applied the modemismatched<br />
pump-probe TL method, which optimizes the TL experiment [12], for determination of linear<br />
optical absorption spectra in the range of 457-528 nm in water and BK7 glass.<br />
The TL spectrometry is characterized by the incidence of a Gaussian beam in a medium. The energy of the<br />
laser beam produces heating in the illuminated region, and as the intensity of the beam is bigger in its center,<br />
it generates a temperature radial distribution ∆T(r, t). The refractive index is given by n(r) = n o +(dn/dT)·∆T(r),<br />
whose profile follows the temperature one. Therefore, the Gaussian profile of the incident beam is transferred<br />
to the refractive index. So, depending on the dn/dT signal the material behaves like a convergent (dn/dT > 0)<br />
or divergent (dn/dT < 0) lens. The TL signal is defined as the normalized change of the transmission of the<br />
probe field through an aperture of radius, r o , much smaller than the radius of the probe beam, centered at the<br />
beam axis and located at a distance much larger than the pump Rayleigh parameter. Shen et al. have derived<br />
an expression for the TL signal using a diffraction approximation for Gaussian beams, which is given by: [8]<br />
I ( Z,<br />
t)<br />
= I<br />
0<br />
<br />
<br />
1<br />
−θ<br />
tan<br />
<br />
<br />
−1<br />
<br />
<br />
<br />
<br />
<br />
2m<br />
⋅V<br />
<br />
<br />
<br />
<br />
2 2 tc<br />
2<br />
[(1<br />
+ 2m)<br />
+ V ] + 1+<br />
2m<br />
+ V <br />
2t<br />
<br />
(1)<br />
where<br />
1
XXIX ENFMC - Annals of Optics 2006<br />
Pe<br />
⋅α<br />
⋅l<br />
θ = −<br />
Kλ<br />
p<br />
ds<br />
dT<br />
(2)<br />
t<br />
c<br />
2<br />
we<br />
= (3)<br />
4D<br />
in which, λ p is the wavelength of the probe beam, D and K are the thermal diffusivity and conductivity,<br />
respectively, L is the detector position, P e is the excitation beam power, α is the absorption coefficient, and l<br />
is the sample thickness. The ds/dT parameter can be considered constant for the changes in temperature<br />
typically observed in a TL experiment (< 0.01 K), and it is equal to dn/dT in liquid samples, m and V are<br />
geometrical parameters.<br />
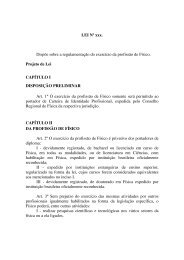
Experimental Setup<br />
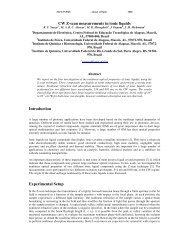
The experimental setup is shown in Fig. 1. A HeNe cw laser operating at 632.8 nm and P e = 1 mW generates<br />
the probe beam, which is collimated and directed to the sample before it is enlarged, and subsequently<br />
collected onto a silicon photodetector (Thorlabs, DET 310). At the detector plane, the probe beam has a<br />
diameter of 4 cm. In front of the detector, an aperture of radius 0.1 cm is placed centered on the axis of the<br />
probe beam. The pump beam is provided by an Ar + cw laser (Coherent, Innova 90 Plus), which generates<br />
different wavelengths between 457 and 528 nm. This beam is focused onto the sample with a 30 cm focal<br />
length achromatic lens resulting in a Rayleigh parameter of ~1.7 cm. The collimated probe beam diameter is ∼<br />
1 mm. Optical filters were used to block the pump beam in the photodetector. The samples are distilled and<br />
deionized water, contained in a quartz cell 1 cm thick, and a BK7 optical glass plate 5.7 mm thick. To<br />
determine the nonlinear optical phase shift, the TL signal is measured at the position where its value is<br />
maximum (sample at position of the excitation beam waist). For negative (positive) photothermal coefficients,<br />
the TL signal is negative (positive).<br />
Osciloscópio<br />
Amplificador<br />
D<br />
Ch<br />
Laser de<br />
Excitação<br />
P<br />
L 1<br />
Laser de<br />
Prova<br />
B<br />
S<br />
A<br />
F<br />
M<br />
L 2<br />
FIG. 1. Mode-mismatched dualbeam<br />
experimental setup. Ch is<br />
the optical chopper, P the prism, L<br />
the lens, B the beam-splitter, F<br />
optical filters, L the defocusing<br />
lens, D the photodetector, A the<br />
current preamplifier, and O the<br />
digital oscilloscope.<br />
Results and Discussions<br />
Figure 2 shows a typical TL signal from distilled water and BK7 glass plate. The solid lines are results of<br />
theoretical fits obtained using Eq. (1), from where the phase shifts were achieved. The following parameters<br />
were used: D = 1.44·10 -3 cm 2 /s, dn/dT = 99·10 -6 K -1 , and K = 6·10 -3 W/cmK for water; and D = 5.2·10 -3 cm 2 /s,<br />
ds/dT = 6·10 -6 K -1 and K = 11.1·10 -3 W/cmK for BK7 glass [10,11]. From these phase shifts the linear<br />
absorption coefficients were calculated. The result for water is in good agreement with previous<br />
measurements based on integrating cavity methods [7]. The obtained spectra for water and BK7 glass are<br />
presented in the Figure 4.<br />
2
XXIX ENFMC - Annals of Optics 2006<br />
TL Signal (ua)<br />
1.06<br />
1.05<br />
1.04<br />
1.03<br />
1.02<br />
1.01<br />
BK7 Optical Glass<br />
λ e<br />
= 514 nm<br />
P e<br />
= 1 W<br />
TL Signal (ua)<br />
1.000<br />
0.995<br />
0.990<br />
0.985<br />
0.980<br />
Pure Water<br />
λ e<br />
= 514 nm<br />
P e<br />
= 1.3 W<br />
1.00<br />
0.975<br />
0 1 2 3 4 5<br />
t (s)<br />
0 100 200 300 400 500<br />
FIG. 2. Transient TL signal for (a) distilled water and (b) BK7 glass. The solid lines are fits with TL equation<br />
from the experimental data.<br />
t (ms)<br />
6<br />
5<br />
BK7 Glass<br />
This work<br />
Schott catalogue (1995)<br />
4<br />
3<br />
Pure Water<br />
α (10 -3 cm -1 )<br />
4<br />
3<br />
2<br />
α (10 -4 cm -1 )<br />
2<br />
1<br />
1<br />
450 460 470 480 490 500 510 520<br />
0<br />
450 465 480 495 510 525<br />
λ (nm)<br />
λ (nm)<br />
FIG. 4. Absorption spectra for (a) pure water and (b) BK7 glass, in the region of 457 - 514 nm.<br />
Conclusions<br />
A particular configuration of the TL technique, where the pump beam is focused in the presence of a<br />
collimated probe beam, has been used for the measurement of low absorption coefficient of transparent<br />
materials. Absorption spectra, in the range of 457 to 528 nm, were obtained for distilled water and BK7 glass.<br />
References<br />
[1] S. E. Bialkowski, Photothermal Spectroscopy Methods for Chemical Analysis (Wiley, New York, 1996).<br />
[2] N. J. Dovichi and J. M. Harris, Anal. Chem. 51, 728 (1979).<br />
[3] G. R. Long and S. E. Bialkowski, Anal. Chem. 56, 2806 (1984).<br />
[4] J. Shen, M. L. Baesso, and R. D. Snook, J. Appl. Phys. 75, 3738 (1994).<br />
[5] A. Marcano O., C. Loper, and N. Melikechi, Appl. Phys. Lett., 78, 3415-3417 (2001).<br />
[6] A. Marcano O., L. Rodríguez, and N. Melikechi, Appl. Spect., 78, 1504-1507 (2001).<br />
[7] R. M. Pope, and E. S. Fry, Applied Optics, 36, 8710-8722 (1997).<br />
[8] J. Shen, A. J. Soroka, and R. D. Snook, J. Appl. Phys. 78, 700 (1995).<br />
[9] M. Sheik-Bahae, A. A. Said, T. H. Wei, D. Hagan, and E. W. Van Stryland, IEEE J. Quantum Electron.<br />
26, 760 (1990).<br />
[10] D. N. Nikogosyan, “Properties of Optical and Laser-Related Materials – A Handbook” John Wiley &<br />
Sons Ltd., 1997.<br />
[11] T. Imasaka, and N. Ishibashi,” Thermal lens Spectrophotometry”, Trends in analytical chemistry, 1,273<br />
(1982).<br />
3
XXIX ENFMC - Annals of Optics 2006<br />
4