Study of color centers created by high-intensity ultra short pulse ...
Study of color centers created by high-intensity ultra short pulse ...
Study of color centers created by high-intensity ultra short pulse ...

Create successful ePaper yourself
Turn your PDF publications into a flip-book with our unique Google optimized e-Paper software.
XXIX ENFMC - Annals <strong>of</strong> Optics 2006<br />
<strong>Study</strong> <strong>of</strong> <strong>color</strong> <strong>centers</strong> <strong>created</strong> <strong>by</strong> <strong>high</strong>-<strong>intensity</strong> <strong>ultra</strong> <strong>short</strong> <strong>pulse</strong><br />
laser interaction in solids<br />
Lilia Coronato Courrol<br />
CEETEPS/Fatec-SP, Departamento de Ensino Geral, Praça Coronel Fernando Prestes, 30,<br />
01124-060, São Paulo, Brazil<br />
e-mail: lcourrol@fatecsp.br<br />
R icardo Elgul Samad, Anderson Zanardi de Freitas, Izilda Marcia Ranieri, Sônia Lícia Baldochi,<br />
Laércio Gomes, Nilson Dias Vieira Jr.<br />
CNEN/IPEN-SP, Centro de Lasers e Aplicações, São Paulo, Brazil<br />
Abstract<br />
In this work we show that is possible to produce <strong>color</strong> <strong>centers</strong> inside fluoride crystals, YLF<br />
and LiF with dimensional control. A Ti:Sapphire CPA laser system operating at 830 nm was used,<br />
producing a train <strong>of</strong> 60 fs <strong>pulse</strong>s at 1 kHz, in a beam with a peak power <strong>of</strong> 12.5 GW. The beam<br />
was focused <strong>by</strong> an 83 mm lens in the low power limit (no self-focusing). The samples were placed<br />
in such way that the beam waist was inside the materials. A comparison between the optical<br />
properties <strong>of</strong> <strong>color</strong> <strong>centers</strong> produced <strong>by</strong> <strong>ultra</strong> <strong>short</strong> laser irradiation, <strong>of</strong> both crystals was done<br />
and, it was possible to determine the center creation <strong>intensity</strong> threshold and therefore to discuss<br />
the basic formation mechanisms <strong>of</strong> these <strong>centers</strong>. Optical absorption and emission <strong>of</strong> produced<br />
<strong>color</strong> <strong>centers</strong> were measured.<br />
Introduction<br />
Color <strong>centers</strong> are lattice vacancies defects trapping electrons or holes. They are usually <strong>created</strong> in single<br />
crystals at room temperature, <strong>by</strong> irradiation with ionizing radiation [1].<br />
Recently, it was shown that is possible to create <strong>color</strong> <strong>centers</strong> with interaction <strong>of</strong> <strong>ultra</strong> <strong>short</strong> <strong>pulse</strong> laser<br />
in crystals [2] and glasses [3]. In this case, the defects may be produced with dimensional control [4], <strong>by</strong><br />
focusing a <strong>high</strong>-<strong>intensity</strong> <strong>ultra</strong>-<strong>short</strong> <strong>pulse</strong> laser in the material. Due to their absorption, a modulation <strong>of</strong> the<br />
material refraction index occurs, creating waveguides or photonics devices [5].<br />
In this work we show that is possible to produce stable <strong>color</strong> <strong>centers</strong> in YLiF 4 (YLF) and in LiF fluoride<br />
crystals using a Ti:Sapphire laser. The optical properties <strong>of</strong> the <strong>color</strong> <strong>centers</strong> produced <strong>by</strong> irradiation with <strong>ultra</strong><br />
<strong>short</strong> laser were performed, allowing the determination <strong>of</strong> the center creation <strong>intensity</strong> threshold and therefore<br />
the discussion <strong>of</strong> the basic formation mechanisms <strong>of</strong> these <strong>centers</strong>.<br />
Experimental Setup<br />
The pure LiF and YLF crystals were grown <strong>by</strong> the Czochralski technique under Argon atmosphere.<br />
A Ti:Sapphire Chirped Pulse Amplified (CPA) laser system operating at 830 nm was used, producing a<br />
train <strong>of</strong> 640 µJ, 60 fs <strong>pulse</strong>s at 1 kHz, in a beam with a M 2 =1.6 and a peak power <strong>of</strong> 12.5 GW. The beam was<br />
focused <strong>by</strong> an 83 mm lens to a radius <strong>of</strong> 12 µm inside the samples. The irradiations were done at room<br />
temperature.<br />
The absorption spectra <strong>of</strong> all samples were measured, at room temperature in the 200 nm-900 nm range,<br />
using a Varian Spectrometer Cary 17 D. The emission spectra were obtained <strong>by</strong> exciting the samples with a 150<br />
Watts xenon lamp. The emissions <strong>of</strong> the samples were analyzed with a 0.5 m monochromator (Spex) and a PMT<br />
detector. The signal was amplified with an EG&G 7220 lock-in and processed <strong>by</strong> a computer.<br />
Results and Discussions<br />
Color center production <strong>by</strong> femtosecond <strong>pulse</strong> laser irradiation in fluoride crystals<br />
The LiF crystal has a wide optical gap (~11.8 eV), therefore being a very good media to study the<br />
formation <strong>of</strong> <strong>color</strong> <strong>centers</strong>. The simplest <strong>color</strong> center is the F center formed <strong>by</strong> an electron trapped in an anion<br />
vacancy. When two, three and four F <strong>centers</strong> are aggregated, F 2 , F 3 and F 4 <strong>centers</strong> are formed, respectively.<br />
When ionized or an electron is additionally trapped <strong>by</strong> these <strong>centers</strong>, positively or negatively charged <strong>color</strong><br />
<strong>centers</strong> are formed (F 2 + or F 2 - <strong>centers</strong> in the case <strong>of</strong> F 2 center), respectively. Table I resumes the known spectral<br />
characteristics <strong>of</strong> such <strong>color</strong> <strong>centers</strong> in LiF crystals.
XXIX ENFMC - Annals <strong>of</strong> Optics 2006<br />
Color center absorption wavelength (nm) emission wavelength (nm)<br />
F 248 -<br />
F 3 316, 374 -<br />
F 2 444 678<br />
+<br />
F 3 448 541<br />
+<br />
F 2<br />
-<br />
F 2<br />
645 910<br />
960 1120<br />
Table 1. Spectral characteristics <strong>of</strong> <strong>color</strong> <strong>centers</strong> in LiF.<br />
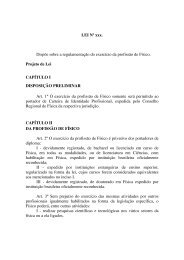
In the figure 1a it is shown the absorption spectra obtained for the LiF and YLF crystals irradiated <strong>by</strong><br />
the <strong>ultra</strong><strong>short</strong> <strong>pulse</strong> laser. For LiF crystals, F center is responsible for absorption around 250 nm, F 3 + and F 2<br />
<strong>centers</strong> are responsibly for the blue absorption band, called M band, due to the 448 nm (F 3 + ) and 444 nm (F 2 )<br />
absorption peaks. Besides the main M absorption band, the red absorption band peaking at the 632 nm band is<br />
due to F 2 + center (ionized F 2 center).<br />
<br />
<br />
<br />
YLF<br />
LiF<br />
α <br />
<br />
<br />
<br />
<br />
<br />
<br />
<br />
a) b)<br />
Figure 21. a)Absorption spectra <strong>of</strong> the tracks <strong>created</strong> in LiF and YLF crystals <strong>by</strong> 640µJ, 60fs laser <strong>pulse</strong>s. b)<br />
Green emission <strong>of</strong> F 3 + <strong>centers</strong> in LiF and <strong>color</strong> <strong>centers</strong> in YLF.<br />
Correspondent absorption bands can be estimate <strong>by</strong> the Mollwo-Ivey [6] relations for absorption bands in<br />
YLF. They can be observed in the spectrum <strong>of</strong> figure 1a: F=296 nm, F 2 = 473 nm, F 3 =343 nm and F 2 + =650 nm,<br />
all shifted to the infrared. In the figure 1b it is possible to see the green luminescence <strong>of</strong> the F 3 + <strong>color</strong> <strong>centers</strong> in<br />
LiF crystals illuminated with a white light and three tracks <strong>of</strong> <strong>color</strong> <strong>centers</strong> produced in an YLF crystal.<br />
The emission spectra obtained exciting the samples around 650 nm (the main absorption band for YLF<br />
crystal) are showed in the figure 3 for the both crystals. We can observe two peaks in both samples, around 710<br />
nm and ~900 nm (cut in the spectra is due to limitations <strong>of</strong> the emission system). Fixing emission at 710 nm we<br />
obtained excitation spectra. Two bands were observed at blue (around 430 nm) and red (around 600 nm),<br />
probably due to F 2 and F 2 + absorptions, respectively. LiF and YLF crystals have the similar emission and<br />
excitation bands but with differences on the signal intensities and shifts in the maximum wavelength.<br />
The pursuit for the stable F 2 + <strong>centers</strong> in crystals it was an important issue in the past for building resonators.<br />
If both thermal and photo stability are present, this center can have <strong>high</strong> energy output and good efficiency [7].<br />
Also, the spectral is shown to be very wide. We believe the stable <strong>centers</strong> produced in YLF can be useful for the<br />
construction <strong>of</strong> <strong>ultra</strong> fast <strong>color</strong> center lasers.<br />
For YLF crystals, the calculated emission cross section for 710 nm emission band was approximately 2x10 -<br />
17 cm 2 (lifetime <strong>of</strong> 90ns).
XXIX ENFMC - Annals <strong>of</strong> Optics 2006<br />
fs irradiated<br />
Signal (a.u.)<br />
0.02<br />
0.00<br />
YLF<br />
LiF<br />
λ exc<br />
=630nm<br />
Signal (a.u.)<br />
650 700 750 800 850 900<br />
0.030<br />
0.024<br />
0.018<br />
0.012<br />
0.006<br />
YLF<br />
LiF<br />
λ em<br />
=710nm<br />
0.000<br />
400 450 500 550 600 650<br />
Wavelength (nm)<br />
Figure 3. Emission spectra obtained in YLF and LiF crystals with excitation at 630 nm (upper graphic) and<br />
excitation spectra obtained fixing the emission at 710 nm (lower graphic).<br />
Intensity Threshold<br />
In order to determine the <strong>color</strong> center creation <strong>intensity</strong> threshold, the samples were placed in the<br />
focused laser beam before the waist, in a position were no <strong>color</strong> <strong>centers</strong> were formed, and were moved towards<br />
the waist until <strong>color</strong> <strong>centers</strong> were observed, <strong>by</strong> naked eye, to be formed <strong>by</strong> the laser <strong>pulse</strong>s. The sample position<br />
relative to the lens was measured, and the <strong>pulse</strong>s <strong>intensity</strong> was calculated at the sample position. Considering<br />
the laser spot size w, given <strong>by</strong> the laser beam propagation law [8]:<br />
2<br />
2<br />
M λ(<br />
z − z0)<br />
<br />
w = w0<br />
1+<br />
<br />
2<br />
<br />
(1)<br />
πw0<br />
<br />
where λ=830nm is the laser wavelength, z 0 =19.8cm is the beam waist position relative to the lens, w 0 =25<br />
µm is the beam waist, M 2 =1.6 is the beam quality factor and z=17.5cm is the sample position where <strong>color</strong> <strong>centers</strong><br />
were observed to be formed <strong>by</strong> the laser <strong>pulse</strong>s, resulting in w=390 µm. In this measure the <strong>pulse</strong> energy was 547<br />
µJ and the <strong>pulse</strong> width 60 fs. By applying a method recently developed [9] it was obtained the <strong>color</strong> center<br />
creation threshold <strong>of</strong> 1.9 TW/cm 2 for YLF and 2.04TW/cm 2 for LiF crystals.<br />
To explain the <strong>color</strong> <strong>centers</strong> production <strong>by</strong> the <strong>ultra</strong><strong>short</strong> <strong>pulse</strong>s, we propose a mechanism based in the<br />
electron avalanche that develops due to a strong initial non-linear multiphoton absorption [10, 11]. This<br />
avalanche promotes many electrons to the conduction band, where they acquire kinetic energy from the laser<br />
field and create vacancies <strong>by</strong> impact with the fluorine ions. When this anion vacancy traps an electron<br />
(neutralizing the vacancy charge), an F center is <strong>created</strong>. The second step in the production <strong>of</strong> defects involves<br />
the migration <strong>of</strong> primary defects and the formation <strong>of</strong> complex defects. These secondary processes are<br />
temperature and <strong>intensity</strong> rate dependent. Using a focused laser beam the density <strong>of</strong> primary defects formed is so<br />
much <strong>high</strong>er than the usual methods and therefore the probability <strong>of</strong> aggregation is very much increased. This<br />
can be seen <strong>by</strong> the ratio <strong>of</strong> the F to the M bands in YLF (fig. 1a). This ratio is much <strong>high</strong>er when the <strong>centers</strong> are<br />
produced <strong>by</strong> regular ionizing radiation [12]. We believe that there is equilibrium between the creation and<br />
destruction processes that occur simultaneously, during the <strong>ultra</strong><strong>short</strong> <strong>pulse</strong>s irradiation, since the fundamental<br />
and the harmonics [13] <strong>of</strong> pumping laser can be absorbed <strong>by</strong> the defects as well as the white light generation.<br />
These <strong>centers</strong> are generally unstable with the combination <strong>of</strong> temperature and intense light [14.]<br />
Conclusions<br />
This paper describes a way to perform controlled ablation in undoped LiF and YLF crystals. Stable<br />
<strong>color</strong> <strong>centers</strong> in the YLF crystals were produced and characterized for the first time to our knowledge.<br />
We propose that the mechanism responsible for the <strong>centers</strong> creation is a multiphoton process depending
XXIX ENFMC - Annals <strong>of</strong> Optics 2006<br />
on the crystal energy gap. Also, when produced in a controlled way, these <strong>color</strong> center tracks could be<br />
used to manufacture photonic devices.<br />
Acknowledgements<br />
The authors thank the Fundação Amparo à Pesquisa do Estado de São Paulo under the grant 00/15135-9.<br />
References<br />
1 A. M Espirito, L. C. Courrol, I. M Ranieri., N. U. Wetter, N. D. Vieira Jr., S. L. Baldochi, Optical<br />
Materials.27,.487, (2004).<br />
2 L. C. Courrol, R. E. Samad, L. Gomes, I. M. Ranieri, S. L. Baldochi, A. Z. Freitas, and N.D. Vieira Jr., Optics<br />
Express 12 (2): 288-293, (2004).<br />
3 S. M. Avanesyan, S. Orlando, S. C. Langford and J. T. Dickinson, Applied Surface Science, 248, 129, (2005).<br />
4 T. Kurobori, T. Kitao, T. Hirose, Y. Kawamura, K. Takamizu, D. M. Hirano, and H Hosono, Radiation<br />
Measurements, 38, 759, (2004).<br />
5 G. Baldachini and R. M. Montereali, Optical Materials, 16, 53, (2001).<br />
6 H. Yvey, Physical Review, 72, 341, (1947).<br />
7 S.B. MIROV, A.YU. DERGACHEV, Proceedings <strong>of</strong> SPIE Vol. 2986, 162-173,(1997).<br />
8 D. R. P. Hall, E. Jackson, The physics and technology <strong>of</strong> laser resonators (IOP Publishing) (1989).<br />
9 R.E Samad, and. N.D Vieira Jr., Laser Physics, v. 16(2), pp 336-339, (2006).<br />
10 N. Bloembergen, IEEE J. Quantum Elec. 10, 375, (1974).<br />
11 D. Du,. X. Liu, G. Korn, J. Squier.and G. Mourou, Appl. Phys. Lett. 64, 3071, (1994).<br />
12 L. C COURROL , L. GOMES, I. M. RANIERI, Physical Review B, 42, 7, (1990).<br />
13 A. Brodeur and S. L Chin, Phys. Rev. Lett. 80, 4406, (1998).<br />
14 Y. A Dergachev, and. S. B. Mirov, Optics Communications, 147, 107, (1998).