Real-Time Measurement Of Nanometer-Order Amplitude Transverse ...
Real-Time Measurement Of Nanometer-Order Amplitude Transverse ...
Real-Time Measurement Of Nanometer-Order Amplitude Transverse ...

Create successful ePaper yourself
Turn your PDF publications into a flip-book with our unique Google optimized e-Paper software.
OPTICS - XXV ENFMC ANNALS -2002<br />
<strong>Real</strong>-<strong>Time</strong> <strong>Measurement</strong> <strong>Of</strong> <strong>Nanometer</strong>-<strong>Order</strong> <strong>Amplitude</strong><br />
<strong>Transverse</strong> Vibrations Using The Photo-Emf Effect In<br />
Photoconductive Materials<br />
Luis Mosquera , Jaime Frejlich *<br />
*Laboratório de Óptica - IFGW, UNICAMP, Campinas,SP,Brazil<br />
frejlich@ifi.unicamp.br<br />
Abstract<br />
We report the use of the photo-emf effect in photoconductive crystals (GaAs and BTO) to measure<br />
small lateral vibrations of speckle patterns generated for rough surfaces.Vibration of the rough<br />
surface results in a periodic movement of the intensity pattern, this movement leads to generation<br />
of an alternating electric current in the crystal proportional to the amplitud of the target vibration.<br />
We showing the experimental observed basic dependences of the output signal on the vibration<br />
frequency and amplitude as well as on the light intensity.High sensitivity, simplicity of the<br />
equipment, shown this method very attractive for practical applications.<br />
Introduction<br />
We report the use of the photo-emf effect in photoconductive crystals to measure nanometer-order amplitude<br />
transverse vibrations.The method is based on the illumination of the surface under analysis by a direct laser<br />
beam of adequate wavelength (according to the photoconductor that is being used) beam and the collection of the<br />
back-scattered speckled pattern of light onto the photoconductor.A pattern of space-charge electric field is builtup<br />
in the photoconductive material volume on a time-scale corresponding to the response time of the material<br />
that is essentially controlled by charge-transport phenomena.A pattern of free electrons in the conduction band is<br />
simultaneously built-up with a much faster time-scale (probably some nanoseconds for the materials in our<br />
experiments) that depends on the excitation of electrons from photoactive centers inside the material band gap<br />
into the conduction band.If the illuminated target surface is static, the pattern of space-charge field and free<br />
electrons are in mutual equilibrium and no electric signal is detected.However,if the target is laterally<br />
vibrating,the speckle pattern of light is simultaneously moving and the fast pattern of free electrons follows.The<br />
pattern of space-charge field instead is comparatively much slower and is not able to follow.In this way the free<br />
charge distribution and the pattern of electric field are mutually displaced proportionally to the amplitude of the<br />
target vibration and are not any more in equilibrium.An alternating current is therefore produced that can be<br />
detected to find out the size of the target vibration amplitude.We report experiments carried out with GaAs and<br />
Bi 12 TiO 20 crystals.<br />
Theory<br />
The transverse vibration of a rough surface results in a periodic movement of the intensity (I(x)) of the speckle<br />
pattern.This movement leads to a electric current along coordenate x in the fotoconductor crystal add a<br />
corresponding density (N(x)) of free electrons in the conduction band :<br />
I(<br />
x)<br />
= Ioexp[<br />
−(<br />
x + ∆ Sin(<br />
Ωt))<br />
2<br />
/ D<br />
2<br />
]<br />
0<br />
s<br />
N(<br />
x)<br />
= Noexp[<br />
−(<br />
x + ∆ Sin(<br />
Ωt))<br />
2<br />
/ D<br />
2<br />
0<br />
s<br />
J ( x)<br />
= eµ<br />
Ν(<br />
x)<br />
E(<br />
x)<br />
+ eD(<br />
∇N)<br />
x<br />
(1)<br />
It is possible to show that the first harmonic component J Ω of the fotocurrent is
OPTICS - XXV ENFMC ANNALS -2002<br />
J<br />
Ω<br />
∝ C∆<br />
exp( iΩt)(<br />
iΩ<br />
/ Ω ) /(1 + iΩ<br />
/ Ω )<br />
(2)<br />
0<br />
0 0<br />
Where Ω 0 is the characteristic response frequency of the material.<br />
The experimental arrangement<br />
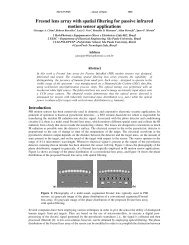
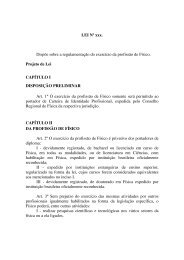
The Setup is schematically shown in Fig.1. An vibrating speckle pattern is produced by a diffusely rough surface<br />
of a loudspeaker.This surface was illuminated by a collimated laser beam (λ=670 nm, P=5 mw for GaAs and<br />
λ=532 nm, P=70 mw for BTO) with a beam diameter 0.5 - 1 mm. The loudspeaker was interferometrically<br />
calibrated for velocimetry doppler technic.Two parallel stripe electrodes with an interelectrode separation 1.5mm<br />
were deposited on the front surface (4x4mm 2 ) of a 4mm x 4mm x 1mm crystal of GaAs. And electrodes of<br />
silver paint were deposited on the lateral faces (5.3x2mm 2 ) of a 5mm x 5.3mm x 2mm crystal of BTO. this<br />
electrodes were oriented perpendicular to the vibration direction to obtain the maximum output signal. A lens<br />
with a focal length F= 24 mm was used to image the illuminated spot on to the front surface of the crystals with<br />
a magnification M. Under these conditions, the speckle pattern moved as a whole with the image.The amplitude<br />
∆ 0 of the speckle pattern vibration on the crystal was M sin(θ) times the vibration amplitude of the surface (∆ ).<br />
The average speckle diameter (d) in the crystal plane was calculated with d =1.22 λZ/D where Z is the distance<br />
from the lens to the crystal and D is the diameter of the lens aperture.<br />
Experimental Set-up<br />
mirror<br />
Laser 2<br />
∆, Ω<br />
Laser 1<br />
oscilloscope<br />
Lock-in<br />
Experimental results<br />
Photo-detector<br />
o<br />
o<br />
o<br />
s<br />
o<br />
s<br />
ci<br />
s<br />
crystal<br />
loudspeaker<br />
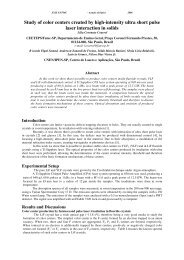
The experimental results are showing ,the response of the loudspeaker obtained for velocimetry doppler shown<br />
in the fig 2 is used for calibrated of our crystals photodetectors.<br />
lens<br />
Fig1. The laser1 is used for velocimetry dopller callibration and the<br />
laser2 is used for measurement of output ac current i Ω .
OPTICS - XXV ENFMC ANNALS -2002<br />
0.15<br />
Loudspeaker 1<br />
∆/V<br />
µm/mv<br />
0.10<br />
0.05<br />
0 .0 1 0<br />
0 .0 0 5<br />
0<br />
S M = 162nm<br />
1 0 0 0 2 0 0 0 3 0 0 0 4 0 0 0<br />
0<br />
0 1000 2000 3000 4000 5000<br />
Frecuencia(hz)<br />
Fig2. Output signal velocimetry doppler showing the respost<br />
of loadspeaker 1 on vibration frequency.<br />
( i Ω /V MOD<br />
) / (I T<br />
∗∆ / V MO D<br />
) pA/ (µm*wm -2 )<br />
200<br />
150<br />
100<br />
y=(a*x/b)/(1+(x/b) 2 ) 0 .5<br />
bto11<br />
50<br />
0 1000 2000 3000 4000 5000<br />
frecuencia (hz)<br />
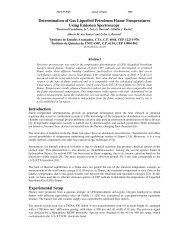
Fig3a.frequency dependence of the output ac current<br />
i Ω .The red curve represent the fit of the theorical<br />
equation 3 .W 0 =510hz is found .<br />
(i Ω / V MOD<br />
) / (∆/V MOD<br />
) nA / µm<br />
1.5<br />
1.0<br />
0.5<br />
y=(a*x/b)/(1+(x/b) 2 ) 0.5<br />
R=1.018 MΩ<br />
GaAs<br />
0<br />
0 1000 2000 3000 4000 5000<br />
frecuencia(hz)<br />
Fig3b.Dependence of output signal on vibration<br />
frequency (GaAs).The red curve represent the fit<br />
of the theorical equation 3.W 0 =8411hz is found.<br />
i Ω (nA)<br />
2.5<br />
2.0<br />
1.5<br />
1.0<br />
BTO 011<br />
f=400hz<br />
f=1335hz<br />
i Ω (pA)<br />
15<br />
10<br />
GaAs<br />
R=17.7MΩ<br />
R=20.87MΩ<br />
R=25.24MΩ<br />
R=31.60MΩ<br />
R=37.20MΩ<br />
5<br />
0.5<br />
0<br />
0 0.1 0.2 0.3 0.4<br />
0 2 4 6 8 10<br />
∆ (µm)<br />
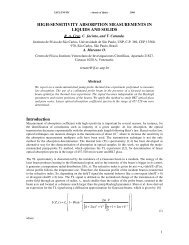
Fig.4a Output signal as a function of vibration<br />
amplitude ∆ of the loudspeaker 1.Io = 2.5mw/mm 2 ,<br />
λ=532nm.the additional abscissae refer to f=400hz.<br />
0<br />
0 50 100 150<br />
V MOD<br />
(mv)<br />
Fig.4b Output signal as a function of<br />
vibration amplitude ∆ of the loudspeaker 2.<br />
λ=670nm, f=950hz.
OPTICS - XXV ENFMC ANNALS -2002<br />
i Ω / δ (pA)<br />
1500<br />
1000<br />
500<br />
BTO011<br />
y=a*250*x/((250) 2 +(b*x) 2 ) 0.5<br />
a=4.98, b=2.44<br />
σ f=3160hz<br />
ph<br />
= 167*10 -12 m/Ωw<br />
f=762hz<br />
f=250hz<br />
f=76hz<br />
i Ω (pA)<br />
200<br />
150<br />
100<br />
50<br />
y=a*840*x/((840) 2 +(b*x) 2 ) 0.5<br />
V MOD<br />
=244mv<br />
V MOD<br />
=424mv<br />
V MOD<br />
=700mv<br />
Ω=840hz<br />
GaAs<br />
0<br />
0 100 200 300 400<br />
I T<br />
(w/m 2 )<br />
Fig5a Output signal i Ω /δ dependence on<br />
light intensity. (λ=532nm)<br />
0<br />
0 0.2 0.4 0.6 0.8 1.0<br />
I / Io<br />
Fig5b Output signal i Ω dependence on<br />
light intensity.Io=1 correspond to<br />
R=28.1MΩ (λ=670nm).<br />
Data analysis and Conclusions<br />
The figure 2 shows the characteristic frequency response of a commercial loadspeaker (10 watts, 8Ω) carried out<br />
using Doppler velocimetry. The validity of relation (2) was verfied from the experimental results in figs 3, 4 and<br />
5 for BTO and GaAs crystals. The figures 3a and 3b shown the output signal of current i Ω as a function of<br />
vibration frequency obtained for vibration amplitudes much smaller than a speckle diameter.The best fit to<br />
equation (2) was obtained for Ω o =2π* 510 s -1 for BTO (this value of Ω o is nearly equal to that measured in [2]<br />
for a BTO crystal using oscillating sinusoidal patterns under similar conditions of illumination. Ωo= 2π *8411 s -1<br />
was obtaines for GaAs. The dependence of the output signals on vibration amplitude are shown in figures 4 and<br />
4b. Data in fig 4a show linear response for small amplitudes at 1335 hz and nonlinear response (for large<br />
amplitudes) at 400hz. For 1335 hz the smallest possible amplitude to be measured was 0.3nm. The signal<br />
dependence on light intensity are shown in the figures 5 and 5b. That is proportional to I for vibration<br />
frequencies higher than the cut-off frequency Ωo as predicted by equation (2). A specific conductivity<br />
σ ph =167*10 -12 mΩ -1 w -1 is found for BTO in good agreement with results report in ref [2].<br />
In conclusion,we have shown that the interaction of a vibrating speckle pattern with fotoconductors crystals<br />
(BTO and GaAs) results in the generation of non-steady-state photo-emf signal that should be used to measure<br />
small vibrations, as low as 10 -5 of the speckle diameter.<br />
References<br />
[1]S.I.Stepanov,”Photo-electromotive-force effect in semiconductors”,in Semiconductor<br />
devices(H.S.Nalwa,ed.),2 of Handbook of Advanced Electronic and Photonic Materials na Devices, ch.6,<br />
Academic Press, 2001.<br />
[2]L.Mosquera and Jaime Frejlich,”Enhanced photocurrent in photo-emf experiments in pure and doped<br />
absorbing photorefractive crystals”,J.Opt.Soc.Am.B/vol.19,No12/December 2002.<br />
[3]N.ªKorneev and S.I.Stepanov,”<strong>Measurement</strong> of small lateral vibrations of speckle patterns using a nonsteady-state<br />
photo-EMF in GaAs:Cr” , Journal of Modern Optics, 1991,vol.38,N011,2153-2158.<br />
[4]Nadezhda Nazhestkina,Ervin Nippolain,Alexei ªKamshilin,Victor V. Prokofiev,andTimo<br />
Jaaskelainen,”Polarization self-modulation of speckle patterns in a bundle of photorefractive crystals”,Journal <strong>Of</strong><br />
Applied Physics,volume88,number5,1 Setember 2000.