Decentralization and Corruption in the Philippines
Decentralization and Corruption in the Philippines
Decentralization and Corruption in the Philippines

Create successful ePaper yourself
Turn your PDF publications into a flip-book with our unique Google optimized e-Paper software.
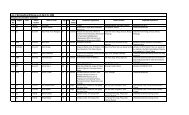
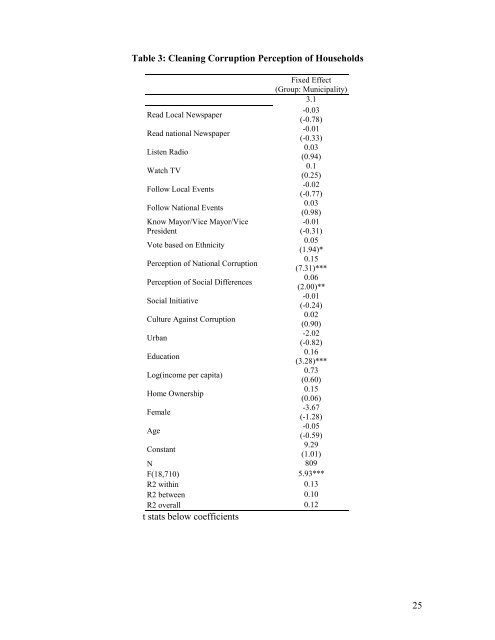
Table 3: Clean<strong>in</strong>g <strong>Corruption</strong> Perception of Households<br />
Read Local Newspaper<br />
Read national Newspaper<br />
Listen Radio<br />
Watch TV<br />
Follow Local Events<br />
Follow National Events<br />
Know Mayor/Vice Mayor/Vice<br />
President<br />
Vote based on Ethnicity<br />
Perception of National <strong>Corruption</strong><br />
Perception of Social Differences<br />
Social Initiative<br />
Culture Aga<strong>in</strong>st <strong>Corruption</strong><br />
Urban<br />
Education<br />
Log(<strong>in</strong>come per capita)<br />
Home Ownership<br />
Female<br />
Age<br />
Constant<br />
Fixed Effect<br />
(Group: Municipality)<br />
3.1<br />
-0.03<br />
(-0.78)<br />
-0.01<br />
(-0.33)<br />
0.03<br />
(0.94)<br />
0.1<br />
(0.25)<br />
-0.02<br />
(-0.77)<br />
0.03<br />
(0.98)<br />
-0.01<br />
(-0.31)<br />
0.05<br />
(1.94)*<br />
0.15<br />
(7.31)***<br />
0.06<br />
(2.00)**<br />
-0.01<br />
(-0.24)<br />
0.02<br />
(0.90)<br />
-2.02<br />
(-0.82)<br />
0.16<br />
(3.28)***<br />
0.73<br />
(0.60)<br />
0.15<br />
(0.06)<br />
-3.67<br />
(-1.28)<br />
-0.05<br />
(-0.59)<br />
9.29<br />
(1.01)<br />
N 809<br />
F(18,710) 5.93***<br />
R2 with<strong>in</strong> 0.13<br />
R2 between 0.10<br />
R2 overall 0.12<br />
t stats below coefficients<br />
25