Additional Homework Problems - Pearson
Additional Homework Problems - Pearson
Additional Homework Problems - Pearson

Create successful ePaper yourself
Turn your PDF publications into a flip-book with our unique Google optimized e-Paper software.
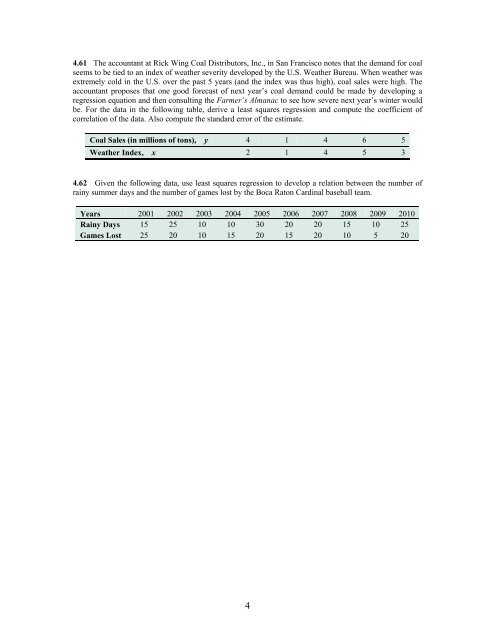
4.61 The accountant at Rick Wing Coal Distributors, Inc., in San Francisco notes that the demand for coal<br />
seems to be tied to an index of weather severity developed by the U.S. Weather Bureau. When weather was<br />
extremely cold in the U.S. over the past 5 years (and the index was thus high), coal sales were high. The<br />
accountant proposes that one good forecast of next year’s coal demand could be made by developing a<br />
regression equation and then consulting the Farmer’s Almanac to see how severe next year’s winter would<br />
be. For the data in the following table, derive a least squares regression and compute the coefficient of<br />
correlation of the data. Also compute the standard error of the estimate.<br />
Coal Sales (in millions of tons), y 4 1 4 6 5<br />
Weather Index, x 2 1 4 5 3<br />
4.62 Given the following data, use least squares regression to develop a relation between the number of<br />
rainy summer days and the number of games lost by the Boca Raton Cardinal baseball team.<br />
Years 2001 2002 2003 2004 2005 2006 2007 2008 2009 2010<br />
Rainy Days 15 25 10 10 30 20 20 15 10 25<br />
Games Lost 25 20 10 15 20 15 20 10 5 20<br />
4


![[Productnaam] Marketingplan - Pearson](https://img.yumpu.com/26285712/1/190x132/productnaam-marketingplan-pearson.jpg?quality=85)