Full Feasibility Analysis - Pearson
Full Feasibility Analysis - Pearson
Full Feasibility Analysis - Pearson

Create successful ePaper yourself
Turn your PDF publications into a flip-book with our unique Google optimized e-Paper software.
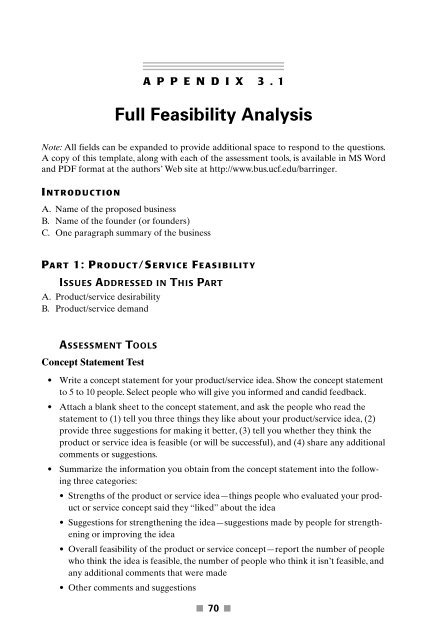
A P P E N D I X 3 . 1<br />
<strong>Full</strong> <strong>Feasibility</strong> <strong>Analysis</strong><br />
Note: All fields can be expanded to provide additional space to respond to the questions.<br />
A copy of this template, along with each of the assessment tools, is available in MS Word<br />
and PDF format at the authors’ Web site at http://www.bus.ucf.edu/barringer.<br />
I NTRODUCTION<br />
A. Name of the proposed business<br />
B. Name of the founder (or founders)<br />
C. One paragraph summary of the business<br />
PART 1: PRODUCT/SERVICE F EASIBILITY<br />
ISSUES ADDRESSED IN THIS PART<br />
A. Product/service desirability<br />
B. Product/service demand<br />
ASSESSMENT TOOLS<br />
Concept Statement Test<br />
• Write a concept statement for your product/service idea. Show the concept statement<br />
to 5 to 10 people. Select people who will give you informed and candid feedback.<br />
• Attach a blank sheet to the concept statement, and ask the people who read the<br />
statement to (1) tell you three things they like about your product/service idea, (2)<br />
provide three suggestions for making it better, (3) tell you whether they think the<br />
product or service idea is feasible (or will be successful), and (4) share any additional<br />
comments or suggestions.<br />
• Summarize the information you obtain from the concept statement into the following<br />
three categories:<br />
• Strengths of the product or service idea—things people who evaluated your product<br />
or service concept said they “liked” about the idea<br />
• Suggestions for strengthening the idea—suggestions made by people for strengthening<br />
or improving the idea<br />
• Overall feasibility of the product or service concept—report the number of people<br />
who think the idea is feasible, the number of people who think it isn’t feasible, and<br />
any additional comments that were made<br />
• Other comments and suggestions<br />
■ 70 ■
CHAPTER 3 <strong>Feasibility</strong> <strong>Analysis</strong> 71 ■<br />
Buying Intentions Survey<br />
• Distribute the concept statement to 15 to 30 prospective customers (do not include<br />
any of the people who completed the concept statement test) with the following<br />
buying intentions survey attached. Ask each participant to read the concept statement<br />
and complete the buying intentions survey. Record the number of people who<br />
participated in the survey and the results of the survey here.<br />
• Along with the raw data recorded here, report the percentage of the total number of<br />
people you surveyed that said they would probably buy or definitely would buy your<br />
product or service if offered. This percentage is the most important figure in gauging<br />
potential customer interest.<br />
• One caveat is that people who say that they intend to purchase a product do not always<br />
follow through, so the numbers resulting from this activity are almost always<br />
optimistic. Still, the numbers provide you with a preliminary indication of how your<br />
most likely customers will respond to your potential product or service offering.<br />
How likely would you be to buy the product or service described above?<br />
______ Definitely would buy<br />
______ Probably would buy<br />
______ Might or might not buy<br />
______ Probably would not buy<br />
______ Definitely would not buy<br />
Additional questions may be added to the buying intentions survey.<br />
Conclusion (expand fields and report findings, in discussion form, for each area)<br />
A. Product/service desirability<br />
B. Product/service demand<br />
C. Product/service feasibility (circle the correct response)<br />
Not Feasible Unsure Feasible<br />
D. Suggestions for improving product/service feasibility.<br />
PART 2: INDUSTRY/MARKET F EASIBILITY<br />
ISSUES ADDRESSED IN THIS PART<br />
A. Industry attractiveness<br />
B. Target market attractiveness<br />
C. Timeliness of entry into the target market<br />
ASSESSMENT TOOLS<br />
Industry Attractiveness<br />
• To the extent possible, assess the industry at the five-digit NAICS code level your<br />
potential business will be entering. Use a broader industry category (less NCICS<br />
digits) if appropriate (http://www.census.gov/epcd/www/naicstab.htm).<br />
• Assess the attractiveness of the industry the potential business plans to enter on<br />
each of the following dimensions.
■ 72 PART II What to Do Before the Business Plan Is Written<br />
Industry Attractiveness Assessment Tool<br />
(used to assess the broad industry, rather than the specific target market, you plan to enter)<br />
Low Potential Moderate Potential High Potential<br />
1. Number of competitors Many Few None<br />
2. Age of industry Old Middle aged Young<br />
3. Growth rate of industry Little or no Moderate growth Strong growth<br />
growth<br />
4. Average net income for<br />
firms in the industry<br />
Low Medium High<br />
5. Degree of industry<br />
concentration<br />
Concentrated<br />
6. Stage of industry life cycle Maturity phase<br />
or decline<br />
phase<br />
7. Importance of industry’s “Ambivalent”<br />
products and/or services<br />
to customers<br />
8. Extent to which business<br />
and environmental trends<br />
are moving in favor of the<br />
industry<br />
9. Number of exciting new product<br />
and services emerging<br />
from the industry<br />
Neither<br />
concentrated<br />
nor fragmented<br />
Growth phase<br />
“Would like to<br />
have”<br />
Low Medium High<br />
Low Medium High<br />
Fragmented<br />
Emergence<br />
phase<br />
“Must have”<br />
10. Long-term prospects Weak Neutral Strong<br />
Target Market Attractiveness<br />
• Identify the portion or specific market within your broader industry that you plan to<br />
target.<br />
• Assess the attractiveness of the target market on each of the following dimensions.<br />
Target Market Attractiveness Assessment Tool<br />
(used to assess the specific target market, rather than the broader industry, you plan to enter)<br />
1. Number of competitors in<br />
target market<br />
2. Growth rate of firms in the<br />
target market<br />
3. Average net income for<br />
firms in the target market<br />
Low Potential Moderate Potential High Potential<br />
Many Few None<br />
Little to no<br />
growth<br />
Slow growth<br />
Low Medium High<br />
Rapid growth
CHAPTER 3 <strong>Feasibility</strong> <strong>Analysis</strong> 73 ■<br />
Low Potential Moderate Potential High Potential<br />
4. Methods for generating<br />
revenue in the industry<br />
5. Ability to create “barriers<br />
to entry” for potential<br />
competitors<br />
6. Degree to which customers<br />
feel satisfied by the current<br />
offerings in the target market<br />
7. Potential to employ low cost<br />
guerrilla and/or buzz marketing<br />
techniques to promote the<br />
firm’s product or services<br />
8. Excitement surrounding new<br />
product/service offerings in<br />
the target market<br />
Unclear Somewhat clear Clear<br />
Unable to<br />
create<br />
Satisfied<br />
May or may not be<br />
able to create<br />
Neither satisfied<br />
or dissatisfied<br />
Low Moderate High<br />
Low Medium High<br />
Can create<br />
Unsatisfied<br />
Market Timeliness<br />
• Determine the extent to which the “window of opportunity” for the proposed business<br />
is open or closed based on the following criteria.<br />
• Determine the timeliness of entering a specific target market based on other criteria.<br />
Market Timeliness Assessment Tool<br />
1. Buying mood of customers Customers are<br />
not in a buying<br />
mood<br />
2. Momentum of the market Stable to losing<br />
momentum<br />
3. Need for a new firm in the<br />
market with your offerings<br />
or geographic location<br />
4. Extent to which business and<br />
environmental trends are<br />
moving in favor of the target<br />
market<br />
5. Recent or planned entrance<br />
of large firms into the<br />
market<br />
Low Potential Moderate Potential High Potential<br />
Customers are<br />
in a moderate<br />
buying mood<br />
Slowly gaining<br />
momentum<br />
Low Moderate High<br />
Low Medium High<br />
Large firms<br />
entering<br />
the market<br />
Rumors that large<br />
firms may be<br />
entering the<br />
market<br />
Customers are<br />
in an aggressive<br />
buying<br />
mood<br />
Rapidly gaining<br />
momentum<br />
No larger firms<br />
entered the<br />
market or<br />
are rumored<br />
to be entering<br />
the<br />
market
■ 74 PART II What to Do Before the Business Plan Is Written<br />
Conclusion (expand fields and report findings, in discussion form, for each area)<br />
A. Industry attractiveness<br />
B. Target market attractiveness<br />
C. Market timeliness<br />
C. Industry/market feasibility (circle the correct response)<br />
Not Feasible Unsure Feasible<br />
E. Suggestions for improving industry/market feasibility.<br />
PART 3: ORGANIZATIONAL F EASIBILITY<br />
ISSUES ADDRESSED IN THIS PART<br />
A. Management prowess<br />
B. Resource sufficiency<br />
ASSESSMENT TOOLS<br />
Management Prowess<br />
• Use the following table to candidly and objectively rate the “prowess” of the<br />
founder or group of founders who will be starting the proposed venture.<br />
Management Prowess Assessment Tool<br />
1. Passion for the business<br />
idea<br />
2. Relevant industry<br />
experience<br />
3. Prior entrepreneurial<br />
experience<br />
4. Depth of professional and<br />
social networks<br />
5. Creativity among management<br />
team members<br />
6. Experience and expertise in<br />
cash flow management<br />
7. College graduate No college<br />
education<br />
Low Potential Moderate Potential High Potential<br />
Low Moderate High<br />
None Moderate Extensive<br />
None Moderate Extensive<br />
Weak Moderate Strong<br />
Low Moderate High<br />
None Moderate High<br />
Some college<br />
education but<br />
not currently in<br />
college<br />
Graduated or<br />
are currently<br />
in college
CHAPTER 3 <strong>Feasibility</strong> <strong>Analysis</strong> 75 ■<br />
Resource Sufficiency<br />
• The focus in this section is on nonfinancial resources. Use the following table to rate<br />
your “resource sufficiency” in each category.<br />
• The list of resources is not meant to be exhaustive. A list of the 6 to 12 most critical<br />
nonfinancial resources for your proposed business is sufficient.<br />
An explanation of the rating system used in the first portion of the table is as follows:<br />
1 Available<br />
2 Likely to be available: will probably be available and will be within my budget<br />
3 Unlikely to be available: will probably be hard to find or gain access to, and may<br />
exceed my budget<br />
4 Unavailable<br />
5 NA: not applicable for my business<br />
Resource Sufficiency Assessment Tool<br />
Ratings<br />
Resource Sufficiency<br />
1 2 3 4 5 Office space<br />
1 2 3 4 5 Lab space, manufacturing space, or space to launch a<br />
service business<br />
1 2 3 4 5 Contract manufacturers or outsource providers<br />
1 2 3 4 5 Key management employees (now and in the future)<br />
1 2 3 4 5 Key support personnel (now and in the future)<br />
1 2 3 4 5 Key equipment needed to operate the business<br />
(computers, machinery, delivery vehicles)<br />
1 2 3 4 5 Ability to obtain intellectual property protection on key<br />
aspects of the business<br />
1 2 3 4 5 Support of local and state government if applicable for<br />
business launch<br />
1 2 3 4 5 Ability to form favorable business partnerships<br />
Ratings: Strong, Neutral,<br />
or Weak<br />
_________________________<br />
_________________________<br />
_________________________<br />
_________________________<br />
Proximity to similar firms (for the purpose of knowledge<br />
sharing)<br />
Proximity to suppliers<br />
Proximity to customers<br />
Proximity to a major research university (if applicable)
■ 76 PART II What to Do Before the Business Plan Is Written<br />
Conclusion (expand fields and report findings, in discussion form, for each area)<br />
A. Management prowess<br />
B. Resource sufficiency<br />
C. Organizational feasibility (circle the correct response)<br />
Not Feasible Unsure Feasible<br />
D. Suggestions for improving organizational feasibility<br />
PART 4: FINANCIAL F EASIBILITY<br />
ISSUES ADDRESSED IN THIS PART<br />
A. Total startup cash needed<br />
B. Financial performance of similar businesses<br />
C. Overall financial attractiveness of the proposed venture<br />
ASSESSMENT TOOLS<br />
Total Start-up Cash Needed<br />
• The startup costs (which include capital investments and operating expenses) should<br />
include all the costs necessary for the business to make its first sale. New firms typically<br />
need money for a host of purposes, including the hiring of personnel, office or<br />
manufacturing space, equipment, training, research and development, marketing,<br />
and the initial product rollout.<br />
• At the feasibility analysis stage, it is not necessary for the number to be exact. However,<br />
the number should be fairly accurate to give an entrepreneur an idea of the<br />
dollar amount that will be needed to launch the firm. After the approximate dollar<br />
amount is known, the entrepreneur should determine specifically where the money<br />
will come from to cover the startup costs.<br />
• The total startup cash needed can be estimate using the following table.<br />
Total Startup Cash Needed (to Make First Sale)<br />
Capital Investments<br />
Property<br />
Furniture and fixtures<br />
Computer equipment<br />
Other equipment<br />
Vehicles<br />
Amount<br />
____________________________________<br />
____________________________________<br />
____________________________________<br />
____________________________________<br />
____________________________________
CHAPTER 3 <strong>Feasibility</strong> <strong>Analysis</strong> 77 ■<br />
Operating Expenses<br />
Legal, accounting, and professional services<br />
Advertising and promotions<br />
Deposits for utilities<br />
Licenses and permits<br />
Prepaid insurance<br />
Lease payments<br />
Salary and wages<br />
Payroll taxes<br />
Travel<br />
Signs<br />
Tools and supplies<br />
Starting inventory<br />
Cash (working capital)<br />
Other expense 1<br />
Other expense 2<br />
Total Startup Cash Needed =<br />
Amount<br />
____________________________________<br />
____________________________________<br />
____________________________________<br />
____________________________________<br />
____________________________________<br />
____________________________________<br />
____________________________________<br />
____________________________________<br />
____________________________________<br />
____________________________________<br />
____________________________________<br />
____________________________________<br />
____________________________________<br />
____________________________________<br />
____________________________________<br />
Comparison of the Financial Performance of Proposed Venture to Similar Firms<br />
• Use the following tables to compare the proposed new venture to similar firms in<br />
regard to annual sales (Year 1 and Year 2) and profitability (Year 1 and Year 2).<br />
Comparison of the Financial Performance of Proposed Venture to Similar Firms<br />
Assessment Tool<br />
Annual Sales<br />
Estimate of Proposed Venture’s<br />
Annual Sales—Year 1<br />
Explanation of How the Estimate<br />
Was Computed<br />
Estimate of Year 1 Sales _____<br />
____________________________<br />
Summary: How proposed annual sales, on average, ____________________________<br />
compares to similar firms (circle one)<br />
____________________________<br />
Below Average Average Above Average ____________________________<br />
Estimate of Year 2 Sales _____<br />
____________________________<br />
Summary: How proposed annual sales, on average, ____________________________<br />
compares to similar firms (circle one)<br />
____________________________<br />
Below Average Average Above Average ____________________________
■ 78 PART II What to Do Before the Business Plan Is Written<br />
Net Income<br />
Estimate of Proposed Venture’s<br />
Net Income—Year 1<br />
Explanation of How the Estimate<br />
Was Computed<br />
Estimate of Year 1 Net Income __________<br />
____________________________<br />
Summary: How proposed net income, on average, ____________________________<br />
compares to similar firms (circle one)<br />
____________________________<br />
Below Average Average Above Average ____________________________<br />
Estimate of Year 2 Net Income __________<br />
____________________________<br />
Summary: How proposed net income, on average, ____________________________<br />
compares to similar firms (circle one)<br />
____________________________<br />
Below Average Average Above Average ____________________________<br />
Overall Financial Attractiveness of the Proposed Venture<br />
• The following factors are important in regard to the overall financial attractiveness<br />
of the proposed business.<br />
• Assess the strength of each factor in the following table.<br />
Overall Financial Attractiveness of Proposed Venture Assessment Tool<br />
1. Steady and rapid growth in<br />
sales during the first one to<br />
three years in a clearly<br />
defined target market<br />
2. High percentage of recurring<br />
income—meaning that once<br />
you win a client, the client<br />
will provide recurring<br />
sources of revenue<br />
3. Ability to forecast income<br />
and expenses with a<br />
reasonable degree of<br />
certainty<br />
4. Likelihood that internally<br />
generated funds will be<br />
available within two years<br />
to finance growth<br />
5. Availability of exit<br />
opportunity for investor<br />
if applicable<br />
Low Potential Moderate Potential High Potential<br />
Unlikely Moderately likely Highly likely<br />
Low Moderate Strong<br />
Weak Moderate Strong<br />
Unlikely Moderately likely Highly likely<br />
Unlikely to be<br />
unavailable<br />
May be available<br />
Likely to be<br />
available
CHAPTER 3 <strong>Feasibility</strong> <strong>Analysis</strong> 79 ■<br />
Conclusion (report finding for each area)<br />
A. Total startup cash needed<br />
B. Financial performance of similar businesses<br />
C. Financial feasibility (circle the correct response)<br />
Not Feasible Unsure Feasible<br />
D. Suggestions for improving financial feasibility<br />
OVERALL F EASIBILITY: SUMMARY AND C ONCLUSION<br />
Overall <strong>Feasibility</strong> of<br />
the Business Idea Based<br />
on Each Part<br />
Suggestions for Improving<br />
the <strong>Feasibility</strong><br />
Product/Market Not feasible ______________________________<br />
<strong>Feasibility</strong> Unsure ______________________________<br />
Feasible ______________________________<br />
Industry/Market<br />
<strong>Feasibility</strong><br />
Organizational<br />
<strong>Feasibility</strong><br />
Not feasible ______________________________<br />
Unsure ______________________________<br />
Feasible ______________________________<br />
Not feasible ______________________________<br />
Unsure ______________________________<br />
Feasible ______________________________<br />
Financial <strong>Feasibility</strong> Not feasible ______________________________<br />
Unsure ______________________________<br />
Feasible ______________________________<br />
Overall Assessment Not feasible ______________________________<br />
Unsure ______________________________<br />
Feasible ______________________________<br />
Conclusion—briefly summarize your justification for your overall assessment.


![[Productnaam] Marketingplan - Pearson](https://img.yumpu.com/26285712/1/190x132/productnaam-marketingplan-pearson.jpg?quality=85)