Controlling Indirect Selection under Healthcare Reform - Society of ...
Controlling Indirect Selection under Healthcare Reform - Society of ...
Controlling Indirect Selection under Healthcare Reform - Society of ...

Create successful ePaper yourself
Turn your PDF publications into a flip-book with our unique Google optimized e-Paper software.
Appendix 160<br />
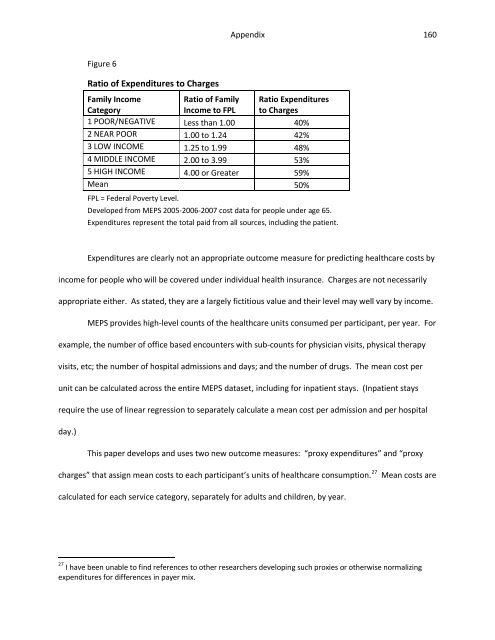
Figure 6<br />
Ratio <strong>of</strong> Expenditures to Charges<br />
Family Income<br />
Category<br />
Ratio <strong>of</strong> Family<br />
Income to FPL<br />
Ratio Expenditures<br />
to Charges<br />
1 POOR/NEGATIVE Less than 1.00 40%<br />
2 NEAR POOR 1.00 to 1.24 42%<br />
3 LOW INCOME 1.25 to 1.99 48%<br />
4 MIDDLE INCOME 2.00 to 3.99 53%<br />
5 HIGH INCOME 4.00 or Greater 59%<br />
Mean 50%<br />
FPL = Federal Poverty Level.<br />
Developed from MEPS 2005-2006-2007 cost data for people <strong>under</strong> age 65.<br />
Expenditures represent the total paid from all sources, including the patient.<br />
Expenditures are clearly not an appropriate outcome measure for predicting healthcare costs by<br />
income for people who will be covered <strong>under</strong> individual health insurance. Charges are not necessarily<br />
appropriate either. As stated, they are a largely fictitious value and their level may well vary by income.<br />
MEPS provides high-level counts <strong>of</strong> the healthcare units consumed per participant, per year. For<br />
example, the number <strong>of</strong> <strong>of</strong>fice based encounters with sub-counts for physician visits, physical therapy<br />
visits, etc; the number <strong>of</strong> hospital admissions and days; and the number <strong>of</strong> drugs. The mean cost per<br />
unit can be calculated across the entire MEPS dataset, including for inpatient stays. (Inpatient stays<br />
require the use <strong>of</strong> linear regression to separately calculate a mean cost per admission and per hospital<br />
day.)<br />
This paper develops and uses two new outcome measures: “proxy expenditures” and “proxy<br />
charges” that assign mean costs to each participant’s units <strong>of</strong> healthcare consumption. 27<br />
Mean costs are<br />
calculated for each service category, separately for adults and children, by year.<br />
27 I have been unable to find references to other researchers developing such proxies or otherwise normalizing<br />
expenditures for differences in payer mix.