- Page 1 and 2:
Controlling Indirect Selection unde
- Page 3 and 4:
iv ACKNOWLEDGEMENTS I am thankful f
- Page 5 and 6:
vi C. Regulatory Timing ...........
- Page 7 and 8:
viii 22. Profit = .................
- Page 9 and 10:
x MEPS P&C PBM PHI PPACA RA SES SOA
- Page 11 and 12:
I. INTRODUCTION Consultants from th
- Page 13 and 14:
3 This paper is meant to be a prime
- Page 15 and 16:
5 1970; Rothschild & Stiglitz, 1976
- Page 17 and 18:
7 the right side of the bar. With r
- Page 19 and 20:
9 limits choice for other high risk
- Page 21 and 22:
11 2. Process. Direct selection is
- Page 23 and 24:
13 just a department. This expansiv
- Page 25 and 26:
15 F. Consumers Demand Change Direc
- Page 27 and 28:
17 2. Risk adjustment (PPACA, Secti
- Page 29 and 30:
19 consumer selection. This section
- Page 31 and 32:
21 Whether the adjustment occurs vi
- Page 33 and 34:
23 risk. 43 Today’s risk adjustme
- Page 35 and 36:
25 Figure 8 Other Predictive Variab
- Page 37 and 38:
27 Genetics are also important. A d
- Page 39 and 40:
29 generally socially and economica
- Page 41 and 42:
31 of costs and very few have $50,0
- Page 43 and 44:
33 have no recent diagnoses or pres
- Page 45 and 46:
35 Unidentified Sick are unidentifi
- Page 47 and 48:
37 Figure 15 Demonstration: Financi
- Page 49 and 50:
39 The benefits of indirect selecti
- Page 51 and 52:
41 get insurance or gets it on less
- Page 53 and 54:
43 Assuming that at least some insu
- Page 55 and 56:
III. INDIRECT SELECTION UNDER HEALT
- Page 57 and 58:
47 insurers should use a Lifestyle
- Page 59 and 60:
49 Figure 19 Neighborhood-Level Dat
- Page 61 and 62:
51 This list of data elements align
- Page 63 and 64:
53 Consumer marketing databases pro
- Page 65 and 66:
55 Figure 23 New Business Predictiv
- Page 67 and 68:
57 diabetics while finding ways to
- Page 69 and 70:
59 risk insureds, “skimping” wi
- Page 71 and 72:
61 Figure 28 The model is consisten
- Page 73 and 74:
63 Insurers will rely upon predicti
- Page 75 and 76:
65 that they are related to the cha
- Page 77 and 78:
67 profitable and the second neighb
- Page 79 and 80:
69 relevant to insurers with a larg
- Page 81 and 82:
IV. PUBLIC POLICY CHALLENGES Indire
- Page 83 and 84:
73 will never be a clear line betwe
- Page 85 and 86:
75 healthcare cost variance outside
- Page 87 and 88:
77 to educate poor children. Althou
- Page 89 and 90:
79 Figure 30 Dynamic System: The ke
- Page 91 and 92:
81 regulators. If regulators don’
- Page 93 and 94:
83 regulatory front, while struggli
- Page 95 and 96:
85 in Chapter 3. The discussion wil
- Page 97 and 98:
87 1A: Include family income in ris
- Page 99 and 100:
89 example, assigning a risk premiu
- Page 101 and 102:
91 2. Market Entry Regulators desig
- Page 103 and 104:
93 2A: Individual insurance only fr
- Page 105 and 106:
95 “restricting choices”. It is
- Page 107 and 108:
97 adverse consumer selection. Whil
- Page 109 and 110:
99 3B: Fixed benefit designs. It is
- Page 111 and 112:
101 There is general consensus in t
- Page 113 and 114:
103 4D: Agent restrictions. At a mi
- Page 115 and 116:
105 Figure 35 Regulatory Options 5
- Page 117 and 118:
107 6. Post-Enrollment Consumer sel
- Page 119 and 120:
109 6E: Disenrollment per head pena
- Page 121 and 122:
111 While insurers cannot directly
- Page 123 and 124:
113 the insureds who have a diagnos
- Page 125 and 126:
115 E. Monitoring If regulations ar
- Page 127 and 128:
117 enrollment and disenrollment ra
- Page 129 and 130:
119 publicly discussed. Discussing
- Page 131 and 132:
121 Such a strategy is dependent up
- Page 133 and 134: REFERENCES AAA. (2009). Issue Brief
- Page 135 and 136: 125 Byrne, S. K. (2008). Healthcare
- Page 137 and 138: 127 Gallo, L. C., Penedo, F. J., Ex
- Page 139 and 140: 129 Lewin Group. (2010). Individual
- Page 141 and 142: 131 Riley, T. (2010). Reform has a
- Page 143 and 144: 133 van Barneveld, E., van Vliet, R
- Page 145 and 146: APPENDIX Health Insurance Risk Adju
- Page 147 and 148: Appendix 137 ABSTRACT The U.S. Pati
- Page 149 and 150: Appendix 139 BACKGROUND As expresse
- Page 151 and 152: Appendix 141 not eligible for subsi
- Page 153 and 154: Appendix 143 Starting in 2011 insur
- Page 155 and 156: Appendix 145 1) Current conditions
- Page 157 and 158: Appendix 147 First consider the lin
- Page 159 and 160: Appendix 149 counter this argument.
- Page 161 and 162: Appendix 151 Current Risk Adjustmen
- Page 163 and 164: Appendix 153 Model 4 fits the risk
- Page 165 and 166: Appendix 155 An examination of the
- Page 167 and 168: Appendix 157 ANALYSIS Data Descript
- Page 169 and 170: Appendix 159 Specifically, the anal
- Page 171 and 172: Appendix 161 Equation 1 Proxy Expen
- Page 173 and 174: Appendix 163 Expenditures have been
- Page 175 and 176: Appendix 165 Equation 3 Normalized
- Page 177 and 178: Appendix 167 The technical difficul
- Page 179 and 180: Appendix 169 prediction residuals?
- Page 181 and 182: Appendix 171 The lower income and h
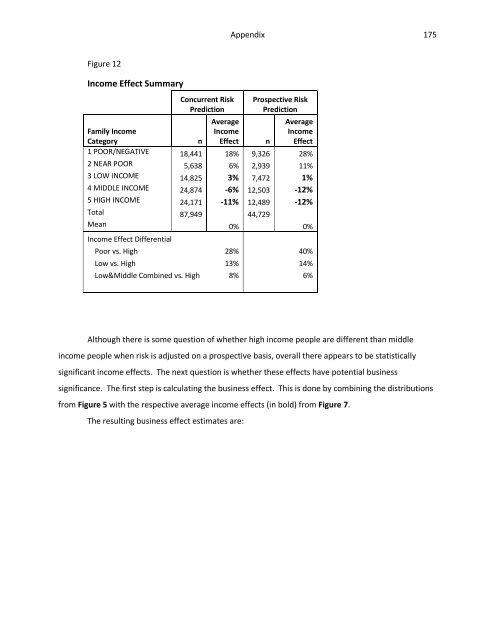
- Page 183: Appendix 173 RESULTS The results ar
- Page 187 and 188: Appendix 177 LIMITATIONS The analys
- Page 189 and 190: Appendix 179 Likewise, due to healt
- Page 191 and 192: Appendix 181 DISCUSSION Even with t
- Page 193 and 194: Appendix 183 Much of Jost’s timel
- Page 195 and 196: Appendix 185 RECOMMENDATIONS Based
- Page 197 and 198: Appendix 187 TABLES
- Page 199 and 200: Appendix 189
- Page 201 and 202: Appendix 191
- Page 203 and 204: Appendix 193 REFERENCES AAA. (2010)
- Page 205 and 206: Appendix 195 Diez Roux, A. A. (2001
- Page 207 and 208: Appendix 197 McKinsey & Company. (2
- Page 209 and 210: Appendix 199 WHO. (2005). Facing th
- Page 211 and 212: TIA GOSS SAWHNEY Vita 201 Directo
- Page 213 and 214: TIA GOSS SAWHNEY Vita 203 “Busine