
Create successful ePaper yourself
Turn your PDF publications into a flip-book with our unique Google optimized e-Paper software.
Contribution to Recurring EBIT (1)<br />
Belgian GAAP IFRS<br />
(amounts in € million) 1999 2000 2001 2002 2002 <strong>2003</strong><br />
Advanced Materials 11.0 25.4 31.5 20.9 17.6 37.3<br />
Synthetic Diamonds 11.6 8.0 5.4 10.1 13.8 12.8<br />
Copper 1.7 25.0 13.0 9.7 8.7 0.9<br />
Precious Metals Services (1.5) 30.6 50.3 52.5 53.2 45.7<br />
Precious Metals Products and Catalysts (2)<br />
- - - - - 42.9<br />
Zinc 84.0 85.8 50.7 16.5 17.8 28.4<br />
Corporate and Investments (18.4) (11.4) (16.8) (16.9) (13.6) (22.0)<br />
Total EBIT 88.4 163.4 134.1 92.8 97.5 145.9<br />
Including Group share in net profit (loss)<br />
from associates 15.8 13.5 13.0 15.1 13.0 18.0<br />
(1)<br />
New EBIT definition applied from 1999 – please see glossary of financial definitions<br />
(2)<br />
For five months of <strong>2003</strong> only (except Thin Film Products – 12 months)<br />
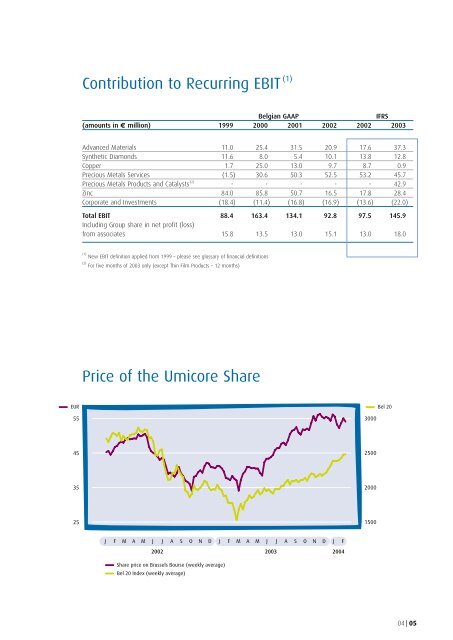
Price of the Umicore Share<br />
EUR Bel 20<br />
55<br />
45<br />
35<br />
25<br />
J F M A M J J A S O N D J F M A M J J A S O N D J F<br />
Share price on Brussels Bourse (weekly average)<br />
Bel 20 Index (weekly average)<br />
2002 <strong>2003</strong> 2004<br />
3000<br />
2500<br />
2000<br />
1500<br />
04 | 05