2012 Corporate Capabilities - Spectroscopy
2012 Corporate Capabilities - Spectroscopy
2012 Corporate Capabilities - Spectroscopy

Create successful ePaper yourself
Turn your PDF publications into a flip-book with our unique Google optimized e-Paper software.
Volume 26 Number 12 SPECTROSCOPY CORPORATE CAPABILITIES ISSUE December 2011<br />
December 2011 Volume 26 Number 12<br />
®<br />
www.spectroscopyonline.com<br />
<strong>2012</strong> <strong>Corporate</strong><br />
<strong>Capabilities</strong><br />
Online FT-IR <strong>Spectroscopy</strong><br />
for Characterizing Chemical<br />
Process Streams<br />
2011 Editorial Index<br />
Application Notes ♦ See page 93
You are<br />
confident<br />
In business and in the research lab, your confidence depends on accurate<br />
analysis from versatile, innovative instruments that improve productivity<br />
and enhance your knowledge. Thermo Scientific spectroscopy integrates<br />
proven technology with robust, simplified operation and software that<br />
removes ambiguity, making the technique more valuable than ever<br />
before. Whatever the future holds, you are confident.<br />
in every<br />
spectroscopic analysis<br />
• www.thermoscientific.com/confident<br />
Nicolet 6700 FT-IR Spectrometer<br />
Combines flexibility and certainty<br />
in FT-IR<br />
DXR Raman Microscope<br />
Gives actionable answers quickly<br />
and precisely<br />
© 2011 Thermo Fisher Scientific Inc. All rights reserved.<br />
Antaris II FT-NIR Analyzer<br />
Delivers laboratory performance on<br />
the production floor<br />
NanoDrop 2000 UV-Visible<br />
Fast and easy micro-volume<br />
measurements
Is AA dead?<br />
Are ICP/MIPS the future for QAQC analysis?<br />
ON-DEMAND WEBCAST:<br />
Register free at www.spectroscopyonline.com/AA<br />
EVENT OVERVIEW:<br />
Atomic Absorption (AA) has been a routine trace elemental<br />
analytical technique for over 50 years, and it<br />
is used extensively throughout the world. With the<br />
appearance of microwave induced plasma spectroscopy<br />
(MIPS) and lower priced optical inductively<br />
coupled plasma spectrometers (ICP-OES), has the day<br />
come when AA is ready to be replaced by faster analysis<br />
techniques?<br />
Key Learning Objectives:<br />
n Understand the cost base and<br />
comparative capabilities of AA, ICP, and<br />
Microwave Induced Plasma <strong>Spectroscopy</strong><br />
(MIPS)<br />
n Get insight into the future prospects for AA<br />
n Gain a greater degree of clarity about<br />
the analytical roadmap available for your<br />
laboratory following the introduction of<br />
MIPS into the market<br />
The web seminar will compare these three technique<br />
options in terms of their costs and their ability to<br />
address different types of samples. Thoughts on the<br />
future of trace elemental analysis in the short term<br />
(1-3 years) and beyond will also be presented. We will<br />
answer the big question: “What is the analysis roadmap<br />
for your laboratory?”<br />
Who Should Attend:<br />
n Current AA users<br />
n Laboratory personnel conducting trace<br />
elemental analysis<br />
n Laboratory managers with future<br />
requirements to do trace elemental<br />
analysis<br />
n Regulatory compliant enforcers<br />
n QA/QC analysts<br />
n Anyone interested in AA, ICP and MIPS<br />
Presented by<br />
Presenter:<br />
Adrian Holley<br />
Marketing Director,<br />
Trace Elemental Analysis<br />
Thermo Fisher Scientific<br />
Moderator:<br />
Laura Bush<br />
Editorial Director<br />
<strong>Spectroscopy</strong><br />
Sponsored by<br />
For questions contact Jamie Carpenter at jcarpenter@advanstar.com
te<br />
4 <strong>Spectroscopy</strong> 26(12) December 2011<br />
www.spectroscopyonline.com<br />
®<br />
®<br />
PUBLISHING & SALES<br />
485F US Highway One South, Suite 100, Iselin, NJ 08830<br />
(732) 596-0276, Fax: (732) 647-1235<br />
MANUSCRIPTS: To discuss possible article topics or obtain manuscript preparation<br />
guidelines, contact the editorial director at: (732) 346-3020, e-mail: lbush@advanstar.com.<br />
Publishers assume no responsibility for safety of artwork, photographs, or manuscripts.<br />
Every caution is taken to ensure accuracy, but publishers cannot accept responsibility for the<br />
information supplied herein or for any opinion expressed.<br />
SUBSCRIPTIONS: For subscription information: <strong>Spectroscopy</strong>, P.O. Box 6196, Duluth, MN<br />
55806-6196; (877) 527-7008, 7:00 a.m. to 6:00 p.m. CST. Outside the U.S., +1-218-740-6477.<br />
Delivery of <strong>Spectroscopy</strong> outside the U.S. is 3–14 days after printing. Single-copy price:<br />
U.S., $10.00 + $7.00 postage and handling ($17.00 total); Canada and Mexico, $12.00 + $7.00<br />
postage and handling ($19.00 total); Other international, $15.00 + $7.00 postage and handling<br />
($22.00 total).<br />
CHANGE OF ADDRESS: Send change of address to <strong>Spectroscopy</strong>, P.O. Box 6196, Duluth, MN<br />
55806-6196; provide old mailing label as well as new address; include ZIP or postal code.<br />
Allow 4–6 weeks for change. Alternately, go to the following URL for address changes or<br />
subscription renewal: https://advanstar.replycentral.com/?PID=581<br />
RETURN ALL UNDELIVERABLE CANADIAN ADDRESSES TO: Pitney Bowes, P.O. Box<br />
25542, London, ON N6C 6B2, CANADA. PUBLICATIONS MAIL AGREEMENT No.40612608.<br />
REPRINTS: Reprints of all articles in this issue and past issues are available<br />
(500 minimum). Call 800-290-5460, x100 or e-mail AdvanstarReprints@theYGSgroup.com.<br />
DIRECT LIST RENTAL: Contact Tamara Phillips, (440) 891-2773; e-mail: tphillips@<br />
advanstar.com<br />
INTERNATIONAL LICENSING: Maureen Cannon, (440) 891-2742,<br />
fax: (440) 891-2650; e-mail: mcannon@advanstar.com.<br />
Michael J. Tessalone<br />
Science Group Publisher, mtessalone@advanstar.com<br />
Edward Fantuzzi<br />
Publisher, efantuzzi@advanstar.com<br />
Stephanie Shaffer<br />
East Coast Sales Manager, sshaffer@advanstar.com<br />
(508) 481-5885<br />
EDITORIAL<br />
Laura Bush<br />
Editorial Director, lbush@advanstar.com<br />
Megan Evans<br />
Managing Editor, mevans@advanstar.com<br />
Stephen A. Brown<br />
Group Technical Editor, sbrown@advanstar.com<br />
Cindy Delonas<br />
Associate Editor, cdelonas@advanstar.com<br />
Dan Ward<br />
Art Director, dward@media.advanstar.com<br />
MARKETING<br />
Anne Young<br />
Marketing Manager, ayoung@advanstar.com<br />
MARKET DEvELOPMENT<br />
Tamara Phillips<br />
Direct List Rentals, tphillips@advanstar.com<br />
YGS Group<br />
Reprints, advanstarreprints@theYGSgroup.com<br />
Maureen Cannon<br />
Permissions, mcannon@advanstar.com<br />
50% Recycled Paper<br />
s10-20% Post Consumer Wa<br />
PRODUCTION AND AUDIENCE DEvELOPMENT<br />
David Erickson<br />
Production Manager, derickson@media.advanstar.com<br />
Peggy Olson<br />
Audience Development Manager, polson@advanstar.com<br />
Gail Mantay<br />
Audience Development Assistant Manager, gmantay@advanstar.com<br />
©2011 Advanstar Communications Inc. All rights reserved. No part of this publication may<br />
be reproduced or transmitted in any form or by any means, electronic or mechanical including<br />
by photocopy, recording, or information storage and retrieval without permission in writing<br />
from the publisher. Authorization to photocopy items for internal/educational or personal use,<br />
or the internal/educational or personal use of specific clients is granted by Advanstar Communications<br />
Inc. for libraries and other users registered with the Copyright Clearance Center, 222<br />
Rosewood Dr. Danvers, MA 01923, 978-750-8400 fax 978-646-8700 or visit http://www.<br />
copyright.com online. For uses beyond those listed above, please direct your written request<br />
to Permission Dept. fax 440-756-5255 or email: mcannon@advanstar.com.<br />
Advanstar Communications Inc. provides certain customer contact data (such as customers’<br />
names, addresses, phone numbers, and e-mail addresses) to third parties who wish to promote<br />
relevant products, services, and other opportunities that may be of interest to you. If you do not<br />
want Advanstar Communications Inc. to make your contact information available to third parties<br />
for marketing purposes, simply call toll-free 866-529-2922 between the hours of 7:30 a.m. and<br />
5 p.m. CST and a customer service representative will assist you in removing your name from<br />
Advanstar’s lists. Outside the U.S., please phone 218-740-6477.<br />
<strong>Spectroscopy</strong> does not verify any claims or other information appearing in any of the advertisements<br />
contained in the publication, and cannot take responsibility for any losses or other<br />
damages incurred by readers in reliance of such content.<br />
<strong>Spectroscopy</strong> welcomes unsolicited articles, manuscripts, photographs, illustrations and<br />
other materials but cannot be held responsible for their safekeeping or return.<br />
To subscribe, call toll-free 877-527-7008. Outside the U.S. call 218-740-6477.<br />
Advanstar Communications Inc. (www.advanstar.com) is a leading worldwide media company<br />
providing integrated marketing solutions for the Fashion, Life Sciences and Powersports<br />
industries. Advanstar serves business professionals and consumers in these industries with its<br />
portfolio of 91 events, 67 publications and directories, 150 electronic publications and Web<br />
sites, as well as educational and direct marketing products and services. Market leading brands<br />
and a commitment to delivering innovative, quality products and services enables Advanstar<br />
to “Connect Our Customers With Theirs.” Advanstar has approximately 1000 employees and<br />
currently operates from multiple offices in North America and Europe.<br />
Joseph Loggia<br />
President, Chief Executive Officer<br />
Theodore S. Alpert<br />
Executive Vice-President, Finance & Chief Financial Officer<br />
Tony Calanca<br />
Executive Vice-President, Exhibitions<br />
Georgiann DeCenzo<br />
Executive Vice-President, Licensing, Market Development & Europe<br />
Chris DeMoulin<br />
Executive Vice-President, Fashion & President MAGIC International<br />
Thomas Ehardt<br />
Executive Vice-President, Chief Administrative Officer<br />
Eric I. Lisman<br />
Executive Vice-President, <strong>Corporate</strong> Development<br />
Daniel Phillips<br />
Executive Vice-President, Powersports, Dental & Veterinary<br />
Andrew Pollard<br />
Executive Vice-President, Fashion & President, PROJECT<br />
Steve Sturm<br />
Executive Vice-President, Chief Marketing Officer<br />
Ron Wall<br />
Executive Vice-President, Pharmaceutical/Science & CBI<br />
Francis Heid<br />
Vice-President, Media Operations<br />
J vaughn<br />
Vice-President, Information Technology<br />
Mike Alic<br />
Vice-President, Electronic Media Group<br />
Nancy Nugent<br />
Vice-President, Human Resources<br />
Ward D. Hewins<br />
Vice-President, General Counsel<br />
David C. Esola<br />
Vice-President, General Manager<br />
Peter Houston<br />
Director of Content
DISTINCTLY<br />
BETTER<br />
MOLECULAR SPEC<br />
Agilent’s Cary portfolio is the molecular spectroscopy leader.<br />
Highest precision. Fastest performance. Best results. All thanks to a portfolio<br />
of UV-Vis-NIR, FTIR, and Fluorescence instruments that deliver reliable, precise,<br />
and reproducible results—fast. Our proven record of optical design excellence<br />
and innovation ensures you get the right answer every time. That’s leadership<br />
you can count on. That’s Distinctly Better.<br />
© Agilent Technologies, Inc. 2011<br />
To learn more about Agilent’s Cary Molecular <strong>Spectroscopy</strong> portfolio, visit<br />
www.agilent.com/chem/molecular
6 <strong>Spectroscopy</strong> 26(12) December 2011<br />
®<br />
CONTENTS<br />
Columns<br />
www.spectroscopyonline.com<br />
Volume 26 Number 12<br />
DECEMBER 2011<br />
December 2011<br />
Volume 26 Number 12<br />
THE BASELINE 10<br />
Maxwell’s Equations, Part IV<br />
A discussion of magnetism, leading into Maxwell’s second equation<br />
David W. Ball<br />
FOCUS ON QUALITY 14<br />
USP and the GAMP Guide on Laboratory<br />
Computerized Systems — Is Integration Possible?<br />
Here’s what needs to be done to harmonize these two documents.<br />
R.D. McDowall and C. Burgess<br />
Articles<br />
Temporary Online FT-IR <strong>Spectroscopy</strong> for Process 21<br />
Characterization in the Chemical Industry<br />
Case studies involving fouling and product quality illustrate the effective use of this method.<br />
Serena Stephenson, Lamar Dewald, Esteban Baquero, Wendy Flory, Liane Mikolajczyk, and J.D. Tate<br />
Cover image courtesy of<br />
Frederic Cirou/Getty Images.<br />
2011 Editorial Index 26<br />
<strong>Spectroscopy</strong> presents its annual index of authors and articles.<br />
ON THE WEB<br />
FREE WEB SEMINARS<br />
Is AA Dead? Or Is ICP/MIPS the Future<br />
for QA–QC Analysis?<br />
Adrian Holley, Thermo Fisher Scientific<br />
Raman <strong>Spectroscopy</strong> for<br />
Pharmaceutical Product Development<br />
and Manufacturing<br />
Dimuthu Jayawickrama, Senior Research<br />
Investigator, Bristol-Myers Squibb<br />
Raman <strong>Spectroscopy</strong> and Imaging<br />
in Biomedical Research<br />
Igor Chourpa, Professor of Analytical<br />
Chemistry, University of Tours (France)<br />
RF-GD-OES for Depth Profile Analysis:<br />
A Complementary Technique to SIMS<br />
Fuhe Li, Air Liquide–Balazs NanoAnalysis<br />
spectroscopyonline.com/webseminars<br />
INTERVIEW: MID-IR IMAGING<br />
In a new interview, Rohit Bhargava of the<br />
University of Illinois explains the theory of<br />
resolution in mid-IR imaging.<br />
spectroscopyonline.com/imagingtheory<br />
Join the<br />
<strong>Spectroscopy</strong> Group<br />
on LinkedIn<br />
Application Notes: Mass Spectrometry<br />
Simultaneous Qualitative and Quantitative Analysis of Buspirone 93<br />
and Its Metabolites with the Agilent 6550 iFunnel Q-TOF LC–MS System<br />
Yuqin Dai, Michael Flanagan, and Keith Waddell, Agilent Technologies, Inc.<br />
Application Notes: Molecular <strong>Spectroscopy</strong><br />
Long-Wavelength Dispersive 1064 nm Raman: 94<br />
In-Line Pharmaceutical Compound Identification<br />
Clare Dentinger, Steven Pullins, and Eric Bergles, BaySpec, Inc.<br />
Determination of Low Concentration Methanol in Alcohol by 95<br />
an Affordable High Sensitivity Raman Instrument<br />
Duyen Nguyen and Eric Wu, Enwave Optronics, Inc.<br />
Optical Compensation in Variable Angle Transmission 96<br />
Measurements of Thick Samples<br />
S. L. Berets, Harrick Scientific Products, and M. Milosevic, MeV Consulting<br />
Near Infrared <strong>Spectroscopy</strong> Is a Useful Tool 97<br />
in Photovoltaics Panel Development<br />
Rob Morris and Andrew Tatsch, Ocean Optics<br />
Mid-Infrared Reflectivity Measurements of Diffuse Materials 98<br />
Jenni L. Briggs, PIKE Technologies<br />
<strong>Spectroscopy</strong> (ISSN 0887-6703 [print], ISSN 1939-1900 [digital]) is published monthly by Advanstar Communications, Inc.,<br />
131 West First Street, Duluth, MN 55802-2065. <strong>Spectroscopy</strong> is distributed free of charge to users and specifiers of spectroscopic<br />
equipment in the United States. <strong>Spectroscopy</strong> is available on a paid subscription basis to nonqualified readers at the rate of:<br />
U.S. and possessions: 1 year (12 issues), $74.95; 2 years (24 issues), $134.50. Canada/Mexico: 1 year, $95; 2 years, $150. International:<br />
1 year (12 issues), $140; 2 years (24 issues), $250. Periodicals postage paid at Duluth, MN 55806 and at additional mailing<br />
offices. POSTMASTER: Send address changes to <strong>Spectroscopy</strong>, P.O. Box 6196, Duluth, MN 55806-6196. PUBLICATIONS MAIL<br />
AGREEMENT NO. 40612608, Return Undeliverable Canadian Addresses to: Pitney Bowes, P. O. Box 25542, London, ON N6C<br />
6B2, CANADA. Canadian GST number: R-124213133RT001. Printed in the U.S.A.
www.spectroscopyonline.com December 2011 26(12) <strong>Spectroscopy</strong> 7<br />
December 2011 Volume 26 Number 12<br />
<strong>2012</strong> <strong>Corporate</strong> <strong>Capabilities</strong><br />
36 1st Detect Corp.<br />
37 Agilent Technologies, Inc.<br />
38 ABB Analytical Measurements<br />
40 Amptek, Inc.<br />
42 Andor Technology<br />
43 Applied Photophysics<br />
44 Avantes, Inc.<br />
45 B&W Tek, Inc.<br />
46 Bruker Daltonics<br />
48 Bruker Corporation<br />
49 CVI Melles Griot<br />
50 EDAX, Inc.<br />
52 Edinburgh Instruments<br />
53 Energetiq Technology, Inc.<br />
54 Enwave Optronics, Inc.<br />
55 Hamamatsu Corporation<br />
56 Glass Expansion<br />
58 Harrick Scientific Products, Inc.<br />
59 Hellma USA, Inc.<br />
60 HORIBA Scientific<br />
61 International Centre for<br />
Diffraction Data<br />
62 Iridian Spectral Technologies Ltd.<br />
64 International Crystal<br />
Laboratories<br />
65 Meinhard<br />
66 Moxtek, Inc.<br />
68 Milestone Inc.<br />
69 Nippon Instruments<br />
North America<br />
70 Ocean Optics<br />
72 OI Analytical<br />
73 OptiGrate Corp.<br />
74 Optometrics Corporation<br />
75 Oriel Instruments<br />
76 Parker Hannifin Corporation<br />
Filtration and Separation Division<br />
77 Photonis USA<br />
78 PerkinElmer, Inc.<br />
80 PerkinElmer, Inc.<br />
82 PIKE Technologies<br />
84 Polymicro Technologies,<br />
A subsidiary of Molex Incorporated<br />
85 Rigaku Corporation<br />
86 Shimadzu Scientific Instruments<br />
88 SPEX CertiPrep<br />
89 Teledyne Leeman Labs<br />
90 Thermo Fisher Scientific<br />
91 Waters Corporation<br />
92 WITec GmbH
8 <strong>Spectroscopy</strong> 26(12) December 2011<br />
www.spectroscopyonline.com<br />
Editorial Advisory Board<br />
Ramon M. Barnes University of Massachusetts<br />
Paul N. Bourassa Unity Home Medical<br />
Deborah Bradshaw Consultant<br />
Kenneth L. Busch Wyvern Associates<br />
Ashok L. Cholli University of Massachusetts at Lowell<br />
David M. Coleman Wayne State University<br />
Bruce Hudson Syracuse University<br />
David Lankin University of Illinois at Chicago, College of Pharmacy<br />
Barbara S. Larsen DuPont Central Research and Development<br />
Ian R. Lewis Kaiser Optical Systems<br />
Jeffrey Hirsch Thermo Fisher Scientific<br />
Howard Mark Mark Electronics<br />
R.D. McDowall McDowall Consulting<br />
Gary McGeorge Bristol-Myers Squibb<br />
Linda Baine McGown Rensselaer Polytechnic Institute<br />
Robert G. Messerschmidt Rare Light, Inc.<br />
Francis M. Mirabella Jr. Mirabella Practical Consulting Solutions, Inc.<br />
John Monti Montgomery College<br />
Thomas M. Niemczyk University of New Mexico<br />
Anthony J. Nip CambridgeSoft Corp.<br />
John W. Olesik The Ohio State University<br />
Richard J. Saykally University of California, Berkeley<br />
Jerome Workman Jr. Unity Scientific<br />
Contributing Editors:<br />
Fran Adar Horiba Jobin Yvon<br />
David W. Ball Cleveland State University<br />
Kenneth L. Busch Wyvern Associates<br />
Howard Mark Mark Electronics<br />
Volker Thomsen Consultant<br />
Jerome Workman Jr. Unity Scientific<br />
Process Analysis Advisory Panel:<br />
James M. Brown Exxon Research and Engineering Company<br />
Bruce Buchanan Sensors-2-Information<br />
Lloyd W. Burgess CPAC, University of Washington<br />
James Rydzak Glaxo SmithKline<br />
Robert E. Sherman CIRCOR Instrumentation Technologies<br />
John Steichen DuPont Central Research and Development<br />
D. Warren Vidrine Vidrine Consulting<br />
European Regional Editors:<br />
John M. Chalmers VSConsulting, United Kingdom<br />
David A.C. Compton Industrial Chemicals Ltd.<br />
<strong>Spectroscopy</strong>’s Editorial Advisory Board is a group of distinguished individuals<br />
assembled to help the publication fulfill its editorial mission to promote the effective<br />
use of spectroscopic technology as a practical research and measurement tool.<br />
With recognized expertise in a wide range of technique and application areas, board<br />
members perform a range of functions, such as reviewing manuscripts, suggesting<br />
authors and topics for coverage, and providing the editor with general direction and<br />
feedback. We are indebted to these scientists for their contributions to the publication<br />
and to the spectroscopy community as a whole.<br />
Digital processors for<br />
X-ray & Nuclear <strong>Spectroscopy</strong><br />
Solving problems in:<br />
s X -ray analysis<br />
s N uclear Physics<br />
s N uclear Medicine<br />
s Synchrotron research<br />
s<br />
C ompatible with<br />
most detector types<br />
Optimized algorithms for<br />
* Single & Multi -channel <strong>Spectroscopy</strong><br />
* Timing-coincidence<br />
* Pulse shape analysis<br />
* Mapping<br />
* High counting rates<br />
X I A L L C<br />
31057 G enstar R d,<br />
H ayward, C A 94544<br />
T el: 510-401-5760<br />
www. xia.com sales@ xia.com
www.spectroscopyonline.com<br />
News Spectrum<br />
New Website for PIKE<br />
PIKE Technologies (Madison, Wisconsin) debuted a new<br />
company website, www.piketech.com in October. The company,<br />
which manufacturers sampling accessories for Fourier-transform<br />
infrared (FT-IR), near infrared, and ultraviolet–visible (UV–vis)<br />
spectrometers, offers a list of all PIKE products, information<br />
about spectroscopy theory and sampling techniques, multiple<br />
application notes, and other technology and industry-related<br />
details on its website.<br />
The PIKE home page provides an interactive infrared<br />
crystal properties chart and an FT-IR calculator for wavelength<br />
conversions, sample thickness, and average true range<br />
calculations. The website’s search function generates product<br />
information, and there is an online form available for order<br />
placement and quote requests.<br />
Sabine Becker Wins the <strong>2012</strong><br />
Winter Conference Award in<br />
Plasma Spectrochemistry<br />
J. Sabine Becker, the head of trace and ultratrace analysis in<br />
the Central Division of Analytical Chemistry at the Research<br />
Center Juelich, in Juelich, Germany, has won the <strong>2012</strong> Winter<br />
Conference Award in Plasma Spectrochemistry, sponsored by<br />
Thermo Fisher Scientific (San Jose, California). Thermo Fisher will<br />
present the award and a check for $5000 to Becker during the<br />
<strong>2012</strong> Winter Conference on Plasma Spectrochemistry, to be held<br />
in Tucson, Arizona, January 9–14, <strong>2012</strong>.<br />
December 2011 <strong>Spectroscopy</strong> 26(12) 9<br />
Becker’s career in analytical chemistry has focused<br />
on long-lived radionuclides, ultratrace and high-purity<br />
materials analysis, isotope ratio measurements, and<br />
micro- and nanolocal elemental and trace analyses.<br />
Recently she established BrainMet, an Analytical Center<br />
of Excellence at the Research Centre Juelich for brain<br />
research imaging. Based on laser ablation inductively<br />
coupled plasma mass spectrometry (LA-ICP-MS),<br />
BrainMet has introduced novel imaging techniques for<br />
metals, metalloids, and nonmetals in biological tissues.<br />
The approach provides quantitative mapping of essential<br />
and toxic elements in thin sections of diseased and<br />
healthy medical and biological tissue sections.<br />
The Winter Conference Award in Plasma Spectrochemistry,<br />
established in 2009, recognizes scientists who have<br />
made noteworthy contributions over time or through a<br />
single, significant breakthrough. The award acknowledges<br />
achievements in the conceptualization and development<br />
of novel instrumentation as well as the elucidation of<br />
fundamental events or processes involved in plasma<br />
spectrochemistry. Winners include authors of significant<br />
research papers or books that influence new advancements<br />
or pioneers of outstanding new applications that benefit the<br />
field of plasma spectrochemistry.<br />
Applications for the next Winter Plasma Award in 2014 may<br />
be submitted until December 31, <strong>2012</strong>. Further information is<br />
available at www.thermoscientific.com/wpcaward. ◾<br />
Market Profile: Microvolume UV–vis <strong>Spectroscopy</strong><br />
Microvolume UV–vis is a relatively new segment of<br />
the UV–vis spectroscopy market that has seen very<br />
rapid development. There are a variety of purpose-built<br />
microvolume instruments as well as adaptor accessories<br />
now on the market, most of which are designed for<br />
bioanalysis applications. Several major instrument<br />
vendors compete in the market, although Thermo<br />
Scientific still dominates.<br />
Microvolume UV–vis<br />
spectrophotometers can analyze<br />
sample sizes of under 5 μL, and<br />
in some cases, as small as 0.5<br />
μL. There are now a variety of<br />
microvolume UV–vis instruments<br />
on the market that are specifically<br />
designed for the analysis of such<br />
volumes. Vendors have also<br />
2011 microvolume UV–vis vendor share.<br />
developed a wide range of sampling accessories to allow<br />
for microvolume analysis using conventional UV–vis<br />
instruments. Microvolume spectroscopy was developed<br />
largely to address the needs of those performing<br />
bioanalysis, including the quantitation of DNA, RNA, and<br />
proteins. The conservation of samples is often a major<br />
issue for these end-users.<br />
7% 10% Shimadzu<br />
12%<br />
71%<br />
GE Life Sciences<br />
Other<br />
The market for microvolume UV–vis is expected to<br />
be near $80 million for 2011. Despite broad economic<br />
headwinds coming in <strong>2012</strong>, demand for microvolume<br />
UV–vis should continue to grow due to the expansion of<br />
the biotechnology and clinical analysis industries, as well as<br />
the continued adoption of the technique. Thermo Scientific,<br />
which acquired the first major developer of microvolume<br />
spectrophotometers, Nanodrop,<br />
is the strong leader in the market.<br />
Thermo Scientific<br />
Shimadzu and GE Healthcare are the<br />
other two major competitors. Several<br />
smaller vendors have since developed<br />
their own versions of dedicated<br />
microvolume instruments.<br />
The foregoing data were based<br />
on SDi’s market analysis and<br />
perspectives report entitled Global<br />
Assessment Report, 11th Edition: The Laboratory Life<br />
Science and Analytical Instrument Industry, October<br />
2010. For more information, contact Stuart Press, Vice<br />
President — Strategic Analysis, Strategic Directions<br />
International, Inc., 6242 Westchester Parkway, Suite 100,<br />
Los Angeles, CA 90045, (310) 641-4982, fax: (310)<br />
641-8851, www.strategic-directions.com.
10 <strong>Spectroscopy</strong> 26(12) December 2011 www.spectroscopyonline.com<br />
The Baseline<br />
Maxwell’s Equations, Part IV<br />
The fourth part of this series continues our explanation of Maxwell’s equations, the seminal classical<br />
explanation of electricity and magnetism (and, ultimately, light). For those of you new to the<br />
series, consider reading the last few appearances of this column to get caught up. Alternately, you<br />
can find past columns on our website: www.spectroscopyonline.com/The+Baseline+Column. Words<br />
of warning: For my own reasons, the figures are being numbered sequentially through this series,<br />
which is why the first figure in this column is Figure 26. Also, we’re going to get a bit mathematical.<br />
Unfortunately, that’s par for the course.<br />
David W. Ball<br />
Amagnet is any object that produces a magnetic<br />
field. That’s a rather circular definition (and<br />
saying such is a bit of a pun, when you understand<br />
Maxwell’s equations), but it is a functional one:<br />
A magnet is most simply defined by how it functions.<br />
Technically speaking, all matter is affected by magnets.<br />
It’s just that some objects are affected more than<br />
others and we tend to define magnetism in terms of<br />
the more obvious behavior. An object is magnetic if it<br />
attracts certain metals such as iron, nickel, or cobalt<br />
and if it attracts and repels (depending on its orientation)<br />
other magnets. The earliest magnets occurred<br />
naturally and were called lodestones, a name that<br />
apparently comes from the Middle English “leading<br />
stone,” suggesting an early recognition of the rock’s<br />
ability to point in a certain direction when suspended<br />
freely. By the way, lodestone is simply a magnetic<br />
form of magnetite, an ore whose name comes from<br />
the Magnesia region of Greece, which is itself a part of<br />
Thessaly in central eastern Greece bordering the Aegean<br />
Sea. Magnetite’s chemical formula is Fe 3<br />
O 4<br />
, and<br />
it is actually a mixed FeO–Fe 2<br />
O 3<br />
mineral. Magnetite<br />
itself is not uncommon, although the permanently<br />
magnetized form is, and how it becomes permanently<br />
magnetized is still an open question. (The chemists<br />
among us also recognize Magnesia as giving its name<br />
to the element magnesium. Ironically, the magnetic<br />
properties of Mg are about 1/5000 that of Fe.)<br />
Magnets work by setting up a magnetic field. What<br />
actually is a magnetic field? To be honest, I’m not<br />
sure I can really say, but its effects can be measured<br />
all around the magnet. It turns out that these effects<br />
exert forces that have magnitude and direction: That<br />
is, the magnetic field is a vector field. These forces are<br />
most easily demonstrated by objects that either have a<br />
magnetic field themselves or have an electrical charge<br />
on them, as the exerted force accelerates (changes<br />
the magnitude and direction of the velocity of) the<br />
charge. The magnetic field of a magnet is represented<br />
as B and, again, is a vector field. (The symbol H is also<br />
used to represent a magnetic field, although in some<br />
circumstances there are some subtle differences between<br />
the definition of the B field and the definition<br />
of the H field. Here, we will use B.)<br />
Faraday’s Lines of Force<br />
When Michael Faraday was investigating magnets<br />
starting in the early 1830s, he invented a description<br />
that was used to visualize magnets’ actions: lines of<br />
force. There is some disagreement whether Faraday<br />
thought of these lines as caused by the emanation<br />
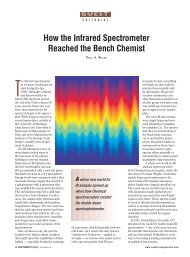
of discrete particles or not, but no matter. The lines
www.spectroscopyonline.com<br />
December 2011 <strong>Spectroscopy</strong> 26(12) 11<br />
of force are those things that are<br />
visualized when fine iron filings<br />
are sprinkled over a sheet of paper<br />
that is placed over a bar magnet,<br />
as shown in Figure 26. The filings<br />
show some distinct “lines”<br />
in which the iron pieces collect,<br />
although this is more of a physical<br />
effect than a representation of<br />
a magnetic field. There are several<br />
things that can be noted from the<br />
positions of the iron filings in<br />
Figure 26. First, the field seems to<br />
emanate from two points in the<br />
figure, where the iron filings are<br />
most concentrated. These points<br />
represent poles of the magnet. Second,<br />
the field lines exist not only<br />
between the poles, but arc above<br />
and below the poles in the plane of<br />
the figure. If this figure extended<br />
to infinity in any direction, you<br />
would still see evidence — albeit<br />
less and less as you proceed farther<br />
away from the magnet — of<br />
the magnetic field. Third, the<br />
strength of the field is indicated<br />
by the density of lines in any given<br />
space — the field is stronger near<br />
the poles and directly between the<br />
poles, and the field is weaker farther<br />
away from the poles. Finally,<br />
we note that the magnetic field is<br />
three-dimensional. Although most<br />
of the figure shows iron filings on a<br />
flat plane, around the two poles the<br />
iron filings are definitely out of the<br />
plane of the figure, pointing up.<br />
(The force of gravity is keeping the<br />
filings from piling too high, but the<br />
visual effect is obvious.) For the<br />
sake of convention, the lines are<br />
thought of as “coming out” of the<br />
north pole of a magnet and “going<br />
into” the south pole of the magnet,<br />
although in Figure 26 the poles are<br />
not labeled.<br />
Faraday was able to use the concept<br />
of lines of force to explain<br />
attraction and repulsion by two<br />
different magnets. He argued that<br />
when the lines of force from opposite<br />
poles of two magnets interacted,<br />
they joined together in<br />
such a way as to try to force the<br />
poles together, accounting for the<br />
attraction of opposites (Figure<br />
Figure 26: Photographic representation of magnetic lines of force. Here, a magnetic stir bar was<br />
placed under a sheet of paper and fine iron filings were carefully sprinkled onto the paper. While<br />
the concept of lines of force is a useful one, magnetic fields are continuous and are not broken<br />
down into discrete lines like pictured here. (Photo by author, with assistance from Dr. Royce W.<br />
Beal, Mr. Randy G. Ramsden, and Dr. James Rohrbough of the US Air Force Academy Department<br />
of Chemistry).<br />
(a)<br />
Figure 27: Faraday used the concept of magnetic lines of force to describe attraction and<br />
repulsion. (a) When opposite poles of two magnets interact, the lines of force combine to force<br />
the two poles together, causing attraction. (b) When like poles of two magnets interact, the lines<br />
of force resist each other, causing repulsion.<br />
27a). However, if lines of force<br />
from similar poles of two magnets<br />
interacted, they interfered with<br />
each other in such a way as to<br />
repel (Figure 27b). Thus, the lines<br />
of force were useful constructs to<br />
describe the known behavior of<br />
magnets.<br />
Faraday also could use the lines<br />
of force concept to explain why<br />
some materials were attracted by<br />
(b)<br />
magnets (paramagnetic materials<br />
or in their extreme form called<br />
ferromagnetic materials) or repelled<br />
by magnets (diamagnetic<br />
materials). Figure 28 illustrates<br />
that materials attracted by a magnetic<br />
field concentrate the lines<br />
of force inside the material, while<br />
materials repelled by a magnetic<br />
field exclude the lines of force<br />
from the material.
12 <strong>Spectroscopy</strong> 26(12) December 2011 www.spectroscopyonline.com<br />
(a)<br />
(b)<br />
(c)<br />
Magnetic lines<br />
of force<br />
Figure 28: Faraday used the lines of force concept to explain how<br />
objects behave in a magnetic field. (a) Most substances (like glass,<br />
water, or elemental bismuth) actually slightly repel a magnetic field;<br />
Faraday explained that they excluded the magnetic lines of force from<br />
themselves. (b) Some substances (like aluminum) are slightly attracted<br />
to a magnetic field; Faraday suggested that they include magnetic lines of<br />
force into themselves. (c) Some substances (like iron) are very strongly<br />
attracted to a magnetic field, including (according to Faraday) a large<br />
density of lines of force. Such materials can be turned into magnets<br />
themselves under the proper conditions.<br />
N<br />
Magnet<br />
Hypothetical “line of force”<br />
Figure 29: Hypothetical line of force about a magnet. Compare this to<br />
the photo in Figure 26.<br />
As useful as these descriptions were, Faraday was<br />
not a theorist. He was a very phenomenological scientist<br />
who mastered experiments, but had little mathematical<br />
training with which to model his results.<br />
Other scientists were able to do that, some of whom<br />
were based in Germany and France — but the important<br />
contributions came from other scientists in Faraday’s<br />
own Great Britain.<br />
S<br />
Maxwell’s Second Equation<br />
Two British scientists contributed to a better theoretical<br />
understanding of magnetism: William Thomson<br />
(also known as Lord Kelvin) and James Clerk Maxwell.<br />
However, it was Maxwell who did the more<br />
complete job.<br />
Maxwell was apparently impressed with the concept<br />
of Faraday’s lines of force. In fact, the series of four papers<br />
in which he described what later became Maxwell’s<br />
equations was titled “On Physical Lines of Force.” Maxwell<br />
was a very geometry-oriented person; he felt that<br />
the behavior of the natural universe could, at the very<br />
least, be represented by a drawing or picture.<br />
Let’s consider the lines of force pictured in Figure<br />
26. Figure 29 shows one ideal line of force for a<br />
bar magnet in two dimensions. Remember that this<br />
is a thought experiment — a magnetic field is not<br />
composed of individual lines; rather, it is a continuous<br />
vector field. And within a vector field, the field<br />
lines have some direction as well as magnitude. By<br />
convention, the magnetic field vectors are thought of<br />
as emerging from the north pole of the magnet and<br />
entering the south pole of the magnet. This vector<br />
scheme allows us to apply the right-hand rule when<br />
describing the effects of the magnetic field on other<br />
objects, like charged particles and other magnetic<br />
phenomena.<br />
Consider any box around the line of force. In Figure<br />
29, the box is shown by the dotted rectangle. What is<br />
the net change of the magnetic field through the box?<br />
By focusing on the single line of force drawn, we can<br />
conclude that the net change is zero: There is one line<br />
entering the box on its left side, and one line leaving<br />
the box on its right side. This is easily seen in Figure<br />
29 for one line of force and in two dimensions, but<br />
now let’s expand our mental picture to include all<br />
lines of force and all three dimensions. There will always<br />
be the same number of lines of force going into<br />
any arbitrary volume about the magnet as there are<br />
coming out. There is no net change in the magnetic<br />
field in any given volume. This concept holds no matter<br />
how strong the magnetic field and no matter what<br />
size the volume considered.<br />
How do we express this mathematically? Why, using<br />
vector calculus, of course. In the previous discussion<br />
of Maxwell’s first law, we introduced the divergence of<br />
a vector function F as<br />
divergence of F<br />
F y<br />
F x F z<br />
where F Fx i F y j F z k [1]<br />
x y z<br />
Note what the divergence really is; it is the change in<br />
the x-dimensional value of the function F across the x<br />
dimension, the change in the y-dimensional value of<br />
the function F across the y dimension, and the change<br />
in the z-dimensional value of the function F across<br />
the z dimension. However, we have already presented<br />
the argument from our lines of force illustration that<br />
the magnetic field coming in a volume equals the<br />
magnetic field going out of the volume, so that there<br />
is no net change. Thus, using B to represent our magnetic<br />
field:
www.spectroscopyonline.com<br />
December 2011 <strong>Spectroscopy</strong> 26(12) 13<br />
B x<br />
B y B z<br />
0<br />
[2]<br />
x y z<br />
That means that the divergence of<br />
B can be written as<br />
No<br />
S<br />
N<br />
div B<br />
B x<br />
B y B z<br />
0<br />
[3]<br />
x y z<br />
S<br />
N<br />
or simply<br />
Yes<br />
div B = 0 [4]<br />
S<br />
N<br />
S<br />
N<br />
This is Maxwell’s second equation<br />
of electromagnetism. It is sometimes<br />
called Gauss’s law for magnetism.<br />
Because we can also write the<br />
divergence as the dot product of<br />
the del operator (∇) with the vector<br />
field, Maxwell’s second equation<br />
becomes<br />
∇•B = 0 [5]<br />
What does Maxwell’s second<br />
equation mean? Because the divergence<br />
is an indicator of the<br />
presence of a source (a generator)<br />
or a sink (a destroyer) of a vector<br />
field, it implies that a magnetic<br />
field has no separate generator or<br />
destroyer points in any definable<br />
volume. Contrast this with an electric<br />
field. Electric fields are generated<br />
by two different particles,<br />
positively charged particles and<br />
negatively charged particles. By<br />
convention, electric fields begin at<br />
positive charges and end at negative<br />
charges. Because electric fields<br />
have explicit generators (positively<br />
charged particles) and destroyers<br />
(negatively charged particles), the<br />
divergence of an electric field is<br />
nonzero. Indeed, by Maxwell’s first<br />
equation, the divergence of an electric<br />
field E is<br />
E [6]<br />
which is zero only if the charge density,<br />
ρ, is zero — and if the charge<br />
density is not zero, then the divergence<br />
of the electric field also is not<br />
zero. Furthermore, the divergence<br />
can be positive or negative depending<br />
on whether the charge density is<br />
a source or a sink.<br />
Figure 30: If you break a magnet, you don’t get two separate magnetic poles (“monopoles,” top),<br />
but instead you get two magnets, each having north and south poles (bottom). This is consistent<br />
with Maxwell’s second law of electromagnetism.<br />
For magnetic fields, however, the<br />
divergence is exactly zero, which<br />
implies that there is no discrete<br />
source (“positive” magnetic particle)<br />
or sink (“negative” magnetic<br />
particle). One implication of that is<br />
that magnetic field sources are always<br />
dipoles; there is no such thing<br />
as a magnetic “monopole.” This<br />
mirrors our experience when we<br />
break a magnet in half, as shown in<br />
Figure 30. We don’t get two separated<br />
poles of the original magnet.<br />
Rather, we get two separate<br />
magnets, complete with north and<br />
south poles.<br />
In the next installment, we will<br />
continue our discussion of Maxwell’s<br />
equations and see how E and<br />
B are related to each other. The<br />
first two equations deal with E and<br />
B separately; we will see, however,<br />
that they are anything but separate.<br />
References<br />
(1) B. Baigrie, Electricity and Magnetism<br />
(Greenwood Press, Westport, Connecticut,<br />
2007).<br />
(2) O. Darrigol, Electrodynamics from<br />
Ampere to Einstein (Oxford University<br />
Press, 2000).<br />
(3) D. Halliday, R. Resnick, and J. Walker,<br />
Fundamentals of Physics 6th Ed. (John<br />
Wiley and Sons, New York, New York,<br />
2001).<br />
(4) E. Hecht, Physics (Brooks-Cole Publishing<br />
Co, Pacific Grove, California,<br />
1994).<br />
(5) J.E. Marsden and A.J. Tromba, Vector<br />
Calculus 2nd Ed. (W.H. Freeman and<br />
Company, 1981).<br />
(6) J.R. Reitz, F.J. Milford, and R.W.<br />
Christy, Foundations of Electromagnetic<br />
Theory (Addison-Wesley<br />
Publishing Company, Reading, Massachusetts,<br />
1979).<br />
(7) H.M. Schey, Div., Grad., Curl.,<br />
and All That: An Informal Text on<br />
Vector Calculus 4th Ed. (W.W.<br />
Norton and Company, New York,<br />
New York, 2005).<br />
David W. Ball is normally<br />
a professor of chemistry<br />
at Cleveland State<br />
University in Ohio. For a<br />
while, though, things will<br />
not be normal: starting<br />
in July 2011 and for the<br />
commencing academic<br />
year, David will be serving as Distinguished<br />
Visiting Professor at the United States Air<br />
Force Academy in Colorado Springs, Colorado,<br />
where he will be teaching chemistry to<br />
Air Force cadets. He still, however, has two<br />
books on spectroscopy available through<br />
SPIE Press, and just recently published two<br />
new textbooks with Flat World Knowledge.<br />
Despite his relocation, he still can be contacted<br />
at d.ball@csuohio.edu. And finally,<br />
while at USAFA he will still be working on<br />
this series, destined to become another<br />
book at an SPIE Press web page near you.<br />
For more information on<br />
this topic, please visit:<br />
www.spectroscopyonline.com/ball
14 <strong>Spectroscopy</strong> 26(12) December 2011 www.spectroscopyonline.com<br />
Focus on Quality<br />
USP and the<br />
GAMP Guide on Laboratory<br />
Computerized Systems — Is<br />
Integration Possible?<br />
The United States Pharmacopeia general chapter on analytical instrument qualification (USP<br />
) and the ISPE’s Good Automated Manufacturing Practice (GAMP) Good Practice Guide<br />
on laboratory computerized systems are the two main sources of guidance for qualifying analytical<br />
instruments and validating computerized systems used in the laboratory. This column<br />
explains the discrepancies between the two documents as well as changes now being made to<br />
both in an attempt to enable an integrated approach to qualification and validation of laboratory<br />
instruments and systems.<br />
R.D. McDowall and C. Burgess<br />
There are many sources of advice on computerized<br />
system validation and analytical instrument qualification<br />
for the laboratory, including regulatory<br />
agencies, such as the United States Food and Drug Administration<br />
(FDA) (1,2); regulatory associations such as<br />
the Pharmaceutical Inspection Convention/Co-operation<br />
Scheme (PIC/S) (3,4); the Official Medicines Control<br />
Laboratories (OMCL) in Europe (5); and pharmacopeias<br />
such as the United States Pharmacopeia (USP) (6). Information<br />
also can be obtained from scientific societies or<br />
associations such as the American Association of Pharmaceutical<br />
Scientists (AAPS) (7), the Parenteral Drug<br />
Association (PDA) (8), the Drug Information Association<br />
(DIA) (9), and the International Society of Pharmaceutical<br />
Engineering (ISPE) (10). All of these organizations<br />
have published guidance on instrument qualification or<br />
computer validation either for a general regulated audience<br />
or specifically for a regulated laboratory.<br />
There are two main sources, however, of regulatory<br />
guidance and advice for qualification of analytical instruments<br />
and validation of computerized systems used in<br />
the laboratory. The first is USP general chapter on<br />
analytical instrument qualification (AIQ) (6), which was<br />
derived from an AAPS meeting on analytical instrument<br />
validation held in 2003. One decision that came from that<br />
conference was that the terminology being used at the time<br />
was incorrect, because the conference name itself should<br />
have referred to analytical instrument qualification. The<br />
white paper published by AAPS in 2004 (7) was the major<br />
input to USP , which became effective in 2008.
www.spectroscopyonline.com<br />
December 2011 <strong>Spectroscopy</strong> 26(12) 15<br />
The second source for guidance in a<br />
regulated laboratory comes from ISPE’s<br />
Good Automated Manufacturing Practice<br />
(GAMP) Guide, which is seen by<br />
many as a standard for computerized<br />
system validation. After the publication<br />
of version 4 of this guide in 2001 (11),<br />
ISPE published several “good practice<br />
guides” (GPGs) on specific topics that<br />
were intended to take the principles of<br />
the version 4 guide and tailor them for<br />
a particular subject or focus area. The<br />
GAMP Good Practice Guide on the<br />
Validation of Laboratory Computerized<br />
Systems is one such guide that was published<br />
in 2005 (12).<br />
The major problem with analytical<br />
instruments that are used in a regulated<br />
laboratory is their great variety, complexity,<br />
and variations in intended use.<br />
Furthermore, the software associated<br />
with an instrument can vary from firmware<br />
in basic instruments to servers and<br />
workstations for multiuser networked<br />
data systems.<br />
Writing guidance for the qualification<br />
of this wide range of instrumentation<br />
and software is not easy, as<br />
qualification needs also depend on<br />
the intended use of the instrument<br />
or system. However, as we have both<br />
maintained for a number of years, only<br />
an integrated approach to instrument<br />
qualification and computer validation<br />
— focusing on the key elements that<br />
must be controlled in a single combined<br />
process — is efficient and effective<br />
(13–16). An integrated approach is not<br />
only beneficial from a regulatory and<br />
auditable context, but it also is cost effective<br />
for the business. This approach<br />
is in contrast to conducting an initial<br />
qualification of the instrument and<br />
a separate validation of the software,<br />
which is inefficient and may duplicate<br />
some work. Furthermore, because of<br />
organizational structures, instrument<br />
qualification may be carried out by<br />
the vendor and considerable time may<br />
elapse before the computer validation<br />
is conducted and the system is released<br />
into operational use.<br />
It would be highly advantageous if<br />
the regulations and guidance could all<br />
say similar things and avoid duplicate<br />
tasks. However, with the way the current<br />
versions of USP (6) and the<br />
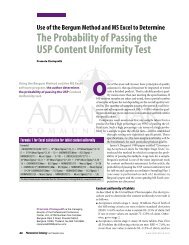
GAMP 5 & GPG<br />
software-driven<br />
approach<br />
Continuum of<br />
computerized<br />
laboratory<br />
systems<br />
USP <br />
instrument-driven<br />
approach<br />
Apparatus<br />
Group<br />
A<br />
1. Instruments<br />
with<br />
firmware<br />
2. Instruments<br />
with<br />
integral<br />
calculations<br />
Group<br />
B<br />
Figure 1: Mapping USP and GAMP software categories.<br />
GAMP laboratory systems GPG (12) are<br />
written, this is not possible, as we will<br />
illustrate now.<br />
Critique of the GAMP GPG<br />
Laboratory Guide<br />
In 2006, comments were made this column<br />
on the disconnection of the first<br />
edition of the GAMP GPG for validation<br />
of laboratory computerized systems<br />
from the rest of the regulated organization<br />
(13). The version of the GPG at that<br />
time had, from our perspective, the following<br />
issues:<br />
• The guide had an unnecessarily complex<br />
classification of laboratory computerized<br />
systems (13) that did not<br />
match the software-based classification<br />
in the main GAMP guide (17,18).<br />
• According to the GAMP GPG, everything<br />
required validation; there<br />
was no consideration of instrument<br />
qualification.<br />
• There was no linkage with USP<br />
on AIQ.<br />
• There was no reference to the seminal<br />
instrument qualification papers, such<br />
as the discussion of modular and holistic<br />
qualification approaches by Furman<br />
and colleagues (19).<br />
To be fair, the GAMP GPG embraced<br />
a simplified life cycle model that was<br />
a great advance compared to the traditional<br />
V model shown in GAMP 4.<br />
In 2008, GAMP 5 was released (10)<br />
and was an improvement to the previous<br />
version of the guide (11). The new<br />
GAMP 5 was more risk-based and<br />
introduced several life cycle models<br />
depending on the software category.<br />
However, the major problem with this<br />
new version of the GAMP guide was the<br />
removal of category 2 (firmware) from<br />
the categorization of software (17,18).<br />
Category<br />
3<br />
3. Instruments<br />
with<br />
user-defined<br />
programs<br />
4. Instruments<br />
with<br />
commercial<br />
non-config<br />
SW<br />
Group<br />
C<br />
5. Instruments<br />
with<br />
commercial<br />
config SW<br />
Category<br />
4<br />
6. Instruments<br />
with<br />
commercial<br />
config SW+<br />
macros<br />
Category<br />
5<br />
While understandable from a software<br />
system perspective, it is in direct conflict<br />
with USP , in which group B<br />
instruments are firmware-based (6).<br />
Critique of USP <br />
Two earlier “Focus on Quality” columns<br />
commented on USP (13,16). The<br />
classification of analytical equipment<br />
into one of three groups (A, B, and C)<br />
is a simple risk assessment, which is a<br />
good approach, but conflicts with the<br />
more complex GAMP laboratory GPG.<br />
Some of the other problems of <br />
are<br />
• It makes the vendor, rather than the<br />
user, responsible for design qualification<br />
and defining the intended purpose<br />
for a specific laboratory. This is<br />
wrong. Only users can be responsible<br />
for defining their requirements and<br />
selecting the instrument or system<br />
that is appropriate to meet their scientific,<br />
regulatory, and business needs.<br />
The role of a vendor’s specification is<br />
to sell instruments.<br />
• The true role of the vendor is missing<br />
from the data quality triangle in<br />
(16).<br />
• There are subcategories within group<br />
B (instruments) and group C (systems)<br />
that are not covered in the current<br />
version of . This can lead to<br />
noncompliance with 21 CFR 211.68(b)<br />
with regard to checking calculations<br />
embedded in some group B instruments<br />
(16).<br />
• There is no control or guidance in<br />
group B instruments for users to program<br />
routines.<br />
• There is poor software validation<br />
guidance for group C systems that<br />
could result in regulatory observations<br />
for a laboratory.
16 <strong>Spectroscopy</strong> 26(12) December 2011 www.spectroscopyonline.com<br />
No GXP<br />
impact<br />
Group A<br />
apparatus<br />
No qualification or<br />
validation impact<br />
However, qualification is<br />
good analytical science<br />
No qualification or<br />
validation impact<br />
So, where do we go from here?<br />
The next steps will take place on two<br />
fronts: first, a stimulus to the revision<br />
process paper for the update of USP<br />
(20); and second, the drafting of<br />
the second edition of the GAMP GPG<br />
on the validation of laboratory computerized<br />
systems (21), both of which<br />
are planned for publication in the first<br />
quarter of <strong>2012</strong>.<br />
Proposed<br />
risk<br />
assessment<br />
Group B<br />
instruments<br />
Group C<br />
systems<br />
I. Qualification<br />
II. Qualification<br />
and verification<br />
of calculations<br />
III. Qualification<br />
and control of<br />
user-defined<br />
programs<br />
I. Full validation<br />
no instrument<br />
qualification<br />
II. Reduced<br />
validation<br />
no instrument<br />
qualification<br />
III. Full validation<br />
and instrument<br />
qualification<br />
IV. Reduced<br />
validation<br />
and instrument<br />
qualification<br />
Figure 2: Classification of laboratory items under the proposed risk assessment.<br />
USP Stimulus to the<br />
Revision Process<br />
During the AAPS annual meeting in<br />
November 2010, we suggested to the<br />
USP that we write a stimulus to the revision<br />
process paper on . Our proposal<br />
was accepted and we began working<br />
on a draft of the paper, scheduled for<br />
publication in Pharmacopeial Forum in<br />
the January–February <strong>2012</strong> issue (20).<br />
The main aspects of our paper are described<br />
below.<br />
Software Is Important in Analytical<br />
Instrument Qualification<br />
Two key points are necessary for effective<br />
and efficient AIQ. The first is defining<br />
the intended purpose of an item<br />
of laboratory equipment. The second<br />
is identifying the software used in that<br />
equipment. Typically, this software is<br />
either firmware inside an instrument<br />
or on a separate PC running a software<br />
application for controlling the instrument,<br />
as well as acquiring, interpreting,<br />
reporting, and storing the data. Neither<br />
of these software elements is adequately<br />
covered in the current version of<br />
(16).<br />
• The reference to the FDA’s guidance<br />
General Principles of Software Validation<br />
(1) is inappropriate because the<br />
FDA guidance does not consider the<br />
software configuration that is common<br />
with laboratory computerized<br />
systems.<br />
Readers should note that all USP<br />
analytical general chapters will be undergoing<br />
revision between now and<br />
2015, with updates being published in<br />
Pharmacopeial Forum; this revision will<br />
be combined with efforts to harmonize<br />
with chapter with both the Japanese and<br />
European pharmacopeias. New general<br />
chapters will be published in pairs: The<br />
legal requirements will be in chapters<br />
numbered between and and<br />
the corresponding best practice will be<br />
in a general chapter numbered between<br />
and .<br />
AIQ and Computerized System<br />
Validation: Where Are We Now?<br />
With the current versions of USP<br />
and the GAMP GPG on laboratory<br />
computerized systems, if we ask the<br />
question, “Is integration possible?” the<br />
answer is a resounding no. Specifically,<br />
there is no effective and efficient link<br />
between USP , and the GAMP 5,<br />
or indeed the GAMP laboratory GPG.<br />
Mapping USP to GAMP 5<br />
Software Categories<br />
One of the first considerations for revising<br />
should be to close the gap in<br />
the approaches of GAMP 5 and <br />
to reach a unified approach to qualification<br />
and validation, which is shown in<br />
Figure 1. This figure shows our mapping<br />
of the current GAMP software categories<br />
against groups A, B, and<br />
C. Our contention is that there are subcategories<br />
within groups B and C that<br />
are not covered by the current version<br />
of but that should be there to<br />
ensure comprehensive regulatory guidance<br />
(16). It is important to realize that
www.spectroscopyonline.com<br />
December 2011 <strong>Spectroscopy</strong> 26(12) 17<br />
USP is driven by an instrument<br />
or hardware approach (classification<br />
into Groups A, B, and C). In contrast,<br />
the GAMP approach is software driven.<br />
When developing laboratory guidance,<br />
we have to consider both sides of the<br />
equation: hardware and software.<br />
Dropping GAMP software category<br />
2 requires category 3 to accommodate<br />
items ranging from simple analytical<br />
instruments with firmware to laboratory<br />
computerized systems with nonconfigurable<br />
commercial software.<br />
Potentially, we would require validating<br />
all group B instruments under<br />
GAMP rather than qualify them under<br />
. Because group A items do not<br />
contain software, there is no comparable<br />
mapping possible with GAMP<br />
5, but we have included this group in<br />
Figure 1 for completeness. We also<br />
have added GAMP software category<br />
5 under category 4 with it offset to<br />
the right in Figure 1 to show that with<br />
some category 4 systems it is possible<br />
to write user-defined macros.<br />
Comprehensive Risk<br />
Assessment Process<br />
The basic risk assessment model in<br />
is the classification of all laboratory<br />
items into one of the groups (A, B,<br />
or C) based on a definition of intended<br />
use. This approach is generally sound,<br />
because apparatus (group A), instruments<br />
(B), and systems (C) are easily<br />
classified. However, there is a weakness<br />
in that the level of granularity offered<br />
is insufficient to classify the variety of<br />
instruments (B) and systems (C) used<br />
in combination with software in the<br />
laboratory today. Figure 1 illustrates<br />
this point by depicting three subtypes<br />
within group B instruments (that is,<br />
firmware, firmware with calculations,<br />
and firmware with the ability for users<br />
to define programs).<br />
Therefore, our basic proposal in the<br />
stimulus to the revision process paper<br />
(20) is to provide better means of<br />
• unambiguously differentiating<br />
between apparatus (group A) and<br />
instruments (group B) based on functionality<br />
• linking the software elements with the<br />
various types of instrument (group B)<br />
and systems (group C), because current<br />
instrumentation is more complex<br />
that the simplistic use of groups A, B,<br />
and C. This will identify subgroups<br />
within groups B and C.<br />
• identifying items used in a regulated<br />
laboratory that are not GXP relevant,<br />
to exclude them from the qualification<br />
and validation process.<br />
We see this risk assessment as essential<br />
for determining the proper business<br />
and regulatory extent of qualification<br />
and validation for a specific instrument<br />
or system with a defined intended use. It<br />
also is a necessary requirement for complying<br />
with US good manufacturing<br />
practice (GMP) regulations, specifically<br />
21 CFR 21.68(b), which requires that<br />
calculations be checked if the instrument<br />
or system has calculations upon<br />
which the user relies (22). This requirement<br />
is not mentioned in the current<br />
version of .<br />
The risk assessment we propose is<br />
based on asking up to 16 closed questions<br />
(with only yes or no answers) that<br />
can classify an item in one of the four<br />
groups listed below and shown diagrammatically<br />
in Figure 2:<br />
1. No GXP impact of the instrument<br />
or system<br />
2. Group A (apparatus) — no formal<br />
qualification impact, only observation<br />
3. Group B (instruments)<br />
• Instrument only: qualification<br />
required (subcategory I)<br />
• Instrument with software:<br />
qualification required and<br />
calculations verified (subcategory<br />
II)<br />
• Instrument with software:<br />
qualification required plus<br />
control of user-defined<br />
programs (subcategory III)<br />
4. Group C (systems)<br />
• Full validation required but<br />
without instrument qualification<br />
(subcategory I)<br />
• Reduced validation required but<br />
without instrument qualification<br />
(subcategory II)<br />
• Full validation and instrument<br />
qualification required<br />
(subcategory III)<br />
• Reduced validation and instrument<br />
qualification required<br />
(subcategory IV).<br />
SAMPLE PREPARATION<br />
FOR ANALYTICAL<br />
EXCELLENCE!<br />
Jaw Crusher<br />
BB 200<br />
If you are looking for a<br />
complete line of products<br />
for sample preparation,<br />
look no further than RETSCH.<br />
Q Mills for all sample types<br />
Q Fast, reproducible results<br />
every time<br />
Q Wide variety of grinding tools<br />
Q German engineered for many<br />
years of reliable service<br />
Q Easy to use, clean and maintain<br />
Vibratory Disc Mill<br />
RS 200<br />
Planetary Ball Mill<br />
PM 100<br />
Pellet Press<br />
PP 40<br />
1-866-4-RETSCH
18 <strong>Spectroscopy</strong> 26(12) December 2011 www.spectroscopyonline.com<br />
Terminology Is Important<br />
You will notice that we talk in terms of<br />
apparatus, instruments, and systems for<br />
groups A, B, and C, respectively. This is<br />
deliberate and is based on the current<br />
definitions in , and also more accurately<br />
reflects the items found in these<br />
three groups rather than using the allencompassing<br />
term of analytical instruments.<br />
We also recommend that the use<br />
of the ambiguous term equipment be<br />
discontinued in the current context.<br />
4Qs Model Is Replaced by Risk-Based<br />
Qualification and Validation<br />
The 4Qs model of instrument qualification<br />
is confusing because there are two<br />
4Qs models, which we discuss in the<br />
stimulus to the revision process paper:<br />
one for instruments, outlined in ;<br />
and the second for computerized system<br />
validation (CSV), outlined in PDA<br />
Technical Report 32 (8). Also, the FDA<br />
does not use the terms installation qualification<br />
(IQ), operational qualification<br />
(OQ), or performance qualification (PQ)<br />
in the General Principles of Software<br />
Validation (1), as they explain in section<br />
3.1.3 of that document:<br />
While IQ/OQ/PQ terminology has served<br />
its purpose well and is one of many legitimate<br />
ways to organize software validation<br />
tasks at the user site, this terminology<br />
may not be well understood among many<br />
software professionals, and it is not used<br />
elsewhere in this document.<br />
Qualification terminology is also<br />
not well understood in the analytical<br />
laboratory because readers have to be<br />
aware of the context in which a specific<br />
term (qualification or validation)<br />
is used and although we use the same<br />
terms (IQ, OQ, and PQ) they mean<br />
different things depending on whether<br />
we are talking about qualification or<br />
validation (20).<br />
In contrast, both GAMP 5 (10) and<br />
the second edition of the laboratory<br />
GPG (21) use the term verification,<br />
which was adopted from the American<br />
Society for Testing and Materials<br />
(ASTM) Standard E2500 (23), which<br />
includes both the terms qualification<br />
and validation as well as the evergreen<br />
phrase “fit for intended use” throughout.<br />
ASTM E2500 defines verification<br />
as a systematic approach to verify that<br />
manufacturing systems, acting singly or<br />
in combination, are fit for intended use,<br />
have been properly installed, and are<br />
operating correctly. This is an umbrella<br />
term that encompasses all types of approaches<br />
to ensure that systems are fit<br />
for use in qualification, commissioning,<br />
and qualification, verification, system<br />
validation, or others (23).<br />
This definition can be compared to<br />
the one in ANSI –IEEE standard 610.1990<br />
(24), which defines verification as:<br />
1) The process of evaluating a system or<br />
component to determine whether the<br />
products of a given development phase<br />
satisfy the conditions imposed at the start<br />
of that phase; or (2) Formal proof of program<br />
correctness<br />
This Institute of Electrical and Electronics<br />
Engineers (IEEE) standard has<br />
been adopted as an American National<br />
Standards Institute (ANSI) standard.<br />
Therefore, use of the term is mandatory<br />
for all US government departments including<br />
the FDA. If we focus only on the<br />
first IEEE definition, this can be considered<br />
a subset of the ASTM definition<br />
of verification as follows: In software<br />
engineering, which is the context of<br />
IEEE 610, the deliverable or product of a<br />
lifecycle phase, say a functional specification,<br />
is verified against the input to it<br />
(for example, user requirements specification)<br />
to ensure that all requirements<br />
have been developed into software<br />
functions. This is a degree of rigor that<br />
is missing in many laboratory validation<br />
projects.<br />
GAMP Lab Systems Guide:<br />
Second Edition<br />
Since the release of version 5 of the<br />
GAMP guide (10), the 2005 version of<br />
the laboratory GPG has been out of step<br />
with the risk-based approach taken by<br />
the former publication. The GAMP<br />
forum made a decision to revise the<br />
document and publish a second edition<br />
of the GPG (21). A team led by Lorrie<br />
Schuessler of GlaxoSmithKline (GSK,<br />
King of Prussia, Pennsylvania), started<br />
the revision process of the GPG.<br />
Scope of the GPG Second Edition<br />
The remit of the GPG team was to revise,<br />
not reinvent, the document. One<br />
of the key areas was to align the second<br />
edition of the GPG with the terms and<br />
principles of GAMP 5. In doing this,<br />
there was a move from discrete laboratory<br />
computerized system categories<br />
to a risk-based approach, within which<br />
there was an increased emphasis on leveraging<br />
assessments and other services<br />
provided by instrument suppliers. The<br />
team also was tasked with providing<br />
ideas for efficiency in validation activities<br />
and harmonize with USP ,<br />
which was omitted from the first edition<br />
of the GPG.<br />
A draft of the proposed GPG was issued<br />
for public comment in March 2011<br />
and those comments were incorporated<br />
into the revision process. When the<br />
GPG team learned of our planned update<br />
to USP they proposed a collaboration<br />
to align and integrate the two<br />
approaches. We were happy to agree.<br />
We worked closely and openly with a<br />
core team, including Lorrie Schuessler,<br />
Mark Newton, and Paul Smith, to help<br />
draft, review, and revise appendixes to<br />
integrate as much as possible the GAMP<br />
GPG with our proposed update of<br />
(20,21).<br />
Changes in the Second Edition of<br />
the Laboratory Systems GPG<br />
A major change to the laboratory systems<br />
GPG will be the removal of the<br />
categories of laboratory computerized<br />
systems. Depending on your perspective<br />
they were either loved (what?!) or hated<br />
(we’re in this camp). In practice, however,<br />
both the wide range of instruments<br />
and systems as well as the great number<br />
of business processes supported made<br />
use of categories problematic. The same<br />
item could be in several different categories<br />
depending on how it was used in<br />
a particular laboratory — for example, a<br />
sonic bath used for dissolving solutions,<br />
for delivering quantitative sonic energy<br />
or temperature, or in a robot system.<br />
Thus, the wide ranges of use made<br />
single categories misleading and failed<br />
to effectively use the resources needed<br />
for validation. So, now the categories of<br />
laboratory computerized systems have<br />
been replaced with the relative terms<br />
simple, medium, and complex.<br />
The second edition of the GPG is<br />
nearly twice the size of the first edition,<br />
and the majority of the new content is
www.spectroscopyonline.com<br />
December 2011 <strong>Spectroscopy</strong> 26(12) 19<br />
contained in the appendixes (21). The<br />
first edition had only three appendixes,<br />
whereas the second edition has 12 appendixes<br />
to describe items in more<br />
detail. Furthermore, where a topic has<br />
been covered in sufficient detail in the<br />
main GAMP guide, the reader is referred<br />
to it.<br />
New Appendixes<br />
The appendixes of the second edition<br />
GPG are listed below:<br />
1. Comparison of USP and<br />
GAMP GPG<br />
2. Categories of Software<br />
3. System Description<br />
4. Application of EU Annex 11 to<br />
Computerized Lab Systems<br />
5. Data Integrity<br />
6. Definition of Electronic Records<br />
and Raw Data<br />
7. Activities for Simple Systems<br />
8. Activities for Medium Systems<br />
9. Networked Chromatography Data<br />
System with Automated HPLC<br />
Dissolution<br />
10. Instrument Interfacing Systems<br />
including LIMS and Electronic<br />
Notebooks<br />
11. Robotics Systems<br />
12. Supplier Documentation and<br />
Services<br />
From our point of view, Appendix 1<br />
is the most important because it brings<br />
together the two approaches in a single<br />
discussion. A good inclusion in the GPG<br />
are discussions on the latest regulatory<br />
requirements: Appendixes 4 and 6 address<br />
the impact of the new EU GMP<br />
regulations of Annex 11 (25) and Chapter<br />
4 (26), respectively. The increased<br />
emphasis by the regulatory agencies on<br />
data integrity also has been addressed,<br />
in Appendix 5, which helps laboratories<br />
meet the challenge of data integrity<br />
in an electronic environment. Validation<br />
activities for simple, medium, and<br />
complex systems are discussed in four<br />
of the appendixes. Finally, there also is<br />
a discussion of supplier documentation<br />
and services and how to leverage and<br />
use them.<br />
AIQ and CSV. Where Will We Be in<br />
the First Quarter of <strong>2012</strong>?<br />
The title of this column asked if integration<br />
of USP and the GAMP<br />
GPG for validation of laboratory computerized<br />
systems was possible. With<br />
the current versions of the two documents,<br />
this is not possible, because of<br />
the divergent approaches explained<br />
earlier.<br />
However, the first quarter of <strong>2012</strong><br />
brings the promise of integration,<br />
because both two publications will be<br />
updated at that time. Our stimulus<br />
to the revision process paper for USP<br />
will be published in Pharmacopeial<br />
Forum and will detail the risk<br />
assessment and the subdivision of<br />
Groups 1, 2, and 3 (20). The second<br />
edition of the GAMP GPG for the<br />
validation of laboratory computerized<br />
systems also will be published (21). In<br />
it, the categories will be eliminated<br />
and replaced with the GAMP software<br />
categories. Both documents have<br />
common elements and approaches,<br />
because the teams have collaborated<br />
to achieve this.<br />
So, back to the question posed in<br />
the title: Is integration possible between<br />
and the GAMP GPG?<br />
Yes, it is, and with the updates of<br />
these two documents, we are moving<br />
toward that ideal. However, life is not<br />
perfect, at least not yet. GAMP software<br />
category 2 needs to be reinstated<br />
for full alignment with Group<br />
B instruments and to allow more<br />
explicit flexibility in the laboratory<br />
computerized systems GPG. Qualification<br />
of laboratory instrumentation<br />
is not a term that is recognized by<br />
GAMP because they have decided to<br />
use verification instead, yet ISPE provides<br />
guidance documents on facility<br />
commissioning and qualification (27)<br />
— so where is the problem? The revision<br />
of USP also uses the term<br />
validation, which is avoided in the<br />
GPG. However, these differences are<br />
easily surmountable with intelligent<br />
interpretation and implementation of<br />
an integrated approach to AIQ and<br />
CSV in your analytical laboratory.<br />
In the future, we hope that we will<br />
have USP providing the regulatory<br />
overview of analytical instrument<br />
qualification and linking to the relevant<br />
requirement chapters of USP that contain<br />
the specific instrument parameters<br />
to qualify. The GAMP laboratory GPG<br />
could then provide guidance on how<br />
to achieve this as well as the validation<br />
of the software elements (from a single<br />
embedded calculation to the whole application<br />
or system) — a unified and<br />
integrated approach.<br />
If this occurs, then the pharmaceutical<br />
industry can meet the existing<br />
approach that ISO 17025 (28) states in<br />
section 5.5.2:<br />
Equipment and its software used for<br />
testing, calibration and sampling shall<br />
be capable of achieving the accuracy<br />
required…<br />
This implies an integrated approach<br />
to ensure that the analytical instrument<br />
and the associated software work,<br />
as specified for the intended purpose.<br />
Nothing more and nothing less.<br />
Acknowledgments<br />
The authors would like to thank the<br />
following parties for their contribution<br />
to developing the stimulus to the revision<br />
process, the second edition of the<br />
GAMP Laboratory GPG, and review of<br />
this column:<br />
• Horatio Pappa, USP<br />
• Members of the GAMP GPG for<br />
Validation of Laboratory Computerized<br />
Systems were Lorrie Schuessler<br />
(GlaxoSmithKline), Mark Newton<br />
(Eli Lilly & Co.), Paul Smith (Agilent<br />
Technologies), Carol Lee (JRF<br />
America), Christopher H. White<br />
(Eisai Inc.), Craig Johnson (Amgen<br />
Inc.), David Dube (Aveo Pharmaceuticals<br />
Inc.), Judy Samardelis<br />
(Qiagen), Karen Evans and Kiet<br />
Luong (GlaxoSmithKline), Markus<br />
Zeitz (Novartis Pharma AG), Peter<br />
Brandstetter (Acondis) Rachel Adler<br />
(Janssen Pharmaceutical), and<br />
Shelly Gutt (Covance Inc.).<br />
• Mark Newton, Paul Smith, Lorrie<br />
Schuessler, and Horatio Pappa for<br />
providing comments on the draft of<br />
this column.<br />
References<br />
(1) Guidance for Industry, General<br />
Principles of Software Validation,<br />
FDA (2002).<br />
(2) Guidance for Industry, Computerized<br />
Systems in Clinical Investigations,<br />
FDA (2007).
20 <strong>Spectroscopy</strong> 26(12) December 2011 www.spectroscopyonline.com<br />
(3) Pharmaceutical Inspection Convention and Co-operation<br />
Scheme (PIC/S), PIC/S PI-011 Computerized Systems<br />
in GXP Environments (2004).<br />
(4) http://www.edqm.eu/en/General-European-OMCL-<br />
Network-46.html. A document for HPLC qualification<br />
was updated in 2011: http://www.edqm.eu/medias/<br />
fichiers/UPDATED_Annex_1_Qualification_of_HPLC_<br />
Equipment.pdf.<br />
(5) Pharmaceutical Inspection Convention and Co-operation<br />
Scheme (PIC/S), Recommendations on Validation Master<br />
Plan, Installation and Operational Qualification, Non-<br />
Sterile Process Validation and Cleaning Validation, PI-<br />
006 (2001).<br />
(6) United States Pharmacopoeia (USP) Analytical<br />
Instrument Qualification.<br />
(7) American Association of Pharmaceutical Scientists<br />
(AAPS) Analytical Instrument Qualification white paper<br />
(2004).<br />
(8) Validation of Computer Related Systems, Technical Report<br />
18, Parenteral Drug Association (PDA) (1994).<br />
(9) Computerized Systems used in Non-Clinical Safety Assessment<br />
— Current Concepts in Validation and Compliance,<br />
Drug Information Association (2008).<br />
(10) Good Automated Manufacturing Practice (GAMP)<br />
Guideline Version 4, ISPE (2001).<br />
(11) Good Automated Manufacturing Practice (GAMP)<br />
Guideline Version 5, ISPE (2008).<br />
(12) GAMP Good Practice Guide on the Validation of Laboratory<br />
Computerized Systems, First Edition, ISPE (2005).<br />
(13) R.D. McDowall, <strong>Spectroscopy</strong> 21(4), 14–30 (2006).<br />
(14) R.D. McDowall, <strong>Spectroscopy</strong> 21(11), 18–23 (2006).<br />
(15) R.D. McDowall, <strong>Spectroscopy</strong> 21(11), 90–95 (2006).<br />
(16) R.D. McDowall, <strong>Spectroscopy</strong> 25(11), 24–29 (2010).<br />
(17) R.D. McDowall, <strong>Spectroscopy</strong> 24(6), 22–31 (2009).<br />
(18) R.D. McDowall, <strong>Spectroscopy</strong> 25(4), 22–31 (2010).<br />
(19) W. Furman, R. Tetzlaff, and T. Layloff, JOAC Int. 77,<br />
1314–1317 (1994).<br />
(20) C. Burgess and R.D. McDowall, Pharmaceutical Forum,<br />
scheduled for Jan-Feb issue in press <strong>2012</strong>.<br />
(21) GAMP Good Practice Guide on the Validation of Laboratory<br />
Computerised Systems, Second Edition, ISPE, in press,<br />
scheduled for publication Q1 <strong>2012</strong>.<br />
(22) US GMP 21 CFR 211.68(b).<br />
(23) ASTM Standard 2500, Standard Guide for Specification,<br />
Design, and Verification of Pharmaceutical and Biopharmaceutical<br />
Manufacturing Systems and Equipment,<br />
American Society for Testing and Materials (2007).<br />
(24) IEEE Standard 610.1990 and American National Standard,<br />
Glossary of Software Engineering Terminology,<br />
IEEE Piscataway (1990).<br />
(25) EU GMP Annex 11 on Computerized Systems (2011)<br />
(26) EU GMP Chapter 4 Documentation (2011).<br />
(27) ISPE Good Practice Guide: Applied Risk Management for<br />
Commissioning and Qualification, ISPE (2011).<br />
(28) ISO 17025, General Requirements for the Competence<br />
of Testing and Calibration Laboratories, ISO, Geneva<br />
(2005).<br />
Chris Burgess has more than 36 years<br />
of experience in the pharmaceutical industry,<br />
primarily with Glaxo in quality assurance<br />
and analytical R&D. He is a qualified<br />
person under EU GMP and a member<br />
of the United States Pharmacopoeia’s<br />
Council of Experts 2010–2015. He also<br />
is a visiting professor of the University<br />
of Strathclyde’s School of Pharmacy and<br />
Biomedical Sciences in Glasgow, Scotland.<br />
R.D. McDowall is the principal of<br />
McDowall Consulting and director of R.D.<br />
McDowall Limited, and the editor of<br />
the “Questions of Quality” column for<br />
LCGC Europe, <strong>Spectroscopy</strong>’s sister magazine.<br />
Direct correspondence to: spectroscopyedit@advanstar.com<br />
For more information on this topic, please visit:<br />
www.spectroscopyonline.com/mcdowall
www.spectroscopyonline.com<br />
December 2011 <strong>Spectroscopy</strong> 26(12) 21<br />
Temporary Online FT-IR<br />
<strong>Spectroscopy</strong> for Process<br />
Characterization in the<br />
Chemical Industry<br />
The focus of this paper will be on the use of temporary online Fourier-transform infrared<br />
(FT-IR) spectroscopy in the chemical industry including two case-study applications involving<br />
fouling and product quality. These case studies will be followed by a discussion of the use of<br />
temporary online FT-IR analysis enabling process optimization.<br />
Serena Stephenson, Lamar Dewald, Esteban Baquero, Wendy Flory, Liane Mikolajczyk,<br />
and J.D. Tate<br />
The Dow Chemical Company (Midland, Michigan)<br />
is the world’s largest integrated chemical company<br />
utilizing a wide variety of unique chemistries in<br />
the production of both basic and specialty chemicals.<br />
The diversity of chemical processes and the interrelationships<br />
of production facilities in the integrated chemical<br />
complex provide significant opportunities for process<br />
optimization. Fouling, corrosion, plugging, or out-ofspecification<br />
product occurrences in one manufacturing<br />
plant can have negative effects on the operation of one<br />
or more downstream facilities. Accurate and representative<br />
data for process characterization is a key factor in<br />
making informed decisions regarding the resolution of<br />
process problems. The information-rich nature of optical<br />
spectroscopy and, in particular, Fourier-transform infrared<br />
(FT-IR) spectroscopy is uniquely suited for rapid and<br />
continuous online process characterization.<br />
Sometimes grab samples of the process that are analyzed<br />
in the laboratory provide sufficient data for process<br />
characterization. However, the nature of a process<br />
stream frequently makes collecting representative grab<br />
samples difficult. Gas-phase samples, reactive samples,<br />
and samples under elevated (or depressed) temperature<br />
or pressure are a few examples of samples that are particularly<br />
difficult to collect and analyze by laboratory<br />
analysis. Streams where trace (for example, low parts per<br />
million) levels of water or carbon dioxide are the analytes<br />
of interest are also a particular challenge for grab<br />
sample laboratory analysis because concentration levels<br />
are easily influenced by atmospheric composition. Safety<br />
issues must also be considered when collecting samples<br />
of highly toxic or explosive materials such as phosgene,<br />
acrylates, ethylene oxide, hydrogen chloride, or isocyanates.<br />
Depending on the duration and extent of required<br />
toxic material analyses, properly designed continuous<br />
online analysis can help mitigate associated safety issues.<br />
Additionally, when the process event of interest is<br />
transient occurring over a short time-frame, occurring<br />
at unknown intervals, or if the process is not at steadystate,<br />
a continuous online analysis of a representative<br />
sample provides a richness of insight into the process<br />
that would not be achievable by the infrequent glimpses<br />
into the process that is attainable by grab sample analysis.<br />
Lastly, continuous analyses are an invaluable tool<br />
during new process development and process scale-up<br />
due to the ability to thoroughly characterize the process.<br />
Of the available analytical tools for temporary online<br />
process characterization, FT-IR is among the most powerful.<br />
FT-IR is a fast technique providing fundamental<br />
vibrational information for the components in the stream<br />
and allowing the capture and retention of informationrich<br />
spectra. The raw data obtained from FT-IR are often
22 <strong>Spectroscopy</strong> 26(12) December 2011 www.spectroscopyonline.com<br />
Figure 1: Temporary setup of FT-IR analyzer<br />
for analysis of the ethylene stream in case<br />
study 1 for use with attended operation only.<br />
Figure 2: Temporary setup of FT-IR analyzer<br />
in case study 2 for continuous 24/7 data<br />
collection.<br />
referred to as “traceable” because<br />
analysts can refer to primary and<br />
secondary standards corresponding<br />
to the spectral information from<br />
the process sample. Analysts may<br />
also examine the raw spectral data<br />
for interferences that have not been<br />
present previously or do not match<br />
the anticipated stream composition.<br />
A variety of chemometric modeling<br />
techniques (1) are available to obtain<br />
quantitative information, trending<br />
information, or simple qualitative<br />
stream composition analysis from<br />
the raw spectra depending on the<br />
purpose and requirements of the<br />
particular application.<br />
The insights and data obtained<br />
from continuous online FT-IR can be<br />
applied to optimize process control<br />
models, validate the consistency of<br />
production quality, or inform development<br />
of robust and reliable permanent<br />
process analyzer applications.<br />
The following case studies focus on<br />
process control optimization and<br />
product quality.<br />
Experimental<br />
Before discussing case studies it will<br />
be useful to highlight a few basic<br />
considerations for installing a FT-IR<br />
system in a process environment. Of<br />
course, spectrometer setup, operation,<br />
and data processing must be<br />
appropriately specified for a given<br />
application, but unless the sample is<br />
reliably and safely delivered to the<br />
spectrometer the analysis details are<br />
mute. Process analyzer installation<br />
and methods can be complex (2), but<br />
two major design considerations for<br />
temporary analysis are safety and<br />
sample system design. The first to<br />
consider is safety. Although some<br />
safety concerns associated with handling<br />
samples for laboratory analysis<br />
are mitigated by using a process<br />
analyzer and eliminating routine<br />
grab sampling, a distinct set of other<br />
safety related hazards must be addressed.<br />
Of primary concern is assuring<br />
area classifications are met to<br />
mitigate explosion or exposure risks.<br />
In the first case study, the stream was<br />
comprised mostly of ethylene and the<br />
area classification issue was of critical<br />
importance. Because the FT-IR<br />
system that was used was not classified<br />
for a Class 1 Division 2 area,<br />
operating procedures were developed<br />
designating attended operation with<br />
appropriate area lower explosion<br />
limit (LEL) monitoring and emergency<br />
shutdown plans should the<br />
LEL monitor indicate the presence<br />
of a flammable atmosphere. A picture<br />
of the field setup of the analyzer<br />
is shown in Figure 1. On days when<br />
there was a threat of rain, a canopy<br />
was placed over the whole system.<br />
The preferred option would have<br />
been to package the spectrometer in<br />
a z-purged analyzer enclosure. Cost<br />
and timing constraints prevented the<br />
preferred path of C1D2 packaging for<br />
the analyzer in the ethylene analysis<br />
case study. Figure 2 shows the analyzer<br />
packaged for the product quality<br />
case study where the analyzer was<br />
installed in the field and operating<br />
under nonattended operation 24/7.<br />
In the product quality case study, the<br />
location was a nonclassified area, but<br />
the stream composition was highly<br />
toxic and corrosive. The analyzer<br />
enclosure was exposed to the elements<br />
and vortex coolers were used<br />
to control the temperature inside<br />
the enclosure.<br />
The second set of design considerations<br />
revolve around sample systems<br />
and sample handling panels.<br />
Having a continuous online analysis<br />
is not useful if the analyzer is not<br />
provided with a consistent and representative<br />
process sample for analysis.<br />
Sample systems are an integral<br />
part of the success or failure of a process<br />
analytical system (3). FT-IR and<br />
spectroscopic techniques in general<br />
demand much simpler sample systems<br />
than required by typical process<br />
gas chromatography systems,<br />
but fundamentals such as flow and<br />
pressure as well as avoiding condensation,<br />
particulates, and plugging<br />
are still essential. Key methods for<br />
liquid- and gas-phase sample systems<br />
for FT-IR implementation are different.<br />
Here, the focus is on gas-phase<br />
FT-IR as this technique has repeatedly<br />
been demonstrated to meet the<br />
temporary online stream characterization<br />
requirements in a variety of<br />
Dow processes. When it comes to liquid-phase<br />
analysis, attenuated total<br />
reflectance (ATR) FT-IR techniques<br />
are occasionally used, but probe<br />
fouling and lack of ability to monitor<br />
trace levels can be limiting and<br />
the use of a near-infrared or Raman<br />
system may be preferable. For gasphase<br />
process streams, long-pathlength<br />
FT-IR analysis is a workhorse<br />
for stream characterization. The<br />
two systems that were used in the<br />
case studies discussed below are the<br />
MKS 2032 MultiGas FT-IR system<br />
(MKS Instruments, Andover, Massachusetts)<br />
and the Gasmet DX4000
www.spectroscopyonline.com<br />
December 2011 <strong>Spectroscopy</strong> 26(12) 23<br />
FT-IR system (Gasmet Technologies<br />
Oy, Finland). Other FT-IR systems<br />
could also be utilized, but portability<br />
and 24/7 continuous data acquisition<br />
are key requirements.<br />
Case Study — Fouling<br />
The first case study is an application<br />
in a plant trying to solve<br />
plugging and fouling events that<br />
have been occurring regularly<br />
over multiple years. The stream<br />
was primarily ethylene with other<br />
C 2<br />
–C 8<br />
hydrocarbons and unknown<br />
low levels of acrylic acid monomer,<br />
water, and other small organics<br />
thought to be present in concentrations<br />
less than 1 mol%. It was<br />
known that the substance plugging<br />
the equipment at the facility was<br />
polyacrylic acid polymer and that<br />
minimizing the presence of acrylic<br />
acid and water in the stream would<br />
minimize the fouling. Several process<br />
control changes had been tried<br />
throughout the years, based purely<br />
on Aspen process models (Aspen<br />
Abs Arb<br />
(a)<br />
2<br />
0<br />
(b)<br />
2<br />
(c)<br />
0<br />
2<br />
0<br />
(d)<br />
2<br />
0<br />
4000<br />
3000<br />
Technology, Inc., Burlington, Massachusetts),<br />
but the plugging issues<br />
persisted. The unknown was how<br />
various process operating conditions<br />
in surrounding portions of the<br />
Wavenumber (cm -1 )<br />
2000<br />
Figure 3: Spectra of (a) 100% ethylene, (b) 500 ppm water, and (c) 932 ppm acrylic acid, and<br />
(d) a process spectrum at 150 °C and 1 atm with a 5.11-m pathlength at 0.5-cm -1 resolution and<br />
a 1-min collection time.<br />
plant impacted the residual levels of<br />
acrylic acid and water in the region<br />
where fouling occurred. Attempts<br />
to validate the assumptions used for<br />
the process models using aluminum
24 <strong>Spectroscopy</strong> 26(12) December 2011 www.spectroscopyonline.com<br />
Concentration (ppm)<br />
Arbitrary units<br />
-0.00<br />
2500<br />
4500<br />
4000<br />
3500<br />
3000<br />
2500<br />
2000<br />
1500<br />
1000<br />
500<br />
0<br />
Acrylic acid trial A<br />
Acrylic acid trial B<br />
Water trial A<br />
Water trial B<br />
CO<br />
2500 2400 2300 2200 2100 2000 1900<br />
oxide moisture measurements failed<br />
because the aluminum oxide moisture<br />
analyses used were infrequent,<br />
slow to equilibrate, suffered from<br />
calibration drift because of stream<br />
components fouling the sensor, and<br />
were not reproducible. Additionally,<br />
the aluminum oxide sensor only<br />
provided data on the moisture component,<br />
not the acrylic acid concentration<br />
or any of the other hydrocarbons<br />
or organics that were suspected<br />
to be present.<br />
Time--><br />
Figure 4: Acrylic acid and water trends during two different process trials showing significant<br />
impact on the water concentrations between the two sets of process conditions.<br />
Wavenumber (cm -1 )<br />
DCI<br />
2400 2300 2200 2100 2000 1900<br />
Figure 5: Process spectra containing DCl and some CO 2<br />
compared to reference spectra of CO at<br />
both 8-cm -1 and 1-cm -1 resolution.<br />
To achieve a fast response, quantitative<br />
results, low detection limits,<br />
and multicomponent analysis, a<br />
long-path FT-IR was installed at the<br />
process location with a sample line<br />
comprising 50 ft of ¼-in. diameter<br />
heat traced tubing to minimize condensation<br />
or changes in the sample<br />
between the process pipe and the<br />
analyzer. The process sample was<br />
returned to the plant’s vacuum vent<br />
line. This process drop allowed<br />
for continuous flow at the rate of<br />
~2–3 L/min and a constant pressure<br />
in the FT-IR sample cell. The sample<br />
cell pathlength was 5.11 m and 0.5<br />
cm -1 spectral resolution was used.<br />
Figure 3 shows an example spectrum<br />
of 100% ethylene as well as<br />
water and acrylic acid in the concentration<br />
range of interest. Figure<br />
3 also provides a process spectrum<br />
clearly indicating that both water<br />
and acrylic acid are present in the<br />
process ethylene. A total of six components<br />
were monitored in the ethylene<br />
process stream, including the<br />
water and acrylic acid.<br />
A spectral data point was collected<br />
every minute to capture process fluctuations.<br />
A designed set of experiments<br />
was implemented that systematically<br />
changed the plant’s operating<br />
conditions within acceptable ranges<br />
while levels of acrylic acid and water,<br />
among other components, were monitored.<br />
Figure 4 includes process<br />
trend comparisons between just two<br />
of the process condition experiments<br />
showing a better than threefold difference<br />
in water concentration while<br />
having negligible effects on acrylic<br />
acid levels. The fluctuations within<br />
each of the given trials also correlated<br />
with specific process parameters<br />
and provided insight into process<br />
stability. Other tested process<br />
conditions demonstrated decreases<br />
in residual acrylic acid.<br />
The key information learned from<br />
continuous FT-IR data of acrylic acid<br />
and water, as well as the other components,<br />
in comparison with known<br />
process control parameters was identification<br />
of specific process parameters<br />
that enabled reduction in acrylic<br />
acid and water without adversely affecting<br />
quality or other process operations.<br />
The analytical results were<br />
used to optimize the process control<br />
model based on Aspen simulations.<br />
The new process model was implemented<br />
in the plant for control. Before<br />
implementation of the model,<br />
fouling occurred every 1–2 months<br />
causing 2–3 days of downtime per incident.<br />
Since implementation of the<br />
model more than 1 year ago there has<br />
not been a shutdown caused by the<br />
fouling problem. This case study is
www.spectroscopyonline.com<br />
December 2011 <strong>Spectroscopy</strong> 26(12) 25<br />
an excellent example of FT-IR spectroscopy<br />
being used for continuous<br />
online analysis to improve process<br />
operation by providing real-time<br />
data for process correlation. The<br />
plant’s issue was solved without investment<br />
in installation and maintenance<br />
of a permanent FT-IR (or any<br />
other) process analyzer.<br />
Case Study — Product Quality<br />
A second case study, in which gas<br />
phase FT-IR was applied to characterize<br />
a process, was for the purpose<br />
of product quality optimization.<br />
In this case, the goal was product<br />
purity. The stream was very simple<br />
with a single component being<br />
greater than 99.99% pure with contaminants<br />
of interest for continuous<br />
analysis, carbon monoxide (CO) and<br />
carbon dioxide (CO 2<br />
), being present<br />
at levels below 1 ppm under normal<br />
conditions. The major challenge with<br />
analyzing CO 2<br />
by grab sample and<br />
laboratory analysis is atmospheric<br />
contamination of the sample. By<br />
using a continuous online sample<br />
system that is free of leaks, a more<br />
representative sample is achieved. In<br />
this particular case study, the plant<br />
was interested in increasing the purity<br />
of its hydrochloric acid (HCl)<br />
product. The FT-IR data were used to<br />
validate process improvements with<br />
regard to minimizing the CO 2<br />
and<br />
CO content of the product.<br />
Two different FT-IR systems were<br />
applied for the sub-part-per-million<br />
analysis of CO and CO 2<br />
in HCl because<br />
of changing equipment availability.<br />
Both used a 5-m pathlength<br />
multipass cell, a 1-min collection<br />
time, and a 60 °C cell temperature,<br />
and both operated with sample pressures<br />
slightly below atmospheric pressure.<br />
The primary difference between<br />
the two FT-IR systems was spectral<br />
resolution. One system was operated<br />
at 0.5-cm -1 resolution and the other<br />
at 8 cm -1 . Both used modified classical<br />
least squares (CLS) algorithms<br />
for quantitative concentration determination.<br />
There were advantages and<br />
disadvantages of operating under the<br />
different resolutions (5), but both demonstrated<br />
capability for the analysis.<br />
The lower-resolution system required<br />
greater attention to the CLS<br />
model prediction because of spectral<br />
overlap between deuterium chloride<br />
(DCl) and CO. The ro-vibrational<br />
spectra of HCl is well known to have<br />
rotational structure from both the<br />
H 35 Cl and H 37 Cl isotopes. With the<br />
natural abundance of deuterium<br />
being 156 ppm, the spectrum of anhydrous<br />
HCl also contains rotational<br />
structure from the υ=1←0 band of<br />
D 35 Cl and D 37 Cl centered at 2145.163<br />
cm -1 (7) and overlaps the fundamental<br />
CO stretch region. Figure 5<br />
shows the overlap of DCl and CO at<br />
0.5 cm -1 and 8 cm -1 resolution. With<br />
the spectrometer system at 0.5 cm -1<br />
resolution, the best quantitative solution<br />
was to rely on CO transitions<br />
located in the DCl Q-branch gap.<br />
Specifically, the three CO transitions<br />
at 2094.8 (P(12)), 2090.6 (P(13)), and<br />
2086.3 cm -1 (P(14)) were used for the<br />
CO analysis on the 0.5 cm -1 resolution<br />
spectrometer. A modified CLS<br />
method based off of peak areas was<br />
used for quantitative prediction with<br />
the 0.5-cm -1 system. At 8-cm -1 resolution,<br />
a CLS method was developed<br />
and validated assuming a constant<br />
deuterium concentration of 0.0156%<br />
of the HCl concentration and incorporating<br />
HCl concentrations into the<br />
model. This approach also allowed<br />
small pressure and temperature fluctuations<br />
to be accounted for within<br />
the model.<br />
Conclusions<br />
Continuous at-line and online FT-IR<br />
implementation has proven to be effective<br />
for characterizing process<br />
streams that prove challenging from<br />
the perspective of traditional grab<br />
sampling and laboratory analysis.<br />
Care must be taken in sample handling<br />
and implementation to assure<br />
that a representative sample is delivered<br />
to the analyzer.<br />
The value of FT-IR spectroscopy<br />
for process characterization is the information-rich<br />
nature of the data obtained<br />
and how that information is applied<br />
to optimize or troubleshoot the<br />
process. In many cases, a temporary<br />
online setup that provides a few weeks<br />
to a couple of months of stream data is<br />
all that is required for improvements<br />
to be chosen, implemented, and validated.<br />
However, in other cases the information<br />
collected by the temporary<br />
online FT-IR spectrometer indicates<br />
the need for a permanent online analysis<br />
to be used for closed-loop control<br />
or routine monitoring. In these situations,<br />
the stream composition data<br />
from the FT-IR analysis are used to<br />
specify the most robust, reliable, and<br />
economical solution for a permanent<br />
online analysis. In a few cases this<br />
might be a FT-IR system, but more<br />
commonly the permanent solution<br />
is an alternative spectroscopic-based<br />
solution, such as a filter photometer<br />
or tunable diode laser system. Use of<br />
full-spectrum FT-IR stream composition<br />
information while specifying a<br />
permanent analyzer system increases<br />
the success rate of the new application<br />
development and installations of process<br />
analysis technologies.<br />
References<br />
(1) K.R. Beebe, R.J. Pell, and M.B. Seasholtz,<br />
Chemometrics A Practical<br />
Guide (John Wiley & Sons, Inc., New<br />
York, 1998), Chapter 5.<br />
(2) K.J. Clevett, Process Analyzer Technology<br />
(John Wiley & Sons, Inc. New<br />
York, 1986), Chapter 21.<br />
(3) R.E. Sherman, Process Analyzer Sample-<br />
Conditioning System Technology (John<br />
Wiley & Sons, Inc, New York, 2002).<br />
(4) P. Jaakkola, J.D. Tate, M. Paakkunainen,<br />
and P. Saarinen, Appl. Spectrosc.<br />
51, 1159–1169 (1997).<br />
(5) K. P. Huber and G. Herzberg, Molecular<br />
Spectra and Molecular Structure IV.<br />
Constants of Diatomic Molecules (Van<br />
Nostrand-Reinhold, New York, 1979).<br />
Serena Stephenson,<br />
Lamar Dewald, Esteban<br />
Baquero, Wendy Flory, Liane<br />
Mikolajczyk, and J.D. Tate are with<br />
The Dow Chemical Company. Direct correspondence<br />
to: SStephenson@dow.com ◾<br />
For more information on this topic,<br />
please visit our homepage at:<br />
www.spectroscopyonline.com
26 <strong>Spectroscopy</strong> 26(12) December 2011 www.spectroscopyonline.com<br />
Volume 26, 2011<br />
2011 Editorial Index<br />
AUTHORS<br />
A<br />
Acosta, Tayro E. See Misra, Anupam K.<br />
Adar, Fran. “Analytical Vibrational <strong>Spectroscopy</strong> — NIR, IR,<br />
and Raman,” in Molecular <strong>Spectroscopy</strong> Workbench. October,<br />
p. 14.<br />
Adar, Fran. “Entering Raman’s Realm,” in Molecular <strong>Spectroscopy</strong><br />
Workbench. March, p. 22.<br />
Adar, Fran. “Graphene: Why the Nobel Prize and Why Raman?”<br />
in Molecular <strong>Spectroscopy</strong> Workbench. February, p. 16.<br />
Ahmed, Selver; Wunder, Stephanie L.; and Nickolov, Zhorro S.<br />
Raman <strong>Spectroscopy</strong> of Supported Lipid Bilayer Nanoparticles.<br />
Raman Technology for Today’s Spectroscopists, June, p. 8.<br />
Almirall, Jose; and Miziolek, Andrzej. Review of the Third North<br />
American Symposium on Laser-Induced Breakdown <strong>Spectroscopy</strong><br />
(NASLIBS) 2011 Conference. October, p. 48.<br />
Alonso, David E.; Binkley, Joe; and Siek, Kevin. Comprehensive<br />
Analysis of Persistent Organic Pollutants in Complex Matrices<br />
Using GC with High-Performance TOF-MS. Current<br />
Trends in Mass Spectrometry, July, p. 48.<br />
Andrews, Darren. See Matousek, Pavel.<br />
Angel, S. Michael. See Gomer, Nathaniel R.<br />
Artaev, Viatcheslav. See Patrick, Jeffrey S.<br />
Asara, John M. Mass Spectrometry Advances Fossilomics. Current<br />
Trends in Mass Spectrometry, March, p. 18.<br />
Assi, Sulaf; Watt, Robert; and Moffat, Tony. Comparison of<br />
Laboratory and Handheld Raman Instruments for the Identification<br />
of Counterfeit Medicines. Raman Technology for<br />
Today’s Spectroscopists, June, p. 36.<br />
Atkins, P.; Ernyei, L.; Driscoll, W.; Obenauf, R.; and Thomas, R.<br />
Analysis of Toxic Trace Metals in Pet Foods Using Cryogenic<br />
Grinding and Quantitation by ICP-MS, Part I. January, p. 46.<br />
Atkins, P.; Ernyei, L.; Driscoll, W.; Obenauf, R.; and Thomas,<br />
R. Analysis of Toxic Trace Metals in Pet Foods Using<br />
Cryogenic Grinding and Quantitation by ICP-MS, Part<br />
II. February, p. 42.<br />
B<br />
Ball, David W. “Little Points of Light,” in The Baseline. January,<br />
p. 20.<br />
Ball, David W. “Maxwell’s Equations, Part I: History,” in The<br />
Baseline. April, p. 16.<br />
Ball, David W. “Maxwell’s Equations, Part II,” in The Baseline.<br />
June, p. 14.<br />
Ball, David W. “Maxwell’s Equations, Part III,” in The Baseline.<br />
September, p. 18.<br />
Ball, David W. “Maxwell’s Equations, Part IV,” in The Baseline.<br />
December, p. 10.<br />
Balogh, Michael. The Nature and Utility of Mass Spectra. February,<br />
p. 60.<br />
Baquero, Esteban. See Stephenson, Serena.<br />
Bartsch, G. See Pallua, J.D.<br />
Bates, David E. See Misra, Anupam K.<br />
Baumgartner, C. See Pallua, J.D.<br />
Beechem, Thomas E.; and Serrano, Justin R. Raman Thermometry<br />
of Microdevices: Choosing a Method to Minimize Error.<br />
November, p. 36.<br />
Begley, Benjamin; and Koleto, Michael. Single Multipoint Calibration<br />
Curve for Discovery Bioanalysis. Current Trends in<br />
Mass Spectrometry, May, p. 8.<br />
Binkley, Joe. See Alonso, David E.<br />
Binkley, Joe. See Patrick, Jeffrey S.<br />
Bittner, L.K. See Pallua, J.D.<br />
Blank, Thomas B. See Ford, Alan R.<br />
Bloomfield, Matthew. See Matousek, Pavel.<br />
Boeker, Peter. See Haas, Torsten.<br />
Bonn, G.K. See Pallua, J.D.<br />
Brill, Laurence M. Responding to Data Analysis and Evaluation<br />
Challenges in Mass Spectrometry–Based Methods for High-<br />
Throughput Proteomics. Current Trends in Mass Spectrometry,<br />
March, p. 36.<br />
Brouillette, Carl. See Donahue, Michael.<br />
Brueggemeyer, Thomas. See Lanzarotta, Adam.<br />
Burgess, Chris. See McDowall, R.D.
www.spectroscopyonline.com<br />
December 2011 <strong>Spectroscopy</strong> 26(12) 27<br />
Burns, William A. See Osborn, Tabetha.<br />
Burrows, Richard; Wilbur, Steve; and<br />
Clinkscales, Richard. “Analysis of<br />
Flue Gas Desulfurization Wastewaters<br />
by ICP-MS,” in Atomic Perspectives.<br />
November, p. 30.<br />
Busch, Kenneth L. “Consequences of Finite<br />
Ion Lifetimes in Mass Spectrometry,”<br />
in Mass Spectrometry Forum.<br />
September, p. 12.<br />
Busch, Kenneth L. “Detecting Ions in<br />
Mass Spectrometers with the Faraday<br />
Cup,” in Mass Spectrometry Forum.<br />
November, p. 12.<br />
Busch, Kenneth L. “Hybrid Mass Spectrometers,”<br />
in Mass Spectrometry<br />
Forum. March, p. 16.<br />
Busch, Kenneth L. “Mass Spectrometry<br />
for First Responders,” in Mass Spectrometry<br />
Forum. July, p. 12.<br />
Busch, Kenneth L. “Underwater Mass<br />
Spectrometry,” in Mass Spectrometry<br />
Forum. January, p. 30.<br />
Bush, Laura. The Dynamic World of<br />
X-ray Fluorescence. July, p. 40.<br />
Bush, Laura. ICP-MS for Forensic Applications.<br />
October, p. 57.<br />
Bush, Laura. “LIBS in Forensics,” in Lasers<br />
and Optics Interface. April, p. 34<br />
C<br />
Caldwell, Brittany. See Mahadevan-Jansen,<br />
Anita.<br />
Carrasco-Pancorbo, Alegria. See Cuadros-Rodriguez,<br />
Luis.<br />
Carson, William W.; and Zhou, Ming.<br />
GPC-IR Hyphenated Technology to<br />
Characterize Copolymers and to Deformulate<br />
Complex Polymer Mixtures<br />
in Polymer-Related Industries. FT-IR<br />
Technology for Today’s Spectroscopists,<br />
August, p. 28.<br />
Carter, J. Chance. See Gomer, Nathaniel<br />
R.<br />
Cassup, Matthew. “Using ICP-MS and<br />
ICP-OES to Measure Trace Elemental<br />
Impurities in Pharmaceuticals in<br />
Compliance with Proposed Pharmacopeia<br />
Chapters,” in Atomic Perspectives.<br />
March, p. 26.<br />
Castro-Suarez, John R. See Hernández-<br />
Rivera, Samuel P.<br />
Chang, Da Hu. See Zhang, Zhen Long.<br />
Chaurand, Pierre. Imaging Mass Spectrometry:<br />
Current Performance and<br />
Upcoming Challenges. Current Trends<br />
in Mass Spectrometry, July, p. 30.<br />
Chen, Ping. See Matousek, Pavel.<br />
Chen, Xiaojing; Wu, Di; and He, Yong. An<br />
Integration of Modified Uninformative<br />
Variable Elimination and Wavelet<br />
Packet Transform for Variable Selection.<br />
April, p. 42.<br />
Chipara, Alin Cristian. See Chipara, Dorina<br />
Magdalena.<br />
Chipara, Dorina Magdalena; Chipara, Alin<br />
Cristian; and Chipara, Mircea. Raman<br />
<strong>Spectroscopy</strong> of Carbonaceous Materials:<br />
A Concise Review. October, p. 42.<br />
Chipara, Mircea. See Chipara, Dorina<br />
Magdalena.<br />
Christesen, Steve D. See Ford, Alan R.<br />
Clinkscales, Richard. See Burrows, Richard.<br />
Cole, Alun. See Haas, Torsten.<br />
Coulier, Leon; Tas, Albert; and Thissen,<br />
Uwe. Food Metabolomics: Fact or<br />
Fiction? Current Trends in Mass Spectrometry,<br />
May, p. 34.<br />
Countryman, Sky. See Li, Shuguang.<br />
Coutinho, Carlos Augusto; and Thomsen,<br />
Volker. Spectrometers for Elemental<br />
Spectrochemical Analysis, Part IV:<br />
Inductively Coupled Plasma Optical<br />
Emission Spectrometers. September,<br />
p. 44.<br />
Cowin, James P. See Yu, Xiao-Ying.<br />
Cuadros-Rodriguez, Luis; Carrasco-<br />
Pancorbo, Alegria; and Iglesias, Natalia<br />
Navas. Mass Spectrometry in Analytical<br />
Lipidomics. Current Trends in<br />
Mass Spectrometry, July, p. 8.<br />
D<br />
David, Frank; Sandra, Pat; and Hancock,<br />
Peter. Determining High-Molecular-<br />
Weight Phthalates in Sediments Using<br />
GC–APCI-TOF-MS. Current Trends in<br />
Mass Spectrometry, May, p. 42.<br />
Deschaines, Timothy O. See Hirsch, Jeffrey.<br />
Dewald, Lamar. See Stephenson, Serena.<br />
Diem, Max. See Hernández-Rivera, Samuel<br />
P.<br />
Donahue, Michael; Huang, Hermes;<br />
Brouillette, Carl; Smith, Wayne; and<br />
Farquharson, Stuart. Detecting Explosives<br />
by Portable Raman Analyzers: A<br />
Comparison of 785-, 976-, 1064-, and<br />
1550-nm (Retina-Safe) Laser Excitation.<br />
Defense and Homeland Security,<br />
April, p. 24.<br />
Dottery, Edwin L. See Ford, Alan R.<br />
Driscoll, W. See Atkins, P.<br />
E<br />
Enders, Jeffrey R.; Goodwin, Cody R.; Marasco,<br />
Christina C.; Seale, Kevin T.; Wikswo,<br />
John P.; and McLean, John A. Advanced<br />
Structural Mass Spectrometry<br />
for Systems Biology: Pulling the Needles<br />
from Haystacks. Current Trends in Mass<br />
Spectrometry, July, p. 18.<br />
Ernyei, L. See Atkins, P.<br />
Evans, Megan. Developing a Career in FT-<br />
IR. April, p. 58.<br />
Evans, Megan. 2011 Salary Survey: The<br />
Upside of Science. March, p. 30.<br />
Evans, Megan. Review of the 59th Annual<br />
ASMS Conference. Current Trends in<br />
Mass Spectrometry, July, p. 54.<br />
F<br />
Farquharson, Stuart. See Donahue, Michael.<br />
Fischer, Steve. See Sana, Theodore.<br />
Fisher, Eric W. Advances in <strong>Spectroscopy</strong><br />
for Detection and Identification of Potential<br />
Bioterror Agents. Defense and<br />
Homeland Security, April, p. 29.<br />
Flory, Wendy. See Stephenson, Serena.<br />
Ford, Alan R.; Waterbury, Robert D.;<br />
Vunck, Darius M.; Rose, Jeremy B.;<br />
Blank, Thomas B.; Pohl, Ken R.;<br />
McVay, Troy A.; Dottery, Edwin L.;<br />
Hankus, Mikella E.; Holthoff, Ellen L.;<br />
Pellegrino, Paul M.; Christesen, Steve<br />
D.; and Fountain III, Augustus W. Explosives<br />
Sensing Using Multiple Optical<br />
Techniques in a Standoff Regime<br />
with a Common Platform. Defense and<br />
Homeland Security, April, p. 6.<br />
Fountain III, Augustus W. See Ford, Alan<br />
R.<br />
G<br />
Gao, Yue. See Yu, Kate.<br />
Gendron, Colleen M. See Smith-Goettler,<br />
Brandye.<br />
Gomer, Nathaniel R.; Gordon, Christopher<br />
M.; Lucey, Paul; Sharma, Shiv<br />
K.; Carter, J. Chance; and Angel, S.<br />
Michael. Raman <strong>Spectroscopy</strong> Using<br />
a Fixed-Grating Spatial Heterodyne<br />
Interferometer. Raman Technology for<br />
Today’s Spectroscopists, June, p. 22.<br />
Goodwin, Cody R. See Enders, Jeffrey R.<br />
Gordon, Christopher M. See Gomer, Nathaniel<br />
R.<br />
Gorla, Srinivasa. See Roy, Arindam.<br />
Granja, Nara de Matos. See Mahadevan-<br />
Jansen, Anita.
28 <strong>Spectroscopy</strong> 26(12) December 2011 www.spectroscopyonline.com<br />
Gratz, Samuel. See Lanzarotta, Adam.<br />
Green, Joshua. See Osborn, Tabetha.<br />
H<br />
Haas, Torsten; Boeker, Peter; Cole, Alun;<br />
and Horner, Gerhard. High-Definition<br />
Screening for Boar Taint in Fatback<br />
Samples Using GC–MS. Current<br />
Trends in Mass Spectrometry, July, p.<br />
38.<br />
Hancock, Peter. See David, Frank.<br />
Handler, M. See Pallua, J.D.<br />
Hankus, Mikella E. See Ford, Alan R.<br />
Hargreaves, Michael. See Matousek,<br />
Pavel.<br />
He, Yong. See Chen, Xiaojing.<br />
Heinle, Lance; and Jenkins, Gary. Creating<br />
a High-Throughput LC–MS-MS<br />
System Using Common Components.<br />
Current Trends in Mass Spectrometry,<br />
October, p. 16.<br />
Hernández-Rivera, Samuel P.; Castro-<br />
Suarez, John R.; Pacheco-Londoño,<br />
Leonardo C.; Primera-Pedrozo, Oliva<br />
M.; Rey-Villamizar, Nicolas; Vélez-<br />
Reyes, Miguel; and Diem, Max. Mid-<br />
Infrared Vibrational <strong>Spectroscopy</strong><br />
Standoff Detection of Highly Energetic<br />
Materials: New Developments. Defense<br />
and Homeland Security, April, Digital<br />
Edition.<br />
Herrmann, Otto. See Switzer, Teresa.<br />
Hirsch, Jeffrey; Deschaines, Timothy<br />
O.; and Strother, Todd. Improved<br />
Principal Component Discrimination<br />
of Commercial Inks Using Surface-Enhanced<br />
Resonant Raman<br />
Scattering. October, p. 32.<br />
Hodkiewicz, Joe. “The Importance of<br />
Tight Laser Power Control When<br />
Working with Carbon Nanomaterials,”<br />
in Lasers and Optics Interface.<br />
July, p. 22.<br />
Holthoff, Ellen L. See Ford, Alan R.<br />
Horner, Gerhard. See Haas, Torsten.<br />
Howard, James W. See Kay, Richard G.<br />
Huang, Hermes. See Donahue, Michael.<br />
Huck-Pezzei, V. See Pallua, J.D.<br />
Huck, C.W. See Pallua, J.D.<br />
Hussain, Samina; Liba, Amir; and<br />
McCurdy, Ed. Validating ICP-<br />
MS for the Analysis of Elemental<br />
Impurities According to Draft<br />
USP General Chapters and<br />
. Applications of ICP & ICP-<br />
MS Techniques for Today’s Spectroscopists,<br />
November, p. 14.<br />
I<br />
Iedema, Martin J. See Yu, Xiao-Ying.<br />
Iglesias, Natalia Navas. See Cuadros-Rodriguez,<br />
Luis.<br />
Ilic, Darko. See Switzer, Teresa.<br />
Infantino, Gabe. See Nam, Kwan H.<br />
Isensee, Robert. See Nam, Kwan H.<br />
J<br />
Jakubowski, Jr., Edward M. See McGuire,<br />
Jeffrey M.<br />
Jarvis, Michael J.Y. See Taylor, Adrian M.<br />
Jenkins, Gary. See Heinle, Lance.<br />
Johnson, David W. Application of Raman<br />
<strong>Spectroscopy</strong> to Lubricants, Lubricated<br />
Surfaces, and Lubrication Phenomena.<br />
July, p. 46.<br />
K<br />
Kang, Liping. See Yu, Kate.<br />
Kay, Richard G.; Howard, James W.; and<br />
Pleasance, Steve. Time-Resolved SRM<br />
Analysis and Highly Multiplexed LC–<br />
MS-MS for Quantifying Tryptically<br />
Digested Proteins. Current Trends in<br />
Mass Spectrometry, March, p. 24.<br />
Keller, Matthew D. See Mahadevan-Jansen,<br />
Anita.<br />
Kelley, Mark C. See Mahadevan-Jansen,<br />
Anita.<br />
Kim, Youngjae; and Salhany, Joseph.<br />
“Multiphoton <strong>Spectroscopy</strong>,” in Lasers<br />
and Optics Interface. January, p. 24.<br />
Klocker, H. See Pallua, J.D.<br />
Koerner, Phil; and McGinley, Michael.<br />
25-Hydroxyvitamin D 2<br />
/D 3<br />
Analysis<br />
in Human Plasma Using LC–MS.<br />
Current Trends in Mass Spectrometry,<br />
March, p. 8.<br />
Koleto, Michael. See Begley, Benjamin.<br />
Kremser, L. See Pallua, J.D.<br />
L<br />
Lanzarotta, Adam; Gratz, Samuel;<br />
Brueggemeyer, Thomas; and Witkowski,<br />
Mark. A Targeted Approach to<br />
Detect Controlled Substances in Suspect<br />
Tablets Using Attenuated Total<br />
Internal Reflection Fourier-Transform<br />
Infrared Spectroscopic Imaging. February,<br />
p. 34.<br />
Layne, Jeff. See Li, Shuguang.<br />
Li, Li; and Schug, Kevin. On- and Off-<br />
Line Coupling of Separation Techniques<br />
to Ambient Ionization Mass<br />
Spectrometry. Current Trends in Mass<br />
Spectrometry, October, p. 8.<br />
Li, Qingbo. See Zhang, Qianxuan.<br />
Li, Shuguang; Layne, Jeff; Countryman,<br />
Sky; and McGinley, Michael. A Sensitive,<br />
Specific, Accurate, and Fast LC–<br />
MS-MS Method for Measurement of<br />
Ethyl Glucuronide and Ethyl Sulfate in<br />
Human Urine. Current Trends in Mass<br />
Spectrometry, July, p. 42.<br />
Liba, Amir. See Hussain, Samina.<br />
Lindner, H. See Pallua, J.D.<br />
Loeffen, Paul. See Matousek, Pavel.<br />
Lowry, Steve. Optimizing FT-IR Sampling<br />
for a Method to Determine the Chemical<br />
Composition of Microbial Materials.<br />
June, p. 30.<br />
Lowry, Steve; and Weesner, Forrest. Using<br />
Real-Time FT-IR to Characterize UV<br />
Curable Optical Adhesives. FT-IR<br />
Technology for Today’s Spectroscopists,<br />
August, p. 40.<br />
Lucey, Paul. See Gomer, Nathaniel R.<br />
M<br />
Ma, Baiping. See Yu, Kate.<br />
MacPhail, Neil. See Smith-Goettler, Brandye.<br />
Mahadevan-Jansen, Anita; Keller, Matthew<br />
D.; Vargis, Elizabeth; Caldwell,<br />
Brittany; Nguyen, The-Quyen; Granja,<br />
Nara de Matos; Sanders, Melinda; and<br />
Kelley, Mark C. Looking Below the<br />
Surface of Breast Tissue During Surgery.<br />
Raman Technology for Today’s<br />
Spectroscopists, June, p. 48.<br />
Marasco, Christina C. See Enders,<br />
Jeffrey R.<br />
Mark, Howard. Pittcon 2011 New Product<br />
Review. May, p. 32.<br />
Mark, Howard; and Workman, Jr., Jerome.<br />
“Classical Least Squares, Part<br />
IV: Spectroscopic Theory Continued,”<br />
in Chemometrics in <strong>Spectroscopy</strong>.<br />
February, p. 26.<br />
Mark, Howard; and Workman, Jr., Jero<br />
me. “Classical Least Squares, Part V:<br />
Experimental Results,” in Chemometrics<br />
in <strong>Spectroscopy</strong>. May, p. 12.<br />
Mark, Howard; and Workman, Jr., Jerome.<br />
“Classical Least Squares, Part<br />
VI: Spectral Results,” in Chemometrics<br />
in <strong>Spectroscopy</strong>. June, p. 22.<br />
Mark, Howard; and Workman, Jr., Jerome.<br />
“Classical Least Squares, Part<br />
VII: Spectral Reconstruction of Mixtures,”<br />
in Chemometrics in <strong>Spectroscopy</strong>.<br />
October, p. 24.<br />
Mason, Michael. See Patrick, Jeffrey S.
www.spectroscopyonline.com<br />
December 2011 <strong>Spectroscopy</strong> 26(12) 29<br />
Matousek, Pavel; Thorley, Fiona; Chen,<br />
Ping; Hargreaves, Michael; Tombling,<br />
Craig; Loeffen, Paul; Bloomfield, Matthew;<br />
and Andrews, Darren. Emerging<br />
Raman Techniques for Rapid Noninvasive<br />
Characterization of Pharmaceutical<br />
Samples and Containers. March, p. 44.<br />
McCurdy, Ed. See Hussain, Samina.<br />
McDowall, R.D. “Is GMP Annex 11 Europe’s<br />
Answer to 21 CFR 11?” in Focus<br />
on Quality. April, p. 24.<br />
McDowall, R.D. “Periodic Reviews of<br />
Computerized Systems, Part I,” in<br />
Focus on Quality. September, p. 28.<br />
McDowall, R.D. “Periodic Reviews of<br />
Computerized Systems, Part II,” in<br />
Focus on Quality. November, p. 20.<br />
McDowall, R.D.; and Burgess, Chris.<br />
“USP and the GAMP Guide<br />
on Laboratory Computerized Systems<br />
— Is Integration Possible?” in Focus on<br />
Quality. December, p. 14.<br />
McGinley, Michael. See Koerner, Phil.<br />
McGinley, Michael. See Li, Shuguang.<br />
McGuire, Jeffrey M.; Jakubowski, Jr., Edward<br />
M.; and Thomson, Sandra A.<br />
Monitoring of Biological Matrices by<br />
GC–MS-MS for Chemical Warfare<br />
Nerve Agent Detection. Defense and<br />
Homeland Security, April, p. 12.<br />
McLean, John A. See Enders, Jeffrey R.<br />
McSheehy-Ducos, Shona. Overcoming<br />
the Challenges Associated with the<br />
Direct Analysis of Trace Metals in Seawater<br />
Using ICP-MS. Applications of<br />
ICP & ICP-MS Techniques for Today’s<br />
Spectroscopists, November, p. 22.<br />
McVay, Troy A. See Ford, Alan R.<br />
Meding, S. See Pallua, J.D.<br />
Meyer, Robert F. See Smith-Goettler,<br />
Brandye.<br />
Mikolajczyk, Liane. See Stephenson, Serena.<br />
Millar, Alan. See Yu, Kate.<br />
Misra, Anupam K.; Sharma, Shiv K.;<br />
Acosta, Tayro E.; and Bates, David E.<br />
Detection of Chemicals with Standoff<br />
Raman <strong>Spectroscopy</strong>. Defense and<br />
Homeland Security, April, p. 18.<br />
Miziolek, Andrzej. See Almirall, Jose.<br />
Mo, Yu Jun. See Zhang, Zhen Long.<br />
Moffat, Tony. See Assi, Sulaf.<br />
N<br />
Nam, Kwan H.; Isensee, Robert; Infantino,<br />
Gabe; Putyera, Karol; and Wang,<br />
Xinwei. Microwave-Induced Combustion<br />
for ICP-MS: A Generic Approach<br />
to Trace Elemental Analyses of Pharmaceutical<br />
Products. April, p. 36.<br />
Netzer, M. See Pallua, J.D.<br />
Neubauer, Kenneth; and Thompson,<br />
Laura. “Close Enough: The Value of<br />
Semiquantitative Analysis,” in Atomic<br />
Perspectives. May, p. 24.<br />
Nguyen, The-Quyen. See Mahadevan-<br />
Jansen, Anita.<br />
Nickolov, Zhorro S. See Ahmed, Selver.<br />
O<br />
Obenauf, R. See Atkins, P.<br />
Osborn, Tabetha; Burns, William A.;<br />
Green, Joshua; and Reeve, Scott W. An<br />
Optical Nose Approach to Explosive<br />
Detection: One Strategy for Optically<br />
Based Sensing. January, p. 34.<br />
Osl, M. See Pallua, J.D.<br />
P<br />
Pacheco-Londoño, Leonardo C. See<br />
Hernández-Rivera, Samuel P.<br />
Pallua, J.D.; Schaefer, G.; Bittner, L.K.; Pezzei,<br />
C.; Huck-Pezzei, V.; Schoenbichler,<br />
S.A.; Meding, S.; Rauser, S.; Walch, A.;<br />
Handler, M.; Netzer, M.; Osl, M.; Seger,<br />
M.; Pfeifer, B.; Baumgartner, C.; Lindner,<br />
H.; Kremser, L.; Sarg, B.; Klocker,<br />
H.; Bartsch, G.; Bonn, G.K.; and Huck,<br />
C.W. Matrix-Assisted Laser Desorption–Ionization<br />
Imaging Mass Spectrometry<br />
for Direct Tissue Analysis.<br />
Current Trends in Mass Spectrometry,<br />
October, p. 21.<br />
Patrick, Jeffrey S.; Siek, Kevin; Binkley,<br />
Joe; Artaev, Viatcheslav; and Mason,<br />
Michael. A New Path to High-Resolution<br />
HPLC–TOF-MS — Survey,<br />
Targeted, and Trace Analysis Applications<br />
of TOF-MS in the Analysis<br />
of Complex Biochemical Matrices.<br />
Current Trends in Mass Spectrometry,<br />
May, p. 18.<br />
Pellegrino, Paul M. See Ford, Alan R.<br />
Pezzei, C. See Pallua, J.D.<br />
Pfeifer, B. See Pallua, J.D.<br />
Pfeil, David. “Measurement Techniques<br />
for Mercury: Which Approach Is Right<br />
for You?” in Atomic Perspectives. September,<br />
p. 40.<br />
Phillips, Joseph X. See Smith-Goettler,<br />
Brandye.<br />
Pleasance, Steve. See Kay, Richard G.<br />
Pohl, Ken R. See Ford, Alan R.<br />
Prest, Harry. See Wells, Greg.<br />
Primera-Pedrozo, Oliva M. See Hernández-Rivera,<br />
Samuel P.<br />
Putyera, Karol. See Nam, Kwan H.<br />
R<br />
Rauser, S. See Pallua, J.D.<br />
Reeve, Scott W. See Osborn, Tabetha.<br />
Rey-Villamizar, Nicolas. See Hernández-<br />
Rivera, Samuel P.<br />
Rose, Jeremy B. See Ford, Alan R.<br />
Roy, Arindam; and Gorla, Srinivasa. Analytical<br />
Strategies in the Development<br />
of Generic Drug Products: The Role of<br />
Chromatography and Mass Spectrometry.<br />
Current Trends in Mass Spectrometry,<br />
October, p. 29.<br />
Russ IV, Charles William. See Wells, Greg.<br />
Ryan, Andrew; and Thomas, Robert. Ensuring<br />
the Safety and Quality of Foodstuffs<br />
Produced in China: The Role of<br />
ICP-MS. Applications of ICP & ICP-MS<br />
Techniques for Today’s Spectroscopists,<br />
November, p. 28.<br />
S<br />
Salhany, Joseph. See Kim, Youngjae.<br />
Sana, Theodore; Fischer, Steve; and Tichy,<br />
Shane E. Metabolomics Workflows:<br />
Combining Untargeted Discovery-<br />
Based and Targeted Confirmation<br />
Approaches for Mining Metabolomics<br />
Data. Current Trends in Mass<br />
Spectrometry, March, p. 12.<br />
Sanders, Melinda. See Mahadevan-Jansen,<br />
Anita.<br />
Sandra, Pat. See David, Frank.<br />
Sarg, B. See Pallua, J.D.<br />
Schaefer, G. See Pallua, J.D.<br />
Schmid, Lawrence S. The Demand for<br />
<strong>Spectroscopy</strong> Instrumentation Continues<br />
Unabated. August, p. 12.<br />
Schmid, Lawrence S. The <strong>Spectroscopy</strong><br />
Market Hits Its Stride. March, p. 36.<br />
Schoenbichler, S.A. See Pallua, J.D.<br />
Schug, Kevin. See Li, Li.<br />
Seale, Kevin T. See Enders, Jeffrey R.<br />
Seger, M. See Pallua, J.D.<br />
Serrano, Justin R. See Beechem, Thomas<br />
E.<br />
Sharma, Shiv K. See Gomer, Nathaniel R.<br />
Sharma, Shiv K. See Misra, Anupam K.<br />
Siek, Kevin. See Alonso, David E.<br />
Siek, Kevin. See Patrick, Jeffrey S.<br />
Smith-Goettler, Brandye; Gendron, Colleen<br />
M.; MacPhail, Neil; Meyer, Robert<br />
F.; and Phillips, Joseph X. NIR<br />
Monitoring of a Hot-Melt Extrusion
30 <strong>Spectroscopy</strong> 26(12) December 2011 www.spectroscopyonline.com<br />
Process. FT-IR Technology for Today’s<br />
Spectroscopists, August, p. 8.<br />
Smith, Wayne. See Donahue, Michael.<br />
Spencer, Jerald L. See Thomsen, Volker<br />
B.E.<br />
Spragg, Richard. Contact and Orientation<br />
Effects in FT-IR ATR Spectra. FT-IR<br />
Technology for Today’s Spectroscopists,<br />
August, p. 18.<br />
Stephenson, Serena; Dewald, Lamar;<br />
Baquero, Esteban; Flory, Wendy;<br />
Mikolajczyk, Liane; and Tate, J.D.<br />
Temporary Online FT-IR <strong>Spectroscopy</strong><br />
for Process Characterization in<br />
the Chemical Industry. December,<br />
p. 21.<br />
Strother, Todd. See Hirsch, Jeffrey.<br />
Switzer, Teresa; Herrmann, Otto; and Ilic,<br />
Darko. The Determination of 226 Ra in<br />
Nontypical Soil Samples by ICP-MS.<br />
Applications of ICP & ICP-MS Techniques<br />
for Today’s Spectroscopists, November,<br />
p. 6.<br />
T<br />
Tas, Albert. See Coulier, Leon.<br />
Tate, J.D. See Stephenson, Serena.<br />
Taylor, Adrian M.; and Jarvis, Michael J.Y.<br />
High-Throughput Quantitative Analysis<br />
of Vitamin D Using a Multiple Parallel<br />
LC–MS System Combined with Integrated<br />
On-Line SPE. Current Trends<br />
in Mass Spectrometry, May, p. 12.<br />
Thissen, Uwe. See Coulier, Leon.<br />
Thomas, R. See Atkins, P.<br />
Thomas, Robert. See Ryan, Andrew.<br />
Thompson, Laura. See Neubauer, Kenneth.<br />
Thomsen, Volker B.E.; and Spencer, Jerald<br />
L. “R&D Opportunities in Arc/Spark<br />
Optical Emission Spectrometry,” in<br />
Atomic Perspectives. July, p. 18.<br />
Thomsen, Volker. See Coutinho, Carlos<br />
Augusto.<br />
Thomson, Sandra A. See McGuire, Jeffrey<br />
M.<br />
Thorley, Fiona. See Matousek, Pavel.<br />
Tichy, Shane E. See Sana, Theodore.<br />
Tombling, Craig. See Matousek, Pavel.<br />
V<br />
Vargis, Elizabeth. See Mahadevan-Jansen,<br />
Anita.<br />
Vélez-Reyes, Miguel. See Hernández-<br />
Rivera, Samuel P.<br />
Veryovkin, Igor. See Zinovev, Alexander.<br />
Vunck, Darius M. See Ford, Alan R.<br />
W<br />
Walch, A. See Pallua, J.D.<br />
Wang, Xinwei. See Nam, Kwan H.<br />
Waterbury, Robert D. See Ford, Alan R.<br />
Watt, Robert. See Assi, Sulaf.<br />
Weesner, Forrest. See Lowry, Steve.<br />
Wells, Greg; Prest, Harry; and Russ IV,<br />
Charles William. Why Use Signal-<br />
To-Noise As a Measure of MS Performance<br />
When It Is Often Meaningless?<br />
Current Trends in Mass Spectrometry,<br />
May, p. 28.<br />
Wikswo, John P. See Enders, Jeffrey R.<br />
Wilbur, Steve. See Burrows, Richard.<br />
Witkowski, Mark. See Lanzarotta, Adam.<br />
Workman, Jr., Jerome. See Mark, Howard.<br />
Wu, Di. See Chen, Xiaojing.<br />
Wunder, Stephanie L. See Ahmed, Selver.<br />
Y<br />
Yang, Li. See Yu, Xiao-Ying.<br />
Yu, HeShui. See Yu, Kate.<br />
Yu, Kate; Ma, Baiping; Yu, HeShui; Kang,<br />
Liping; Zhang, Jie; Gao, Yue; and Millar,<br />
Alan. Comparison of Extracts<br />
from Dry and Alcohol-Steamed Root<br />
of Polygonatum kingianum (Huang<br />
Jing) by Sub-2-µm-LC–TOF-MS.<br />
Current Trends in Mass Spectrometry,<br />
March, p. 30.<br />
Yu, Xiao-Ying; Yang, Li; Zhu, Zihua;<br />
Cowin, James P.; and Iedema, Martin<br />
J. Probing Aqueous Surfaces by TOF-<br />
SIMS. Current Trends in Mass Spectrometry,<br />
October, p. 34.<br />
Z<br />
Zhang, Guangjun. See Zhang, Qianxuan.<br />
Zhang, Jie. See Yu, Kate.<br />
Zhang, Qianxuan; Li, Qingbo; and<br />
Zhang, Guangjun. Scattering Impact<br />
Analysis and Correction for<br />
Leaf Biochemical Parameter Estimation<br />
Using Vis-NIR <strong>Spectroscopy</strong>.<br />
July, p. 28.<br />
Zhang, Zhen Long; Chang, Da Hu; and<br />
Mo, Yu Jun. The pH Dependence of<br />
the SERS Spectra of Methyl Yellow in<br />
Silver Colloid. June, p. 38.<br />
Zhou, Ming. See Carson, William W.<br />
Zhu, Zihua. See Yu, Xiao-Ying.<br />
Zinovev, Alexander; and Veryovkin, Igor.<br />
Mass Spectrometry of Organic Molecules<br />
and Laser-Induced Acoustic Desorption:<br />
Applications, Mechanisms,<br />
and Perspectives. Current Trends in<br />
Mass Spectrometry, July, p. 24.<br />
SUBJECTS<br />
ATOMIC EMISSION SPECTROSCOPY<br />
“Close Enough: The Value of Semiquantitative<br />
Analysis,” in Atomic Perspectives.<br />
Kenneth Neubauer and Laura<br />
Thompson. May, p. 24.<br />
“R&D Opportunities in Arc/Spark Optical<br />
Emission Spectrometry,” in<br />
Atomic Perspectives. Volker B.E.<br />
Thomsen and Jerald L. Spencer.<br />
July, p. 18.<br />
Spectrometers for Elemental Spectrochemical<br />
Analysis, Part IV: Inductively<br />
Coupled Plasma Optical Emission<br />
Spectrometers. Carlos Augusto<br />
Coutinho and Volker Thomsen. September,<br />
p. 44.<br />
“Using ICP-MS and ICP-OES to Measure<br />
Trace Elemental Impurities in<br />
Pharmaceuticals in Compliance with<br />
Proposed Pharmacopeia Chapters,” in<br />
Atomic Perspectives. Matthew Cassup.<br />
March, p. 26.<br />
ATOMIC PERSPECTIVES COLUMN<br />
“Analysis of Flue Gas Desulfurization<br />
Wastewaters by ICP-MS,” in Atomic<br />
Perspectives. Richard Burrows, Steve<br />
Wilbur, and Richard Clinkscales. November,<br />
p. 30.<br />
“Close Enough: The Value of Semiquantitative<br />
Analysis,” in Atomic Perspectives.<br />
Kenneth Neubauer and Laura<br />
Thompson. May, p. 24.<br />
“Measurement Techniques for Mercury:<br />
Which Approach Is Right for You?”<br />
in Atomic Perspectives. David Pfeil.<br />
September, p. 40.<br />
“R&D Opportunities in Arc/Spark Optical<br />
Emission Spectrometry,” in Atomic<br />
Perspectives. Volker B.E. Thomsen<br />
and Jerald L. Spencer. July, p. 18.<br />
“Using ICP-MS and ICP-OES to Measure<br />
Trace Elemental Impurities in Pharmaceuticals<br />
in Compliance with Proposed<br />
Pharmacopeia Chapters,” in Atomic<br />
Perspectives. Matthew Cassup. March,<br />
p. 26.<br />
ATOMIC SPECTROSCOPY<br />
“Analysis of Flue Gas Desulfurization<br />
Wastewaters by ICP-MS,” in Atomic<br />
Perspectives. Richard Burrows, Steve<br />
Wilbur, and Richard Clinkscales. November,<br />
p. 30.<br />
Analysis of Toxic Trace Metals in Pet
www.spectroscopyonline.com<br />
December 2011 <strong>Spectroscopy</strong> 26(12) 31<br />
Foods Using Cryogenic Grinding and<br />
Quantitation by ICP-MS, Part I. P. Atkins,<br />
L. Ernyei, W. Driscoll, R. Obenauf,<br />
and R. Thomas. January, p. 46.<br />
Analysis of Toxic Trace Metals in Pet<br />
Foods Using Cryogenic Grinding and<br />
Quantitation by ICP-MS, Part II. P.<br />
Atkins, L. Ernyei, W. Driscoll, R. Obenauf,<br />
and R. Thomas. February, p. 42.<br />
“Close Enough: The Value of Semiquantitative<br />
Analysis,” in Atomic Perspectives.<br />
Kenneth Neubauer and Laura<br />
Thompson. May, p. 24.<br />
The Dynamic World of X-ray Fluorescence.<br />
Laura Bush. July, p. 40.<br />
“LIBS in Forensics,” in Lasers and Optics<br />
Interface. Laura Bush. April, p. 34.<br />
“Measurement Techniques for Mercury:<br />
Which Approach Is Right for You?”<br />
in Atomic Perspectives. David Pfeil.<br />
September, p. 40.<br />
Microwave-Induced Combustion for ICP-<br />
MS: A Generic Approach to Trace Elemental<br />
Analyses of Pharmaceutical<br />
Products. Kwan H. Nam, Robert Isensee,<br />
Gabe Infantino, Karol Putyera,<br />
and Xinwei Wang. April, p. 36.<br />
“R&D Opportunities in Arc/Spark Optical<br />
Emission Spectrometry,” in Atomic<br />
Perspectives. Volker B.E. Thomsen<br />
and Jerald L. Spencer. July, p. 18.<br />
Spectrometers for Elemental Spectrochemical<br />
Analysis, Part IV: Inductively<br />
Coupled Plasma Optical Emission<br />
Spectrometers. Carlos Augusto<br />
Coutinho and Volker Thomsen. September,<br />
p. 44.<br />
“Using ICP-MS and ICP-OES to Measure<br />
Trace Elemental Impurities in<br />
Pharmaceuticals in Compliance with<br />
Proposed Pharmacopeia Chapters,” in<br />
Atomic Perspectives. Matthew Cassup.<br />
March, p. 26.<br />
BASELINE COLUMN<br />
“Little Points of Light,” in The Baseline.<br />
David W. Ball. January, p. 20.<br />
“Maxwell’s Equations, Part I: History,” in<br />
The Baseline. David W. Ball. April, p.<br />
16.<br />
“Maxwell’s Equations, Part II,” in The<br />
Baseline. David W. Ball. June, p. 14.<br />
“Maxwell’s Equations, Part III,” in The Baseline.<br />
David W. Ball. September, p. 18.<br />
“Maxwell’s Equations, Part IV,” in The<br />
Baseline. David W. Ball. December,<br />
p. 10.<br />
BIOLOGICAL AND MEDICAL<br />
ANALYSIS<br />
Optimizing FT-IR Sampling for a Method<br />
to Determine the Chemical Composition<br />
of Microbial Materials. Steve<br />
Lowry. June, p. 30.<br />
Scattering Impact Analysis and Correction<br />
for Leaf Biochemical Parameter<br />
Estimation Using Vis-NIR <strong>Spectroscopy</strong>.<br />
Qianxuan Zhang, Qingbo Li,<br />
and Guangjun Zhang. July, p. 28.<br />
CHEMOMETRICS IN<br />
SPECTROSCOPY COLUMN<br />
“Classical Least Squares, Part IV: Spectroscopic<br />
Theory Continued,” in Chemometrics<br />
in <strong>Spectroscopy</strong>. Howard<br />
Mark and Jerome Workman, Jr. February,<br />
p. 26.<br />
“Classical Least Squares, Part V: Experimental<br />
Results,” in Chemometrics in<br />
<strong>Spectroscopy</strong>. Howard Mark and Jerome<br />
Workman, Jr. May, p. 12.<br />
“Classical Least Squares, Part VI: Spectral<br />
Results,” in Chemometrics in <strong>Spectroscopy</strong>.<br />
Howard Mark and Jerome<br />
Workman, Jr. June, p. 22.<br />
“Classical Least Squares, Part VII: Spectral<br />
Reconstruction of Mixtures,”<br />
in Chemometrics in <strong>Spectroscopy</strong>.<br />
Howard Mark and Jerome Workman,<br />
Jr. October, p. 24.<br />
CHEMOMETRICS<br />
“Classical Least Squares, Part IV: Spectroscopic<br />
Theory Continued,” in Chemometrics<br />
in <strong>Spectroscopy</strong>. Howard<br />
Mark and Jerome Workman, Jr. February,<br />
p. 26.<br />
“Classical Least Squares, Part V: Experimental<br />
Results,” in Chemometrics in<br />
<strong>Spectroscopy</strong>. Howard Mark and Jerome<br />
Workman, Jr. May, p. 12.<br />
“Classical Least Squares, Part VI: Spectral<br />
Results,” in Chemometrics in <strong>Spectroscopy</strong>.<br />
Howard Mark and Jerome<br />
Workman, Jr. June, p. 22.<br />
“Classical Least Squares, Part VII: Spectral<br />
Reconstruction of Mixtures,”<br />
in Chemometrics in <strong>Spectroscopy</strong>.<br />
Howard Mark and Jerome Workman,<br />
Jr. October, p. 24.<br />
An Integration of Modified Uninformative<br />
Variable Elimination and Wavelet<br />
Packet Transform for Variable Selection.<br />
Xiaojing Chen, Di Wu, and Yong<br />
He. April, p. 42.<br />
ENVIRONMENTAL ANALYSIS<br />
“Analysis of Flue Gas Desulfurization<br />
Wastewaters by ICP-MS,” in Atomic<br />
Perspectives. Richard Burrows, Steve<br />
Wilbur, and Richard Clinkscales. November,<br />
p. 30.<br />
“Underwater Mass Spectrometry,” in<br />
Mass Spectrometry Forum. Kenneth<br />
L. Busch. January, p. 30.<br />
EXPLOSIVES<br />
An Optical Nose Approach to Explosive<br />
Detection: One Strategy for Optically<br />
Based Sensing. Tabetha Osborn, William<br />
A. Burns, Joshua Green, and Scott<br />
W. Reeve. January, p. 34.<br />
FOCUS ON QUALITY COLUMN<br />
“Is GMP Annex 11 Europe’s Answer to<br />
21 CFR 11?” in Focus on Quality. R.D.<br />
McDowall. April, p. 24.<br />
“Periodic Reviews of Computerized Systems,<br />
Part I,” in Focus on Quality. R.D.<br />
McDowall. September, p. 28.<br />
“Periodic Reviews of Computerized Systems,<br />
Part II,” in Focus on Quality.<br />
R.D. McDowall. November, p. 20.<br />
“USP and the GAMP Guide on<br />
Laboratory Computerized Systems —<br />
Is Integration Possible?” in Focus on<br />
Quality. R.D. McDowall and Chris<br />
Burgess. December, p. 14.<br />
FOOD AND BEVERAGE ANALYSIS<br />
Analysis of Toxic Trace Metals in Pet<br />
Foods Using Cryogenic Grinding and<br />
Quantitation by ICP-MS, Part I. P. Atkins,<br />
L. Ernyei, W. Driscoll, R. Obenauf,<br />
and R. Thomas. January, p. 46.<br />
Analysis of Toxic Trace Metals in Pet<br />
Foods Using Cryogenic Grinding<br />
and Quantitation by ICP-MS, Part II.<br />
P. Atkins, L. Ernyei, W. Driscoll, R.<br />
Obenauf, and R. Thomas. February,<br />
p. 42.<br />
FORENSIC APPLICATIONS<br />
ICP-MS for Forensic Applications. Laura<br />
Bush. October, p. 57.<br />
“LIBS in Forensics,” in Lasers and Optics<br />
Interface. Laura Bush. April, p. 34.<br />
FUELS<br />
Optimizing FT-IR Sampling for a Method<br />
to Determine the Chemical Composition<br />
of Microbial Materials. Steve<br />
Lowry. June, p. 30.
32 <strong>Spectroscopy</strong> 26(12) December 2011 www.spectroscopyonline.com<br />
HISTORY<br />
“Maxwell’s Equations, Part I: History,” in<br />
The Baseline. David W. Ball. April, p. 16.<br />
ICP AND ICP-MS<br />
“Analysis of Flue Gas Desulfurization<br />
Wastewaters by ICP-MS,” in Atomic<br />
Perspectives. Richard Burrows, Steve<br />
Wilbur, and Richard Clinkscales. November,<br />
p. 30.<br />
Analysis of Toxic Trace Metals in Pet<br />
Foods Using Cryogenic Grinding and<br />
Quantitation by ICP-MS, Part I. P. Atkins,<br />
L. Ernyei, W. Driscoll, R. Obenauf,<br />
and R. Thomas. January, p. 46.<br />
Analysis of Toxic Trace Metals in Pet<br />
Foods Using Cryogenic Grinding<br />
and Quantitation by ICP-MS, Part II.<br />
P. Atkins, L. Ernyei, W. Driscoll, R.<br />
Obenauf, and R. Thomas. February,<br />
p. 42.<br />
“Close Enough: The Value of Semiquantitative<br />
Analysis,” in Atomic Perspectives.<br />
Kenneth Neubauer and Laura<br />
Thompson. May, p. 24.<br />
ICP-MS for Forensic Applications. Laura<br />
Bush. October, p. 57.<br />
Microwave-Induced Combustion for ICP-<br />
MS: A Generic Approach to Trace Elemental<br />
Analyses of Pharmaceutical<br />
Products. Kwan H. Nam, Robert Isensee,<br />
Gabe Infantino, Karol Putyera,<br />
and Xinwei Wang. April, p. 36.<br />
Spectrometers for Elemental Spectrochemical<br />
Analysis, Part IV: Inductively<br />
Coupled Plasma Optical Emission<br />
Spectrometers. Carlos Augusto<br />
Coutinho and Volker Thomsen. September,<br />
p. 44.<br />
“Using ICP-MS and ICP-OES to Measure<br />
Trace Elemental Impurities in<br />
Pharmaceuticals in Compliance with<br />
Proposed Pharmacopeia Chapters,” in<br />
Atomic Perspectives. Matthew Cassup.<br />
March, p. 26.<br />
IMAGING AND MICROSCOPY<br />
A Targeted Approach to Detect Controlled<br />
Substances in Suspect Tablets Using Attenuated<br />
Total Internal Reflection Fourier-Transform<br />
Infrared Spectroscopic<br />
Imaging. Adam Lanzarotta, Samuel<br />
Gratz, Thomas Brueggemeyer, and<br />
Mark Witkowski. February, p. 34.<br />
INFRARED SPECTROSCOPY<br />
“Analytical Vibrational <strong>Spectroscopy</strong> —<br />
NIR, IR, and Raman,” in Molecular<br />
<strong>Spectroscopy</strong> Workbench. Fran Adar.<br />
October, p. 14.<br />
An Optical Nose Approach to Explosive<br />
Detection: One Strategy for Optically<br />
Based Sensing. Tabetha Osborn, William<br />
A. Burns, Joshua Green, and Scott<br />
W. Reeve. January, p. 34.<br />
Developing a Career in FT-IR. Megan<br />
Evans. April, p. 58.<br />
Optimizing FT-IR Sampling for a Method<br />
to Determine the Chemical Composition<br />
of Microbial Materials. Steve<br />
Lowry. June, p. 30.<br />
Scattering Impact Analysis and Correction<br />
for Leaf Biochemical Parameter<br />
Estimation Using Vis-NIR <strong>Spectroscopy</strong>.<br />
Qianxuan Zhang, Qingbo Li,<br />
and Guangjun Zhang. July, p. 28.<br />
A Targeted Approach to Detect Controlled<br />
Substances in Suspect Tablets<br />
Using Attenuated Total Internal Reflection<br />
Fourier-Transform Infrared<br />
Spectroscopic Imaging. Adam<br />
Lanzarotta, Samuel Gratz, Thomas<br />
Brueggemeyer, and Mark Witkowski.<br />
February, p. 34.<br />
Temporary Online FT-IR <strong>Spectroscopy</strong><br />
for Process Characterization in<br />
the Chemical Industry. Serena Stephenson,<br />
Lamar Dewald, Esteban<br />
Baquero, Wendy Flory, Liane Mikolajczyk,<br />
and J.D. Tate. December,<br />
p. 21.<br />
INTERVIEWS<br />
Developing a Career in FT-IR. Megan<br />
Evans. April, p. 58.<br />
ICP-MS for Forensic Applications. Laura<br />
Bush. October, p. 57.<br />
LASERS AND OPTICS INTERFACE<br />
COLUMN<br />
“The Importance of Tight Laser Power<br />
Control When Working with Carbon<br />
Nanomaterials,” in Lasers and Optics<br />
Interface. Joe Hodkiewicz. July, p. 22.<br />
“LIBS in Forensics,” in Lasers and Optics<br />
Interface. Laura Bush. April,<br />
p. 34.<br />
“Multiphoton <strong>Spectroscopy</strong>,” in Lasers<br />
and Optics Interface. Youngjae Kim<br />
and Joseph Salhany. January, p. 24.<br />
LASERS<br />
ICP-MS for Forensic Applications. Laura<br />
Bush. October, p. 57.<br />
“The Importance of Tight Laser Power<br />
Control When Working with Carbon<br />
Nanomaterials,” in Lasers and Optics<br />
Interface. Joe Hodkiewicz. July, p. 22.<br />
“LIBS in Forensics,” in Lasers and Optics<br />
Interface. Laura Bush. April, p. 34.<br />
“Multiphoton <strong>Spectroscopy</strong>,” in Lasers<br />
and Optics Interface. Youngjae Kim<br />
and Joseph Salhany. January, p. 24.<br />
Review of the Third North American<br />
Symposium on Laser-Induced Breakdown<br />
<strong>Spectroscopy</strong> (NASLIBS) 2011<br />
Conference. Jose Almirall and Andrzej<br />
Miziolek. October, p. 48.<br />
LIBS<br />
ICP-MS for Forensic Applications. Laura<br />
Bush. October, p. 57.<br />
“LIBS in Forensics,” in Lasers and Optics<br />
Interface. Laura Bush. April, p. 34.<br />
Review of the Third North American<br />
Symposium on Laser-Induced Breakdown<br />
<strong>Spectroscopy</strong> (NASLIBS) 2011<br />
Conference. Jose Almirall and Andrzej<br />
Miziolek. October, p. 48.<br />
MARKET ANALYSIS<br />
The Demand for <strong>Spectroscopy</strong> Instrumentation<br />
Continues Unabated. Lawrence<br />
S. Schmid. August, p. 12.<br />
The <strong>Spectroscopy</strong> Market Hits Its Stride.<br />
Lawrence S. Schmid. March, p. 36.<br />
2011 Salary Survey: The Upside of Science.<br />
Megan Evans. March, p. 30.<br />
MASS SPECTROMETRY FORUM<br />
COLUMN<br />
“Consequences of Finite Ion Lifetimes in<br />
Mass Spectrometry,” in Mass Spectrometry<br />
Forum. Kenneth L. Busch.<br />
September, p. 12.<br />
“Detecting Ions in Mass Spectrometers<br />
with the Faraday Cup,” in Mass Spectrometry<br />
Forum. Kenneth L. Busch.<br />
November, p. 12.<br />
“Hybrid Mass Spectrometers,” in Mass<br />
Spectrometry Forum. Kenneth L.<br />
Busch. March, p. 16.<br />
“Mass Spectrometry for First Responders,”<br />
in Mass Spectrometry Forum.<br />
Kenneth L. Busch. July, p. 12.<br />
“Underwater Mass Spectrometry,” in<br />
Mass Spectrometry Forum. Kenneth<br />
L. Busch. January, p. 30.<br />
MASS SPECTROMETRY<br />
Analysis of Toxic Trace Metals in Pet
www.spectroscopyonline.com<br />
December 2011 <strong>Spectroscopy</strong> 26(12) 33<br />
Foods Using Cryogenic Grinding<br />
and Quantitation by ICP-MS, Part<br />
I. P. Atkins, L. Ernyei, W. Driscoll,<br />
R. Obenauf, and R. Thomas. January,<br />
p. 46.<br />
Analysis of Toxic Trace Metals in Pet<br />
Foods Using Cryogenic Grinding<br />
and Quantitation by ICP-MS, Part<br />
II. P. Atkins, L. Ernyei, W. Driscoll,<br />
R. Obenauf, and R. Thomas. February,<br />
p. 42.<br />
“Close Enough: The Value of Semiquantitative<br />
Analysis,” in Atomic<br />
Perspectives. Kenneth Neubauer<br />
and Laura Thompson. May, p. 24.<br />
“Consequences of Finite Ion Lifetimes<br />
in Mass Spectrometry,” in Mass<br />
Spectrometry Forum. Kenneth L.<br />
Busch. September, p. 12.<br />
“Detecting Ions in Mass Spectrometers<br />
with the Faraday Cup,” in Mass<br />
Spectrometry Forum. Kenneth L.<br />
Busch. November, p. 12.<br />
“Hybrid Mass Spectrometers,” in Mass<br />
Spectrometry Forum. Kenneth L.<br />
Busch. March, p. 16.<br />
“Mass Spectrometry for First Responders,”<br />
in Mass Spectrometry Forum.<br />
Kenneth L. Busch. July, p. 12.<br />
The Nature and Utility of Mass Spectra.<br />
Michael Balogh. February, p. 60.<br />
A Targeted Approach to Detect Controlled<br />
Substances in Suspect Tablets<br />
Using Attenuated Total Internal<br />
Reflection Fourier-Transform<br />
Infrared Spectroscopic Imaging.<br />
Adam Lanzarotta, Samuel Gratz,<br />
Thomas Brueggemeyer, and Mark<br />
Witkowski. February, p. 34.<br />
“Underwater Mass Spectrometry,” in<br />
Mass Spectrometry Forum. Kenneth<br />
L. Busch. January, p. 30.<br />
“Using ICP-MS and ICP-OES to Measure<br />
Trace Elemental Impurities<br />
in Pharmaceuticals in Compliance<br />
with Proposed Pharmacopeia Chapters,”<br />
in Atomic Perspectives. Matthew<br />
Cassup. March, p. 26.<br />
MEETING REPORTS<br />
Pittcon 2011 New Product Review. Howard<br />
Mark. May, p. 32.<br />
Review of the Third North American<br />
Symposium on Laser-Induced Breakdown<br />
<strong>Spectroscopy</strong> (NASLIBS) 2011<br />
Conference. Jose Almirall and Andrzej<br />
Miziolek. October, p. 48.<br />
MOLECULAR SPECTROSCOPY<br />
WORKBENCH COLUMN<br />
“Analytical Vibrational <strong>Spectroscopy</strong> —<br />
NIR, IR, and Raman,” in Molecular<br />
<strong>Spectroscopy</strong> Workbench. Fran Adar.<br />
October, p. 14.<br />
“Entering Raman’s Realm,” in Molecular<br />
<strong>Spectroscopy</strong> Workbench. Fran Adar.<br />
March, p. 22.<br />
“Graphene: Why the Nobel Prize and<br />
Why Raman?” in Molecular <strong>Spectroscopy</strong><br />
Workbench. Fran Adar. February,<br />
p. 16.<br />
NEAR-IR SPECTROSCOPY<br />
“Analytical Vibrational <strong>Spectroscopy</strong> —<br />
NIR, IR, and Raman,” in Molecular<br />
<strong>Spectroscopy</strong> Workbench. Fran Adar.<br />
October, p. 14.<br />
“Classical Least Squares, Part V: Experimental<br />
Results,” in Chemometrics in<br />
<strong>Spectroscopy</strong>. Howard Mark and Jerome<br />
Workman, Jr. May, p. 12.<br />
“Classical Least Squares, Part VI: Spectral<br />
Results,” in Chemometrics in <strong>Spectroscopy</strong>.<br />
Howard Mark and Jerome<br />
Workman, Jr. June, p. 22.<br />
“Classical Least Squares, Part VII: Spectral<br />
Reconstruction of Mixtures,”<br />
in Chemometrics in <strong>Spectroscopy</strong>.<br />
Howard Mark and Jerome Workman,<br />
Jr. October, p. 24.<br />
Developing a Career in FT-IR. Megan<br />
Evans. April, p. 58.<br />
An Integration of Modified Uninformative<br />
Variable Elimination and Wavelet<br />
Packet Transform for Variable Selection.<br />
Xiaojing Chen, Di Wu, and Yong<br />
He. April, p. 42.<br />
Scattering Impact Analysis and Correction<br />
for Leaf Biochemical Parameter<br />
Estimation Using Vis-NIR <strong>Spectroscopy</strong>.<br />
Qianxuan Zhang, Qingbo Li,<br />
and Guangjun Zhang. July, p. 28.<br />
OPTICS<br />
An Optical Nose Approach to Explosive<br />
Detection: One Strategy for Optically<br />
Based Sensing. Tabetha Osborn, William<br />
A. Burns, Joshua Green, and Scott<br />
W. Reeve. January, p. 34.<br />
PHARMACEUTICAL APPLICATIONS<br />
Emerging Raman Techniques for Rapid<br />
Noninvasive Characterization of Pharmaceutical<br />
Samples and Containers.<br />
Pavel Matousek, Fiona Thorley, Ping<br />
Chen, Michael Hargreaves, Craig<br />
Tombling, Paul Loeffen, Matthew<br />
Bloomfield, and Darren Andrews.<br />
March, p. 44.<br />
“Is GMP Annex 11 Europe’s Answer to<br />
21 CFR 11?” in Focus on Quality. R.D.<br />
McDowall. April, p. 24.<br />
Microwave-Induced Combustion for ICP-<br />
MS: A Generic Approach to Trace Elemental<br />
Analyses of Pharmaceutical<br />
Products. Kwan H. Nam, Robert Isensee,<br />
Gabe Infantino, Karol Putyera,<br />
and Xinwei Wang. April, p. 36.<br />
A Targeted Approach to Detect Controlled<br />
Substances in Suspect Tablets<br />
Using Attenuated Total Internal Reflection<br />
Fourier-Transform Infrared<br />
Spectroscopic Imaging. Adam<br />
Lanzarotta, Samuel Gratz, Thomas<br />
Brueggemeyer, and Mark Witkowski.<br />
February, p. 34.<br />
“Using ICP-MS and ICP-OES to Measure<br />
Trace Elemental Impurities in<br />
Pharmaceuticals in Compliance with<br />
Proposed Pharmacopeia Chapters,” in<br />
Atomic Perspectives. Matthew Cassup.<br />
March, p. 26.<br />
“USP and the GAMP Guide on<br />
Laboratory Computerized Systems —<br />
Is Integration Possible?” in Focus on<br />
Quality. R.D. McDowall and Chris<br />
Burgess. December, p. 14.<br />
PROCESS CONTROL AND ANALYSIS<br />
Temporary Online FT-IR <strong>Spectroscopy</strong><br />
for Process Characterization in<br />
the Chemical Industry. Serena Stephenson,<br />
Lamar Dewald, Esteban<br />
Baquero, Wendy Flory, Liane Mikolajczyk,<br />
and J.D. Tate. December,<br />
p. 21.<br />
RAMAN SPECTROSCOPY<br />
“Analytical Vibrational <strong>Spectroscopy</strong> —<br />
NIR, IR, and Raman,” in Molecular<br />
<strong>Spectroscopy</strong> Workbench. Fran Adar.<br />
October, p. 14.<br />
Application of Raman <strong>Spectroscopy</strong> to<br />
Lubricants, Lubricated Surfaces, and<br />
Lubrication Phenomena. David W.<br />
Johnson. July, p. 46.<br />
Emerging Raman Techniques for Rapid<br />
Noninvasive Characterization of Pharmaceutical<br />
Samples and Containers.<br />
Pavel Matousek, Fiona Thorley, Ping<br />
Chen, Michael Hargreaves, Craig<br />
Tombling, Paul Loeffen, Matthew
34 <strong>Spectroscopy</strong> 26(12) December 2011 www.spectroscopyonline.com<br />
Bloomfield, and Darren Andrews.<br />
March, p. 44.<br />
“Entering Raman’s Realm,” in Molecular<br />
<strong>Spectroscopy</strong> Workbench. Fran Adar.<br />
March, p. 22.<br />
“Graphene: Why the Nobel Prize and<br />
Why Raman?” in Molecular <strong>Spectroscopy</strong><br />
Workbench. Fran Adar. February,<br />
p. 16.<br />
Improved Principal Component Discrimination<br />
of Commercial Inks Using<br />
Surface-Enhanced Resonant Raman<br />
Scattering. Jeffrey Hirsch, Timothy O.<br />
Deschaines, and Todd Strother. October,<br />
p. 32.<br />
“Multiphoton <strong>Spectroscopy</strong>,” in Lasers<br />
and Optics Interface. Youngjae Kim<br />
and Joseph Salhany. January, p. 24.<br />
The pH Dependence of the SERS Spectra<br />
of Methyl Yellow in Silver Colloid.<br />
Zhen Long Zhang, Da Hu Chang, and<br />
Yu Jun Mo. June, p. 38.<br />
Raman <strong>Spectroscopy</strong> of Carbonaceous<br />
Materials: A Concise Review. Dorina<br />
Magdalena Chipara, Alin Cristian<br />
Chipara, and Mircea Chipara. October,<br />
p. 42.<br />
Raman Thermometry of Microdevices:<br />
Choosing a Method to Minimize<br />
Error. Thomas E. Beechem, and Justin<br />
R. Serrano. November, p. 36.<br />
REGULATORY ISSUES<br />
“Is GMP Annex 11 Europe’s Answer to<br />
21 CFR 11?” in Focus on Quality. R.D.<br />
McDowall. April, p. 24.<br />
“Periodic Reviews of Computerized Systems,<br />
Part I,” in Focus on Quality. R.D.<br />
McDowall. September, p. 28.<br />
“Periodic Reviews of Computerized Systems,<br />
Part II,” in Focus on Quality.<br />
R.D. McDowall. November, p. 20.<br />
“USP and the GAMP Guide on<br />
Laboratory Computerized Systems —<br />
Is Integration Possible?” in Focus on<br />
Quality. R.D. McDowall and Chris<br />
Burgess. December, p. 14.<br />
SAMPLE PREPARATION AND<br />
INTRODUCTION<br />
Analysis of Toxic Trace Metals in Pet<br />
Foods Using Cryogenic Grinding and<br />
Quantitation by ICP-MS, Part I. P. Atkins,<br />
L. Ernyei, W. Driscoll, R. Obenauf,<br />
and R. Thomas. January, p. 46.<br />
Analysis of Toxic Trace Metals in Pet<br />
Foods Using Cryogenic Grinding<br />
and Quantitation by ICP-MS, Part II.<br />
P. Atkins, L. Ernyei, W. Driscoll, R.<br />
Obenauf, and R. Thomas. February,<br />
p. 42.<br />
Microwave-Induced Combustion for ICP-<br />
MS: A Generic Approach to Trace Elemental<br />
Analyses of Pharmaceutical<br />
Products. Kwan H. Nam, Robert Infantino<br />
, Gabe Isensee, Karol Putyera,<br />
and Xinwei Wang. April, p. 36.<br />
SPECTROSCOPIC THEORY<br />
“Classical Least Squares, Part IV: Spectroscopic<br />
Theory Continued,” in Chemometrics<br />
in <strong>Spectroscopy</strong>. Howard<br />
Mark and Jerome Workman, Jr. February,<br />
p. 26.<br />
“Little Points of Light,” in The Baseline.<br />
David W. Ball. January, p. 20.<br />
“Maxwell’s Equations, Part I: History,” in<br />
The Baseline. David W. Ball. April, p.<br />
16.<br />
“Maxwell’s Equations, Part II,” in The<br />
Baseline. David W. Ball. June, p. 14.<br />
“Maxwell’s Equations, Part III,” in The<br />
Baseline. David W. Ball. September,<br />
p. 18.<br />
“Maxwell’s Equations, Part IV,” in The<br />
Baseline. David W. Ball. December,<br />
p. 10.<br />
Raman <strong>Spectroscopy</strong> of Carbonaceous<br />
Materials: A Concise Review. Dorina<br />
Magdalena Chipara, Alin Cristian<br />
Chipara, and Mircea Chipara. October,<br />
p. 42.<br />
SUPPLEMENT: APPLICATIONS OF<br />
ICP & ICP-MS TECHNIQUES FOR<br />
TODAY’S SPECTROSCOPISTS<br />
The Determination of 226 Ra in Nontypical<br />
Soil Samples by ICP-MS. Teresa Switzer,<br />
Otto Herrmann, and Darko Ilic.<br />
November, p. 6.<br />
Ensuring the Safety and Quality of Foodstuffs<br />
Produced in China: The Role of<br />
ICP-MS. Andrew Ryan and Robert<br />
Thomas. November, p. 28.<br />
Overcoming the Challenges Associated<br />
with the Direct Analysis of Trace Metals<br />
in Seawater Using ICP-MS. Shona<br />
McSheehy-Ducos. November, p. 22.<br />
Validating ICP-MS for the Analysis of<br />
Elemental Impurities According to<br />
Draft USP General Chapters <br />
and . Samina Hussain, Amir<br />
Liba, and Ed McCurdy. November,<br />
p. 14.<br />
SUPPLEMENT: CURRENT TRENDS<br />
IN MASS SPECTROMETRY<br />
Advanced Structural Mass Spectrometry<br />
for Systems Biology: Pulling the<br />
Needles from Haystacks. Jeffrey R.<br />
Enders, Cody R. Goodwin, Christina<br />
C. Marasco, Kevin T. Seale, John P.<br />
Wikswo, and John A. McLean. July,<br />
p. 18.<br />
Analytical Strategies in the Development<br />
of Generic Drug Products: The Role<br />
of Chromatography and Mass Spectrometry.<br />
Arindam Roy and Srinivasa<br />
Gorla. October, p. 29.<br />
Comparison of Extracts from Dry and<br />
Alcohol-Steamed Root of Polygonatum<br />
kingianum (Huang Jing) by<br />
Sub-2-µm-LC–TOF-MS. Kate Yu,<br />
Baiping Ma, HeShui Yu, Liping Kang,<br />
Jie Zhang, Yue Gao, and Alan Millar.<br />
March, p. 30.<br />
Comprehensive Analysis of Persistent Organic<br />
Pollutants in Complex Matrices<br />
Using GC with High-Performance<br />
TOF-MS. David E. Alonso, Joe Binkley,<br />
and Kevin Siek. July, p. 48.<br />
Creating a High-Throughput LC–MS-MS<br />
System Using Common Components.<br />
Lance Heinle and Gary Jenkins. October,<br />
p. 16.<br />
Determining High-Molecular-Weight<br />
Phthalates in Sediments Using GC–<br />
APCI-TOF-MS. Frank David, Pat Sandra,<br />
and Peter Hancock. May, p. 42.<br />
Food Metabolomics: Fact or Fiction? Leon<br />
Coulier, Albert Tas, and Uwe Thissen.<br />
May, p. 34.<br />
High-Definition Screening for Boar Taint<br />
in Fatback Samples Using GC–MS.<br />
Torsten Haas, Peter Boeker, Alun Cole,<br />
and Gerhard Horner. July, p. 38.<br />
High-Throughput Quantitative Analysis<br />
of Vitamin D Using a Multiple Parallel<br />
LC–MS System Combined with Integrated<br />
On-Line SPE. Adrian M. Taylor<br />
and Michael J.Y. Jarvis. May, p. 12.<br />
25-Hydroxyvitamin D 2<br />
/D 3<br />
Analysis in<br />
Human Plasma Using LC–MS. Phil<br />
Koerner and Michael McGinley.<br />
March, p. 8.<br />
Imaging Mass Spectrometry: Current<br />
Performance and Upcoming Challenges.<br />
Pierre Chaurand. July, p. 30.<br />
Mass Spectrometry Advances Fossilomics.<br />
John M. Asara. March, p. 18.<br />
Mass Spectrometry in Analytical Lipidomics.<br />
Luis Cuadros-Rodriguez,
www.spectroscopyonline.com<br />
December 2011 <strong>Spectroscopy</strong> 26(12) 35<br />
Alegria Carrasco-Pancorbo, and<br />
Natalia Navas Iglesias. July, p. 8.<br />
Mass Spectrometry of Organic Molecules<br />
and Laser-Induced Acoustic<br />
Desorption: Applications, Mechanisms,<br />
and Perspectives. Alexander<br />
Zinovev and Igor Veryovkin. July, p.<br />
24.<br />
Matrix-Assisted Laser Desorption-<br />
Ionization Imaging Mass Spectrometry<br />
for Direct Tissue Analysis.<br />
J.D. Pallua, G. Schaefer, L.K.<br />
Bittner, C. Pezzei, V. Huck-Pezzei,<br />
S.A. Schoenbichler, S. Meding, S.<br />
Rauser, A. Walch, M. Handler, M.<br />
Netzer, M. Osl, M. Seger, B. Pfeifer,<br />
C. Baumgartner, H. Lindner, L.<br />
Kremser, B. Sarg, H. Klocker, G.<br />
Bartsch, G.K. Bonn, and C.W. Huck.<br />
October, p. 21.<br />
Metabolomics Workflows: Combining<br />
Untargeted Discovery-Based and<br />
Targeted Confirmation Approaches<br />
for Mining Metabolomics Data. Theodore<br />
Sana, Steve Fischer, and Shane<br />
E. Tichy. March, p. 12.<br />
A New Path to High-Resolution HPLC–<br />
TOF-MS — Survey, Targeted, and<br />
Trace Analysis Applications of TOF-<br />
MS in the Analysis of Complex Biochemical<br />
Matrices. Jeffrey S. Patrick,<br />
Kevin Siek, Joe Binkley, Viatcheslav<br />
Artaev, and Michael Mason. May, p.<br />
18.<br />
On- and Off-Line Coupling of Separation<br />
Techniques to Ambient Ionization<br />
Mass Spectrometry. Li Li and<br />
Kevin Schug. October, p. 8.<br />
Probing Aqueous Surfaces by TOF-<br />
SIMS. Xiao-Ying Yu, Li Yang, Zihua<br />
Zhu, James P. Cowin, and Martin J.<br />
Iedema. October, p. 34.<br />
Responding to Data Analysis and Evaluation<br />
Challenges in Mass Spectrometry–Based<br />
Methods for High-<br />
Throughput Proteomics. Laurence<br />
M. Brill. March, p. 36.<br />
Review of the 59th Annual ASMS Conference.<br />
Megan Evans. July, p. 54.<br />
A Sensitive, Specific, Accurate, and Fast<br />
LC–MS-MS Method for Measurement<br />
of Ethyl Glucuronide and Ethyl<br />
Sulfate in Human Urine. Shuguang<br />
Li, Jeff Layne, Sky Countryman, and<br />
Michael McGinley. July, p. 42.<br />
Single Multipoint Calibration Curve<br />
for Discovery Bioanalysis. Benjamin<br />
Begley and Michael Koleto.<br />
May, p. 8.<br />
Time-Resolved SRM Analysis and<br />
Highly Multiplexed LC–MS-MS for<br />
Quantifying Tryptically Digested<br />
Proteins. Richard G. Kay, James W.<br />
Howard, and Steve Pleasance. March,<br />
p. 24.<br />
Why Use Signal-To-Noise As a Measure<br />
of MS Performance When It Is Often<br />
Meaningless? Greg Wells, Harry<br />
Prest, and Charles William Russ IV.<br />
May, p. 28.<br />
SUPPLEMENT: DEFENSE AND<br />
HOMELAND SECURITY<br />
Advances in <strong>Spectroscopy</strong> for Detection<br />
and Identification of Potential Bioterror<br />
Agents. Eric W. Fisher. April, p.<br />
29.<br />
Detecting Explosives by Portable<br />
Raman Analyzers: A Comparison<br />
of 785-, 976-, 1064-, and 1550-nm<br />
(Retina-Safe) Laser Excitation. Michael<br />
Donahue, Hermes Huang, Carl<br />
Brouillette, Wayne Smith, and Stuart<br />
Farquharson. April, p. 24.<br />
Detection of Chemicals with Standoff<br />
Raman <strong>Spectroscopy</strong>. Anupam K.<br />
Misra, Shiv K. Sharma, Tayro E.<br />
Acosta, and David E. Bates. April,<br />
p. 18.<br />
Explosives Sensing Using Multiple<br />
Optical Techniques in a Standoff<br />
Regime with a Common Platform.<br />
Alan R. Ford, Robert D. Waterbury,<br />
Darius M. Vunck, Jeremy B. Rose,<br />
Thomas B. Blank, Ken R. Pohl,<br />
Troy A. McVay, Edwin L. Dottery,<br />
Mikella E. Hankus, Ellen L.<br />
Holthoff, Paul M. Pellegrino, Steve<br />
D. Christesen, and Augustus W.<br />
Fountain III. April, p. 6.<br />
Mid-Infrared Vibrational <strong>Spectroscopy</strong><br />
Standoff Detection of Highly Energetic<br />
Materials: New Developments.<br />
Samuel P. Hernández-Rivera, John R.<br />
Castro-Suarez, Leonardo C. Pacheco-<br />
Londoño, Oliva M. Primera-Pedrozo,<br />
Nicolas Rey-Villamizar, Miguel<br />
Vélez-Reyes, and Max Diem. April,<br />
Digital Edition.<br />
Monitoring of Biological Matrices by<br />
GC–MS-MS for Chemical Warfare<br />
Nerve Agent Detection. Jeffrey M.<br />
McGuire, Jr., Edward M. Jakubowski,<br />
and Sandra A. Thomson. April, p. 12.<br />
SUPPLEMENT: FT-IR TECHNOLOGY<br />
FOR TODAY’S SPECTROSCOPISTS<br />
Contact and Orientation Effects in<br />
FT-IR ATR Spectra. Richard Spragg.<br />
August, p. 18.<br />
GPC-IR Hyphenated Technology to<br />
Characterize Copolymers and to<br />
Deformulate Complex Polymer Mixtures<br />
in Polymer-Related Industries.<br />
William W. Carson and Ming Zhou.<br />
August, p. 28.<br />
NIR Monitoring of a Hot-Melt Extrusion<br />
Process. Brandye Smith-Goettler,<br />
Colleen M. Gendron, Neil MacPhail,<br />
Robert F. Meyer, and Joseph X. Phillips.<br />
August, p. 8.<br />
Using Real-Time FT-IR to Characterize<br />
UV Curable Optical Adhesives. Steve<br />
Lowry and Forrest Weesner. August,<br />
p. 40.<br />
SUPPLEMENT: RAMAN<br />
TECHNOLOGY FOR TODAY’S<br />
SPECTROSCOPISTS<br />
Comparison of Laboratory and Handheld<br />
Raman Instruments for the Identification<br />
of Counterfeit Medicines. Sulaf<br />
Assi, Robert Watt, and Tony Moffat.<br />
June, p. 36.<br />
Looking Below the Surface of Breast<br />
Tissue During Surgery. Anita Mahadevan-Jansen,<br />
Matthew D. Keller,<br />
Elizabeth Vargis, Brittany Caldwell,<br />
The-Quyen Nguyen, Nara de Matos<br />
Granja, Melinda Sanders, and Mark<br />
C. Kelley. June, p. 48.<br />
Raman <strong>Spectroscopy</strong> of Supported Lipid<br />
Bilayer Nanoparticles. Selver Ahmed,<br />
Stephanie L. Wunder, and Zhorro S.<br />
Nickolov. June, p. 8.<br />
Raman <strong>Spectroscopy</strong> Using a Fixed-Grating<br />
Spatial Heterodyne Interferometer.<br />
Nathaniel R. Gomer, Christopher M.<br />
Gordon, Paul Lucey, Shiv K. Sharma, J.<br />
Chance Carter, and S. Michael Angel.<br />
June, p. 22.<br />
X-RAY SPECTROSCOPY<br />
The Dynamic World of X-ray Fluorescence.<br />
Laura Bush. July, p. 40. ◾<br />
For more information on this topic,<br />
please visit our homepage at:<br />
www.spectroscopyonline.com
36 SpectroScopy corporAte cApABILItIeS DECEMBER 2011<br />
1st Detect Corp<br />
www.spectroscopyonline.com<br />
Company Description<br />
1st Detect Corp, a division of Astrotech Corp., is leveraging advances in chemical detection technology<br />
from the space program to offer highly advanced, next generation chemical detection and analysis<br />
instrumentation.<br />
Chief Spectroscopic Techniques Supported<br />
⦁ Miniature mass spectrometry<br />
1st Detect Corp<br />
907 Gemini Ave<br />
Houston TX 77058<br />
Telephone<br />
(972) 617-9939<br />
FAx<br />
(713) 558-5963<br />
e-mAIl<br />
info@1stdetect.com<br />
Web sITe<br />
www.1stdetect.com<br />
usA employees:<br />
16<br />
Markets Served<br />
⦁ Security, Defense<br />
⦁ Industrial process control<br />
⦁ Petrochemical<br />
⦁ Pharmceutical<br />
⦁ Environmetal<br />
Major Products/Services<br />
The Miniature Chemical Detector from 1st Detect is an ion-trap mass spectrometer designed for<br />
field-portable and benchtop applications such as industrial process control, security and defense,<br />
first response and critical infrastructure monitoring, and medical diagnostics and analysis. The instrument<br />
has a weight of 15 lb, a mass range of 10–450 amu, and a resolution of less than 1 amu.<br />
It provides ppb level analysis in less than 2 s, with ppt analysis in 30 s with the optional preconcentrator.<br />
The instrument can be operated with power supplies including 120/240 V AC, 24 V DC, or<br />
supplied batteries.<br />
employees ouTsIDe usA:<br />
2<br />
yeAr FounDeD<br />
2007
www.spectroscopyonline.com<br />
Agilent Technologies, Inc.<br />
DECEMBER 2011 SpectroScopy corporAte cApABILItIeS 37<br />
Agilent Technologies, Inc.<br />
5301 Stevens Creek Blvd<br />
Santa Clara, CA 95052<br />
Telephone<br />
(800) 227-9770<br />
FAx<br />
(302) 633-8901<br />
e-mAIl<br />
cag_sales-na@agilent.com<br />
Web sITe<br />
www.agilent.com<br />
number oF us employees<br />
6000<br />
employees ouTsIDe usA<br />
12,500<br />
yeAr FounDeD<br />
1999<br />
Company Description<br />
Agilent Technologies, Inc. (NYSE:A) is a global leader of measurement<br />
technology for life sciences, chemical analysis, communciations,<br />
and electronics. The company’s 18,500<br />
employees serve customers in more than 110 countries. In<br />
fiscal 2010, Agilent had net revenues of $5.4 billion USD.<br />
Agilent’s life sciences group and chemical analysis group are<br />
leading global providers of instrumentation, consumables,<br />
software, and services to analytical chemistry and life science<br />
research laboratories.<br />
Chief Spectroscopic Techniques Supported<br />
⦁ GC<br />
⦁ GC–MS<br />
⦁ LC<br />
⦁ LC–MS<br />
⦁ SFC<br />
⦁ Capillary electrophoresis<br />
Markets Served<br />
⦁ Food safety and quality<br />
⦁ Environmental testing<br />
⦁ Energy/petrochemical<br />
⦁ Forensics<br />
⦁ Pharmaceutical<br />
⦁ Materials science<br />
⦁ Drug discovery<br />
⦁ Genomics<br />
⦁ Proteomics<br />
⦁ Metabolomics<br />
⦁ Emerging life sciences<br />
⦁ Integrated biology<br />
Major Products/Services<br />
1200 Infinity LC systems (including 1290<br />
UHPLC); 7890A GC; 5975C GC–MS; 7000<br />
Series Triple Quadrupole GC–MS; 6100<br />
Series Single Quadrupole LC–MS; 6200<br />
Series Accurate Mass Mass TOF LC–MS;<br />
6400 Series Triple Quadrupole LC–MS;<br />
6500 Series Accruate Mass Q-TOF LC–MS;<br />
7500 Series ICP-MS; OpenLAB chromatography<br />
data systems; OpenLAB ELN electronic<br />
lab notebook; OpenLAB Enterprise<br />
Content Management System; Automation<br />
systems for life sciences; Genomic microarrays,<br />
target enrichment and reagents;<br />
GeneSpring bioinformatics; qPCR; NMR<br />
and MRI systems; Services and support;<br />
Vacuum systems.<br />
Facility<br />
Major facilities in Santa Clara, California;<br />
Wilmington, Delaware; Waldbronn,<br />
Germany; Tokyo, Japan; and Shanghai,<br />
China.
38 SpectroScopy corporAte cApABILItIeS DECEMBER 2011 www.spectroscopyonline.com<br />
ABB Analytical Measurements<br />
Markets Served<br />
⦁ Laboratory and academic<br />
⦁ Life sciences<br />
⦁ Pharmaceutical<br />
⦁ Fine chemicals, specialty chemicals,<br />
and commodity chemicals<br />
⦁ Refining and petrochemicals<br />
⦁ Metallurgical<br />
⦁ Semiconductor<br />
⦁ Original equipment manufacturer<br />
(OEM)<br />
⦁ Remote sensing and aerospace<br />
Abb Analytical<br />
measurements<br />
585 boul. Charest E.<br />
Suite 300<br />
Quebec, QC G1K 9H4<br />
Canada<br />
Telephone<br />
(418) 877-2944<br />
FAx<br />
(418) 877-2834<br />
e-mAIl<br />
ftir@ca.abb.com<br />
Web sITe<br />
www.abb.com/analytical<br />
number oF employees<br />
200<br />
yeAr FounDeD<br />
1973<br />
Company Description<br />
ABB Analytical Measurements enables scientists around the<br />
world to perform through excellence in infrared spectroscopy.<br />
ABB is a market leader in Fourier transform infrared (FT-IR and<br />
FT-NIR) in terms of reliability and reproducibility. ABB Analytical<br />
designs, manufactures, and markets high-performance, affordable<br />
spectrometers as well as turnkey analytical solutions and<br />
spectroradiometers for remote sensing. ABB Analytical<br />
capabilities encompass one of the largest portfolios in the world<br />
for laboratory, at-line, and process FT-IR analyzers. They perform<br />
real-time analysis of the chemical composition and/or physical<br />
properties of a process sample stream.<br />
Chief Spectroscopic Techniques Supported<br />
⦁ FT-IR<br />
⦁ FT-NIR<br />
⦁ Spectroradiometry and remote sensing<br />
⦁ Dedicated team of engineers offering simple and<br />
dependable solutions with reliable instruments<br />
⦁ Local point of contact for field service and technical<br />
support in most countries around the world with<br />
inventories for parts on all continents<br />
Major Products/Services<br />
ABB’s advanced solutions combine<br />
analyzers, advanced process control, data<br />
management, and process and application<br />
knowledge to improve the operational<br />
performance, productivity, capacity,<br />
and safety of industrial processes for<br />
customers. For all laboratory or process<br />
needs, ABB can be your partner and single-source<br />
provider of simple, low-cost,<br />
high performance, general-purpose FT-IR<br />
and FT-NIR spectrometers. The company<br />
also markets analyzers for hydrogen and<br />
inclusion measurement in liquid<br />
aluminum.<br />
Facility<br />
Our manufacturing facility located in<br />
Quebec City, Canada, employs more than<br />
200 people, including R&D, manufacturing,<br />
marketing, sales, and administrative groups.<br />
The ABB Group of companies operates in<br />
around 100 countries and employs about<br />
130,000 people.
FT-NIR QA software with intuitive workflow<br />
and superior ease of use?<br />
Absolutely.<br />
Intuitive workflow with integrated MB3600 instrument and accessory control<br />
make running QA applications simple for your operators and reliable for you.<br />
From collecting reference data and designing your QA applications to deployment<br />
of turnkey QA methods Horizon MB QA will guide you every step of the way.<br />
Support for customized messages in any language makes your operators feel<br />
right at home from day one.<br />
Horizon MB QA brings intuitive workflows and superior ease of use<br />
to QA method development and deployment.<br />
Discover how ABB helps its customers overcome their technical challenges:<br />
www.abb.com/analytical<br />
ABB Analytical Measurement<br />
Phone: +1 418-877-2944<br />
1 800 858-3847 (North America)<br />
Email: ftir@ca.abb.com
40 SpectroScopy corporAte cApABILItIeS DECEMBER 2011 www.spectroscopyonline.com<br />
Amptek, Inc.<br />
Completing Amptek’s XRF portable<br />
solutions for exact measurements are the<br />
USB controlled Mini-X X-ray tube and the<br />
XRF-FP Quantitative Analysis Software.<br />
Please visit our web site for complete<br />
specifications.<br />
Amptek, Inc.<br />
14 DeAngelo Drive<br />
Bedford, MA 01730<br />
Telephone<br />
( 781) 275-2242<br />
FAx<br />
( 781) 275-3470<br />
e-mAIl<br />
sales@amptek.com<br />
Web sITe<br />
www.amptek.com<br />
number oF employees<br />
47<br />
yeAr FounDeD<br />
1977<br />
Company Description<br />
Amptek, Inc. is a recognized world leader in the design<br />
and manufacture of state-of-the-art X-ray and gamma ray<br />
detectors, preamplifiers, instrumentation, and components<br />
for portable instruments, laboratories, satellites, and analytical<br />
purposes. These products provide the user with high<br />
performance and high reliability together with small size<br />
and low power.<br />
Chief Spectroscopic Techniques Supported<br />
X-ray fluorescence (EDXRF), direct spectral measurements,<br />
SEM, PIXE, and TXRF.<br />
Markets Served<br />
Amptek serves wherever X-ray detection is used; for example,<br />
hand-held and table-top XRF analyzers produced by OEMs;<br />
research facilities in universities, commercial enterprises<br />
and the military; nuclear medicine; space; museums;<br />
environmental monitoring; and geological analysis of soils<br />
and minerals.<br />
Major Products/Services<br />
Models Super XR-100SDD and XR-100CR are high<br />
performance X-ray detector systems featuring a wide range of<br />
detection areas and efficiency; resolution of 125 eV FWHM;<br />
and solid-state design. Power and shaping are provided by<br />
the PX5 Digital Pulse Processor. The XR-100 successfully analyzed<br />
the rocks and soil on Mars.<br />
The X-123 is a complete X-ray detector system in one<br />
small box that fits in your hand. The X-123 incorporates<br />
either the Amptek Si-Pin Diode Detector or Super Silicon<br />
Drift Detector; Charge Sensitive Preamplifier; the Amptek<br />
DP5 Digital Pulse Processor and MCA; and the Amptek PC5<br />
Power Supply. This small, low power, easy to operate, highperformance<br />
instrument is ideal for both the laboratory and<br />
OEM industries.<br />
Applications<br />
⦁ X-Ray fluorescence<br />
⦁ Process control<br />
⦁ OEM instrumentation<br />
⦁ RoHS/WEEE compliance testing<br />
⦁ Nondestructive analysis with XRF<br />
⦁ Restricted metals detection<br />
⦁ Environmental monitoring<br />
⦁ Medical and nuclear electronics<br />
⦁ Heavy metals in plastics<br />
⦁ Lead detectors<br />
⦁ Toxic dump site monitoring<br />
⦁ Semiconductor processing<br />
⦁ Nuclear safeguards verification<br />
⦁ Plastic & metal separation<br />
⦁ Coal & mining operations<br />
⦁ Sulfur in oil and coal detection<br />
⦁ Smoke stack analysis<br />
⦁ Plating thickness<br />
⦁ Oil logging<br />
⦁ Electro-optical systems<br />
⦁ Research experiments & teaching<br />
⦁ Art and archaeology<br />
⦁ Jewelry analysis
X-Ray Detectors<br />
t4PMJE4UBUF%FTJHO t64#$POUSPMMFE<br />
t-PX$PTUt&BTZUP6TF<br />
The PERFORMANCE You Need<br />
NEW SUPER SDD<br />
125 eV FWHM<br />
5.9<br />
LF7<br />
55<br />
Fe<br />
Si-PIN<br />
5.9<br />
LF7<br />
55<br />
Fe<br />
NN 2 YN<br />
TQFBLJOHUJNF<br />
1#3BUJP<br />
$PVOUT<br />
145 eV FWHM<br />
NN 2 YN<br />
TQFBLJOHUJNF<br />
1#3BUJP<br />
&OFSHZ LF7<br />
&OFSHZ LF7<br />
Complete XRF System<br />
The CONFIGURATION You Want<br />
OEM Components for XRF<br />
Complete<br />
X-Ray Spectrometer<br />
Our OEM Technology<br />
Your Products<br />
tTable-top XRF Analyzers<br />
tHand-held XRF Analyzers<br />
APPLICATIONS<br />
t0&.<br />
t93BZ'MVPSFTDFODF<br />
t1SPDFTT$POUSPM t3P)48&&&$PNQMJBODF5FTUJOH<br />
t-FBE%FUFDUPST t3FTUSJDUFE.FUBMT%FUFDUJPO<br />
t+FXFMSZ"OBMZTJT t)FBWZ.FUBMTJO1MBTUJD<br />
t1MBUJOH5IJDLOFTT t"SU"SDIBFPMPHZ<br />
AMPTEK Inc.<br />
www.amptek.com
42 SpectroScopy corporAte cApABILItIeS DECEMBER 2011 www.spectroscopyonline.com<br />
Andor Technology<br />
Andor Technology<br />
7 Millennium Way<br />
Springvale Business Park<br />
Belfast BT12 7AL<br />
United Kingdom<br />
Telephone<br />
(800) 296-1579<br />
e-mAIl<br />
marketing@andor.com<br />
Web sITe<br />
www.andor.com<br />
number oF employees<br />
321<br />
employees ouTsIDe usA<br />
270<br />
yeAr FounDeD<br />
1989<br />
Company Description<br />
Andor Technology is a world leader in the manufacturing of<br />
high performance VUV to SWIR modular spectroscopy<br />
detection solutions. Based around best-in-class, researchgrade<br />
CCDs, exclusive electron multiplying CCDs and<br />
intensified CCD detectors, as well as seamlessly configurable<br />
spectrographs and dedicated spectroscopy software, Andor’s<br />
robust detection solutions offer a unique combination of sensitivity,<br />
speed, and ease of use. Andor’s core technology<br />
Ultravac TM combines with the latest cutting-edge technology<br />
in the fields of sensors, electronics, optic, and software to<br />
deliver world-class, market-leading scientific spectroscopy<br />
detection systems to academics and industrial integrators.<br />
Chief Spectroscopic Techniques Supported<br />
⦁ Absorption – transmission – reflection (UV-NIR and SWIR)<br />
⦁ Raman (244 to 1064 nm)<br />
⦁ Fluorescence – luminescence (UV-NIR and SWIR)<br />
⦁ Micro-Raman and Micro-fluorescence<br />
⦁ Photon counting<br />
⦁ Single molecule spectroscopy<br />
⦁ Plasma studies<br />
⦁ Laser induced breakdown spectroscopy (LIBS)<br />
Markets Served<br />
In the analytical and life sciences markets, Andor products<br />
are particularly suited to fundamental research in the field of<br />
biology, nanotechnology, material characterization (polymers,<br />
semi-conductors), chemical analysis, and astronomy, as well<br />
as industrial applications such as food and safety, process<br />
control, drug screening, forensic, environment/water monitoring,<br />
and solar panel inspection.<br />
Major Products/Services<br />
Andor’s spectroscopy range features a high<br />
performance CCD platform (Newton) with<br />
dedicated spectroscopy EMCCD for rapid,<br />
light-starved applications. Andor’s most<br />
popular CCD/InGaAs platform is the iDus,<br />
for all general spectroscopy applications,<br />
alongside the market leading ICCD<br />
camera, iStar, for ns gated applications.<br />
The Shamrock family is Andor’s versatile<br />
spectrograph platform, with USB<br />
connectivity and seamless configuration<br />
with a wide range of accessories, including<br />
fiber optics bundles, and interface to<br />
microscopes. Solis software boasts a<br />
dedicated interface, integrating data<br />
acquisition and cameras/spectrometers<br />
simultaneous control. Andor’s X-Ray<br />
detector range features a wide range of<br />
direct/indirect detection options on the<br />
Newton and iKon platform.<br />
Facility<br />
Andor’s purpose-built 4650 m 2<br />
(50,000-square-foot) headquarters is<br />
based in Belfast, Northern Ireland. It<br />
hosts state-of-the-art 3000-square-foot<br />
Class 1000 and 100 clean rooms, and<br />
also provides a unique, 6-Sigma driven<br />
environment for streamlining of products<br />
design, manufacturing, and thorough QC<br />
testing of each system prior to shipment.
www.spectroscopyonline.com DECEMBER 2011 SpectroScopy corporAte cApABILItIeS 43<br />
Applied Photophysics<br />
Applied photophysics<br />
21 Mole Business Park<br />
Leatherhead, Surrey<br />
KT22 7BA<br />
United Kingdom<br />
Telephone<br />
+44 (0) 1372 386537<br />
Toll-free (from USA only)<br />
(800) 543-4130<br />
e-mAIl<br />
Sales Department:<br />
sales@ photophysics.com<br />
Technical Support:<br />
support@ photophysics.com<br />
Web sITe<br />
www.photophysics.com<br />
yeAr FounDeD<br />
1971<br />
Company Description<br />
Applied Photophysics (APL) has firmly established itself as a<br />
global developer and manufacturer of high quality, high performance,<br />
modern spectrometers by providing cutting-edge solutions<br />
and world-class support for bioscience and biopharmaceutical<br />
research both in academia and industry. From research through<br />
development to production, our scientific expertise and innovative<br />
solutions help life science researchers to understand complex biological<br />
systems, allowing them to be at the forefront of discovery.<br />
Chief Spectroscopic Techniques Supported<br />
⦁ Circular dichroism (CD) spectroscopy<br />
⦁ Stopped-flow spectroscopy<br />
⦁ Laser-flash spectroscopy<br />
Markets Served<br />
APL offers precision spectrometers to academic and industrial<br />
markets. The Chirascan range of CD spectrometers are now the<br />
instruments of choice for use in drug development, formulation<br />
testing, and quality control. The SX20 and LKS80 spectrometers<br />
are established leaders for stopped-flow and laser-flash research,<br />
addressing applications in protein structure, folding, and conformation,<br />
together with biomolecular reaction kinetics and the study<br />
of chemical reaction mechanisms.<br />
Major Products/Services<br />
Chirascan and Chirascan-plus (CD) spectrometers<br />
Outstanding sensitivity, novel detection technology, powerful<br />
software combine to make these CD spectrometers the world’s<br />
most advanced.<br />
NEW Chirascan-plus ACD spectrometer<br />
The world’s first and only ultra-sensitive,<br />
high-speed, automated CD spectrometer.<br />
This unique instrument significantly extends<br />
the scope and range of CD applications and<br />
delivers a minimum 50-fold increase in<br />
operator productivity.<br />
SX20 stopped-flow spectrometer<br />
The SX20 is the market-leading stopped-flow<br />
reaction analyzer capable of measuring fast<br />
reactions with a minimum of material.<br />
LKS80 nanosecond laser-flash<br />
photolysis spectrometer<br />
The new LKS80 offers even higher<br />
sensitivity than earlier models for studying<br />
by direct measurement the reactions of transient<br />
species such as radicals, excited states<br />
or ions, in chemical and biological systems.<br />
RX2000 rapid-mixing stopped-flow unit<br />
Adds stopped-flow rapid reaction kinetics to<br />
any UV-visible spectrometer or fluorometer.<br />
Pro-Data software<br />
All our products use a common software<br />
suite giving cross-platform compatibility.<br />
Accessories<br />
Maximize the capabilities and take full<br />
advantage of the potential built into your<br />
instrument with a wide range of accessories.<br />
Customer Support<br />
Support is provided for the lifetime of the<br />
product and every instrument comes with a<br />
warranty of at least 12 months that can be<br />
easily extended. A world-class service team is<br />
on hand for support and applications advice.<br />
Facilities<br />
Headquartered close to London, United<br />
Kingdom. APL has recently opened offices<br />
in China and the United States. See<br />
www.appliedphotophysics.com/company/authorized-agents<br />
for our worldwide<br />
distribution network.
44 SpectroScopy corporAte cApABILItIeS DECEMBER 2011 www.spectroscopyonline.com<br />
Avantes, Inc.<br />
developing research and teaching opportunities.<br />
Our OEM program is designed to work with<br />
our customers to identify needs and customize<br />
an Avantes’ spectroscopy solution based our<br />
customer’s needs and Avantes technical know<br />
experience. Avantes’ continued growth is based<br />
upon a commitment to providing exceptional<br />
technology and superb customer satisfaction.<br />
Avantes, Inc.<br />
9769 W. 119th Ave., Suite 4<br />
Broomfield, CO 80021<br />
Telephone<br />
(303) 410-8668<br />
FAx<br />
(303) 410-8669<br />
e-mAIl<br />
infoUSA@avantes.com<br />
Web sITe<br />
www.avantes.com<br />
number oF employees<br />
50<br />
yeAr FounDeD<br />
1993<br />
Company Description<br />
Avantes is a leading innovator in the development and<br />
application of miniatures pectrometers. Avantes continues<br />
to develop and introduce new instruments for fiber optic<br />
spectroscopy to meet our customer’s application needs.<br />
Avantes instruments and accessories are also deployed<br />
into a variety of OEM applications in a variety of industries<br />
in markets throughout the world. With more than 15 years<br />
of experience in fiber optic spectroscopy and thousands<br />
of instruments in the field, Avantes is eager to help our<br />
customers find their Solutions in <strong>Spectroscopy</strong> ® .<br />
Principal Spectroscopic Techniques Supported<br />
⦁ UV–vis/NIR spectroscopy<br />
⦁ Process control<br />
⦁ Absorbance/transmittance/reflectance<br />
⦁ Laser-induced breakdown spectroscopy<br />
⦁ CIE color spectroscopy<br />
⦁ Portable spectrometers<br />
⦁ Fluorescence spectroscopy<br />
⦁ Custom applications<br />
⦁ Irradiance<br />
⦁ Raman spectroscopy<br />
⦁ OEM application development<br />
Markets Served<br />
Avantes works with customers in a variety of markets, including<br />
chemical, biomedical, aerospace, semiconductor, gemological, paper,<br />
pharmaceutical, and food processing technology. Additionally,<br />
Avantes works with research organizations and universities, aiding in<br />
Major Products/Services<br />
Low-cost, high-resolution, miniature<br />
fiber optic spectrometers:<br />
System solutions and OEM instruments<br />
for applications from 185 nm to 2500<br />
nm. Detector choices: PDA, CMOS, CCD,<br />
back-thinned CCD, and InGaAs. Optical<br />
benches with focal lengths of 45, 50 or 75<br />
mm; revolutionary new ultra-low straylight<br />
optimized optical bench (ULS) and a new<br />
high sensitivity optical bench. Other features:<br />
14 and 16 bit A/D converters, TE cooling,<br />
multi-channel instrument configurations<br />
enabling simultaneous signal acquisition,<br />
USB2 communication, support for multiple<br />
instruments from a single computer, and 14<br />
programmable digital I/O ports.<br />
Standard application solutions:<br />
Irradiance and LED measurements,<br />
gemology, hemometric analysis, thin-film<br />
measurement, color, fluorescence, laserinduced<br />
breakdown spectroscopy, Raman<br />
spectroscopy, and process control.<br />
Light sources:<br />
Tungsten-halogen, Deuterium, LED, and<br />
Xenon calibration sources for wavelength<br />
and irradiance.<br />
Facility<br />
Avantes engineering, manufacturing,<br />
sales, and service headquarters is in the<br />
Netherlands. The company also operates<br />
direct offices in China and North America. In<br />
addition, Avantes has a growing worldwide<br />
distribution network of more than 35<br />
qualified distributors to meet our customer’s<br />
needs worldwide.
www.spectroscopyonline.com<br />
B&W Tek, Inc.<br />
DECEMBER 2011 SpectroScopy corporAte cApABILItIeS 45<br />
Major Products/Services<br />
⦁ Fiber coupled spectrometer modules<br />
⦁ Diode and DPSS Lasers<br />
⦁ Laboratory, portable, and handheld<br />
Raman spectrometers<br />
⦁ Customized design and development<br />
services<br />
⦁ Customized photonic instrumentation<br />
manufacturing<br />
Facilities<br />
B&W Tek boasts three United States facilities<br />
in Delaware (2) and New Jersey (1), a sales<br />
office in Lubeck, Germany, two facilities in<br />
Shanghai, China, and another office in<br />
Saitama, Japan. Most of our engineering,<br />
design, and manufacturing takes place in our<br />
Newark, Delaware headquarters location.<br />
b&W Tek, Inc.<br />
19 Shea Way<br />
Newark, DE 19713<br />
Telephone<br />
(302) 368-7824<br />
FAx<br />
(302) 368-7830<br />
e-mAIl<br />
sales@bwtek.com<br />
Web sITe<br />
www.bwtek.com<br />
number oF employees<br />
USA: 80<br />
Elsewhere: 100<br />
yeAr FounDeD<br />
1997<br />
Company Description<br />
B&W Tek is an advanced instrumentation company producing<br />
optical spectroscopy, laser instrumentation, and portable/lab<br />
grade Raman systems. B&W Tek provides spectroscopy and<br />
laser solutions for the pharmaceutical, biomedical, physical,<br />
chemical, LED lighting, and research communities. Our commitment<br />
to innovating solutions has made B&W Tek a leader<br />
in Raman spectroscopy solutions worldwide. With a strong<br />
vertical integration capability, B&W Tek, Inc. also provides<br />
custom product development, design, and manufacturing. In<br />
addition, B&W Tek has recently introduced the NanoRam TM ,<br />
the most sensitive and repeatable handheld Raman<br />
spectrometer ever designed for identifying harmful, nonconforming<br />
materials before they reach production.<br />
Chief Spectroscopic Techniques Supported<br />
⦁ UV<br />
⦁ Visible<br />
⦁ NIR<br />
⦁ Raman<br />
⦁ Microscopy<br />
Markets Served<br />
B&W Tek provides solutions for analytical, industrial, medical,<br />
biophotonic, and diagnostic applications. Our products are used<br />
in markets such as semiconductor, solar, pharmaceuticals, LED<br />
lighting, specialty chemicals, academic labs, government labs, and<br />
medical and biomedical development and manufacturing.
46 SpectroScopy corporAte cApABILItIeS DECEMBER 2011 www.spectroscopyonline.com<br />
Bruker Daltonics<br />
Markets Served<br />
Bruker Daltonics’ mass spectrometers are<br />
a powerful tool for a wide variety of<br />
applications with different analytical<br />
challenges.<br />
Our analytical systems combine high<br />
performance mass spectrometers,<br />
software, and accessories to deliver<br />
answers for a broad range of areas<br />
including:<br />
⦁ Proteomics and protein analysis<br />
⦁ Clinical diagnostics<br />
⦁ Drug metabolism studies<br />
⦁ Food/environmental applications<br />
⦁ Chemistry support and chemical analysis<br />
⦁ Petroleomics<br />
⦁ Forensics<br />
bruker Daltonics<br />
40 Manning Road<br />
Billerica, MA 01821<br />
Telephone<br />
(978) 663-3660<br />
FAx<br />
(978) 667-5993<br />
e-mAIl<br />
ms-sales@bdal.com<br />
Web sITe<br />
www.bruker.com/ms<br />
Company Description<br />
Bruker Daltonics provides a variety of innovative mass<br />
spectrometry systems. Our powerful, yet easy to implement,<br />
products are specifically designed to meet the rapidly<br />
growing needs of customers in the academic, pharmaceutical,<br />
industrial, and clinical areas.<br />
Consistently and expertly supported, our turn-key system<br />
solutions and complete workflows offer integrated instrument<br />
and software tools which enhance the productivity and<br />
capabilities of any analytical operation.<br />
Bruker Daltonics product lines include platforms representing<br />
many types of separation technologies and mass<br />
spectrometry including:<br />
⦁ Matrix assisted laser desorption ionization time-of-flight<br />
mass spectrometer (MALDI-TOF and MALDI-TOF/TOF)<br />
⦁ Electrospray ionization (ESI), ion trap mass spectrometer<br />
⦁ ESI-TOF, and ESI-quadrupole TOF (qTOF) mass spectrometers<br />
⦁ Ultra high resolution TOF (UHR-TOF) mass spectrometer<br />
⦁ Fourier transform mass spectrometer (FTMS)<br />
⦁ Inductively coupled plasma mass spectrometer (ICP-MS)<br />
⦁ Gas chromatograph with single and triple quadrupole mass<br />
spectrometer (GC–MS)<br />
⦁ Gas chromatograph (GC)<br />
⦁ Nano-LC<br />
Facilities<br />
Bruker Daltonics is headquartered in<br />
Billerica, Massachusetts with a sales,<br />
service, and applications facility in<br />
Fremont, California, as well as major<br />
facilities in Germany (Bremen and Leipzig)<br />
and the United Kingdom. A global network<br />
of demonstration, sales, and service sites<br />
provides complete worldwide support for<br />
all our products and services.
Setting the Benchmark<br />
in ICP-MS: aurora m90<br />
Bruker continues to find new and novel ways to meet your changing<br />
needs. As a leader in elemental analysis you can be assured that when<br />
you buy a Bruker ICP-MS, you’re buying more than just an instrument.<br />
You’re buying a relationship with one of the most respected and<br />
experienced instrument companies in the world.<br />
Contact us today at ms-sales@bdal.com or visit us on the web at<br />
www.bruker.com/ms<br />
Innovation with Integrity<br />
ICP-MS
48 SpectroScopy corporAte cApABILItIeS DECEMBER 2011 www.spectroscopyonline.com<br />
Bruker Corporation<br />
⦁ Nuclear magnetic resonance (NMR)<br />
⦁ Electron paramagnetic resonance<br />
(EPR)<br />
⦁ Magnetic resonance imaging (MRI)<br />
⦁ Low resolution benchtop NMR<br />
analyzers<br />
⦁ X-ray crystallography (SC-XRD)<br />
⦁ X-ray diffraction (XRD)<br />
⦁ X-ray fluorescence (XRF)<br />
⦁ Handheld X-ray (XRF) spectrometers<br />
⦁ X-ray microanalysis (EDS, EBSD)<br />
⦁ Optical emission spectroscopy (OES)<br />
⦁ CS/ONH-Analysis<br />
⦁ Atomic force microscopy (AFM)<br />
⦁ Scanning probe microscopy (SPM)<br />
⦁ Stylus and optical metrology<br />
bruker Corporation<br />
40 Manning Road<br />
Billerica, MA 01821<br />
Telephone<br />
(978) 663-3660<br />
FAx<br />
(978) 667-5993<br />
e-mAIl<br />
info@bruker.com<br />
Web sITe<br />
www.bruker.com<br />
Company Description<br />
The Bruker name has become synonymous with the excellence,<br />
innovation, and quality that characterizes our comprehensive<br />
range of scientific instrumentation. Our solutions<br />
encompass a wide number of analytical techniques ranging<br />
from magnetic resonance to mass spectrometry, to optical<br />
and X-ray spectroscopy.<br />
These market- and technology-leading products are driving<br />
and facilitating many key application areas such as life<br />
science research, pharmaceutical analysis, applied analytical<br />
chemistry applications, materials research and nanotechnology,<br />
clinical research, molecular diagnostics, and homeland<br />
defense.<br />
Visit our website to discover more about our technologies<br />
and solutions.<br />
Bruker — Innovation with Integrity!<br />
Chief Spectroscopic Techniques Supported<br />
⦁ FT-infrared spectroscopy and microscopy (FT-IR)<br />
⦁ FT-near infrared spectroscopy (FT-NIR)<br />
⦁ Raman spectroscopy and microscopy<br />
⦁ Terahertz spectroscopy and imaging<br />
⦁ Liquid chromatography–mass spectrometry (LC–MS)<br />
⦁ FT-mass spectrometry (FTMS)<br />
⦁ MALDI-TOF (/TOF) mass spectrometry<br />
⦁ Inductively coupled plasma mass spectrometry (ICP-MS)<br />
⦁ Gas chromatography–mass spectrometry (GC–MS)<br />
⦁ Ion mobility spectrometry (IMS)
www.spectroscopyonline.com<br />
CVI melles Griot lasers<br />
2051 Palomar Airport Road, 200<br />
Carlsbad, CA 92011<br />
Telephone<br />
(760) 438-2131<br />
e-mAIl<br />
lasers@cvimellesgriot.com<br />
CVI melles Griot<br />
optics & Assemblies:<br />
200 Dorado Place SE<br />
Albuquerque, NM 87123<br />
Telephone<br />
(505) 296-9541<br />
e-mAIl<br />
optics@cvimellesgriot.com<br />
Web sITe<br />
www.cvimellesgriot.com<br />
AsIA<br />
+81 3 3407-3614<br />
europe<br />
+31 316 333 041<br />
CVI Melles Griot<br />
Company Description<br />
CVI Melles Griot is a leading global supplier of OEM and fast<br />
turn catalog photonics products including lasers at over 38<br />
wavelengths, optics, coatings covering the deep ultraviolet<br />
to the infrared, opto-mechanics, and positioning equipment.<br />
The company’s unique breadth of manufacturing and design<br />
expertise in electronics, lasers, optics, coatings, and thermal<br />
management is evident in everything from simple components<br />
to precision integrated electro-optic assemblies.<br />
Chief Spectroscopic Techniques Supported<br />
⦁ <strong>Spectroscopy</strong>; Microscopy<br />
⦁ Capillary electrophoresis<br />
⦁ Biotech/Medical<br />
⦁ Laser-induced fluorescence<br />
⦁ Pharmaceutical<br />
⦁ Particle characterization<br />
⦁ Semiconductor<br />
⦁ Non-contact inspection<br />
⦁ Industrial<br />
⦁ Interferometry<br />
⦁ Environmental<br />
⦁ Velocimetry<br />
⦁ Government/Military<br />
Markets Served<br />
⦁ Design, development, and manufacturing on 3 continents<br />
⦁ Lasers, optics, thin films, mechanics, drive electronics<br />
⦁ Over 39 years of volume production<br />
⦁ Over 2.9 million lasers and 120 million optics shipped<br />
⦁
50 SpectroScopy corporAte cApABILItIeS DECEMBER 2011 www.spectroscopyonline.com<br />
EDAX, Inc.<br />
eDAx, Inc.<br />
91 McKee Drive<br />
Mahwah, NJ 07430<br />
Telephone<br />
(201) 529-4880<br />
FAx<br />
(201) 529-3156<br />
e-mAIl<br />
info@amtek.com<br />
Web sITe<br />
www.edax.com<br />
yeAr FounDeD<br />
1962<br />
Company Description<br />
EDAX, Inc. is an ISO-9001 certified manufacturer with over 50<br />
years of experience building instrumentation for the elemental<br />
and structural analysis of materials. EDAX’s founding technology<br />
was the detection and measurement of fluorescent X-rays for<br />
qualitative and quantitative elemental analysis — for example,<br />
elemental analysis on electron beam microscopes. Since that<br />
time, EDAX has sought to expand our product offering through<br />
new technologies and complementary techniques to provide our<br />
customers with the latest analytical instrumentation available.<br />
EDAX continues to be a world leader in materials analysis<br />
providing both stand-alone micro-XRF systems and microscopemounted<br />
tools.<br />
Chief Spectroscopic Techniques Supported<br />
⦁ Energy dispersive spectroscopy<br />
⦁ Energy dispersive X-ray fluorescence<br />
⦁ Electron back scatter diffraction<br />
⦁ Wavelength dispersive spectroscopy<br />
Markets Served<br />
EDAX instrumentation for elemental and structural analysis is<br />
found in a broad spectrum of industrial, academic, and government<br />
applications from the field or warehouse to the most<br />
advanced research and development laboratory. Typical markets<br />
served include semiconductor and microelectronics, academic,<br />
and industrial R&D laboratories, ROHS/WEEE, renewable energy,<br />
pharmaceuticals, mining, security, forensics, catalysts,<br />
petrochemicals, metallurgy, and manufacturing operations.<br />
Major Products/Services<br />
⦁ Energy dispersive X-ray fluorescence:<br />
EDAX manufactures micro XRF<br />
analyzers for the laboratory.<br />
⦁ Electron backscatter diffraction: EDAX<br />
supplies instrumentation for materials<br />
structural analysis on SEM electronbeam<br />
microscopes.<br />
⦁ Energy dispersive spectroscopy: EDAX<br />
provides a full range of EDS products<br />
for elemental analysis on SEM and TEM<br />
electron-beam microscopes.<br />
⦁ Wavelength dispersive spectroscopy:<br />
EDAX offers parallel beam WDS products<br />
for elemental analysis on SEM<br />
electron-beam microscopes.<br />
⦁ Fluorescent X-ray detectors: EDAX<br />
supplies Si(Li) detectors and silicon drift<br />
detectors, which are capable of handling<br />
count rates of over 1,000,000 cps<br />
and parallel beam wavelength<br />
dispersive spectrometers.<br />
Facilities<br />
EDAX headquarters is located in Mahwah,<br />
New Jersey, housing sales, technical<br />
support, and manufacturing operations.<br />
EDAX is committed to providing the best<br />
possible support for our customers worldwide<br />
with sales, service, and applications<br />
support offices located in Japan, China,<br />
Singapore, The Netherlands, Germany, the<br />
United Kingdom, and the United States.
is Puts a New Spin on<br />
Micro XRF Analysis Versatility<br />
on-Destructive<br />
Micro to Millimeter<br />
Spot Elemental Analysis<br />
Using Primary Beam<br />
Filters on a Wide Range<br />
of Sample Types<br />
Forensics<br />
Trace Evidence, Solids, Residues,<br />
Powders, Liquids<br />
Industrial<br />
RoHS-WEEE, Quality Control, Failure Analysis,<br />
Coating Thickness/Composition<br />
Antiquities/Museum<br />
Artifact Authentication, Gemstones, Documents
52 SpectroScopy corporAte cApABILItIeS DECEMBER 2011<br />
Edinburgh Instruments<br />
www.spectroscopyonline.com<br />
⦁ Fluorescence spectrometers (lifetime,<br />
phosphorescence only)<br />
⦁ Laser flash photolysis spectrometers<br />
⦁ CO and CO 2<br />
lasers<br />
⦁ Pulsed gas lasers<br />
⦁ Optically pumped lasers<br />
⦁ Picosecond light sources<br />
Facilities<br />
Edinburgh Instruments (EI) is now located<br />
in purpose built 12,800-square-foot facilities<br />
just outside Edinburgh, United Kingdom,<br />
where it employs over 70 people.<br />
The company is involved in the development,<br />
manufacture, and sale of a wide<br />
range of high technology products for the<br />
scientific research and industrial markets.<br />
edinburgh Instruments<br />
2 Bain Square<br />
Kirkton Campus<br />
Livingston EH547DQ<br />
UK<br />
Telephone<br />
44(0) 1506425300<br />
FAx<br />
44(0) 1506425320<br />
e-mAIl<br />
sales@edinst.com<br />
Web sITe<br />
www.edinburghphotonics.com<br />
number oF employees<br />
70<br />
yeAr FounDeD<br />
1971<br />
Company Description<br />
Edinburgh Instruments Ltd. is a global provider of sophisticated<br />
luminescence and fluorescence instrumentation and lasers.<br />
Our products are suitable for a wide range of applications these<br />
include scientific R&D, commercial research, process industries,<br />
environmental monitoring, and other applications. Combined<br />
with our reputation for delivering trustworthy, high-quality, high<br />
performance products our service excellence has helped<br />
establish Edinburgh Instruments as an innovative leading light in<br />
the marketplace. Edinburgh Instruments has a global reputation<br />
for excellence. Excellence in product. Excellence in service.<br />
Excellence in expertise.<br />
Chief Spectroscopic Techniques Supported<br />
⦁ Fluorescence spectrometers — steady state, lifetime, and<br />
phosphorescence<br />
⦁ Laser flash photolysis<br />
Markets Served<br />
⦁ Scientific research and industrial markets<br />
⦁ Photophysics<br />
⦁ Photochemistry<br />
⦁ Biophysics<br />
⦁ Biochemistry<br />
⦁ Semiconductor physics<br />
Major Products/Services<br />
⦁ Fluorescence spectrometers (steady state, lifetime,<br />
phosphorescence)<br />
⦁ Fluorescence spectrometers (lifetime only)
www.spectroscopyonline.com<br />
Energetiq Technology, Inc.<br />
DECEMBER 2011 SpectroScopy corporAte cApABILItIeS 53<br />
energetiq Technology, Inc.<br />
7 Constitution Way<br />
Woburn, MA 01801<br />
Telephone<br />
(781) 939-0763<br />
FAx<br />
(781) 939-0769<br />
e-mAIl<br />
info@energetiq.com<br />
Web sITe<br />
www.energetiq.com<br />
yeAr FounDeD<br />
2004<br />
Company Description<br />
Energetiq Technology is a developer and manufacturer of<br />
ultrahigh-brightness light sources that enable the manufacture<br />
and analysis of nano-scale structures and products. Used<br />
in complex scientific and engineering applications such as<br />
analytical instrumentation and leading edge semiconductor<br />
manufacture, Energetiq’s light products are based on new<br />
technology that features broadband output from 170 nm in<br />
the deep UV, through visible and into the near infrared.<br />
Energetiq was founded in 2004 by an experienced<br />
technology development team with deep understanding of<br />
the high power plasma physics needed for high performance<br />
light products. This expertise enables Energetiq to provide<br />
light sources with the highest levels of brightness,<br />
performance, and reliability, as well as long operating life.<br />
Chief Spectroscopic Techniques Supported<br />
⦁ UV–vis spectrometry<br />
⦁ Hyperspectral imaging<br />
⦁ Circular dichroism spectroscopy<br />
⦁ Photoemission electron spectroscopy<br />
Markets Served<br />
Energetiq’s light sources are used for analytical spectroscopy,<br />
microscopy, and biological imaging in<br />
the life-sciences; lithography, metrology,<br />
inspection, resist and thin-film processing<br />
of semiconductors, displays and storage<br />
devices; soft X-ray microscopy; and a<br />
variety of R&D applications where<br />
traditional arc-lamps and synchrotron<br />
radiation have commonly been used.<br />
Major Products<br />
UV–vis-NIR, Broadband<br />
⦁ Ultra-high brightness, long-life, LDLS TM<br />
laser-driven light sources:<br />
• EQ-99 (compact, economical,<br />
high brightness)<br />
• EQ-99FC (compact, high brightness,<br />
fiber-coupled output)<br />
• EQ-1000 (high power, high<br />
brightness)<br />
• EQ-1500/1510 (ultra-high<br />
brightness)<br />
• All models feature lifetimes<br />
10× traditional lamps<br />
Facilities<br />
Energetiq Technology provides sales and<br />
service support through its technical staff<br />
in the Woburn, Massachusetts<br />
headquarters and through its network<br />
of representatives and distributors in the<br />
United States, Asia, and Europe, ensuring<br />
quick turnaround for customers. In addition,<br />
the Massachusetts location has a<br />
clean manufacturing facility that provides<br />
Class 1000 assembly capability for optics<br />
assembly and manufacturing for LDLS<br />
products.
54 SpectroScopy corporAte cApABILItIeS DECEMBER 2011 www.spectroscopyonline.com<br />
Enwave Optronics, Inc.<br />
Major Products/Services<br />
⦁ EZRaman Series for laboratory and field<br />
Raman applications<br />
⦁ ProRaman Series for laboratory, on-line<br />
process monitoring, and other applications<br />
requiring high sensitivity<br />
⦁ MicroSense Series for Raman microscopy<br />
applications<br />
⦁ Frequency-stabilized lasers<br />
⦁ Customized Raman solutions<br />
⦁ OEM products<br />
Facilities<br />
Enwave’s engineering, sales, manufacturing,<br />
and services office is located in<br />
Irvine, California. We also have partners<br />
and distributors in North America, Europe,<br />
Asia, Latin America, and Australia<br />
to meet the needs of our international<br />
customers.<br />
enwave optronics, Inc.<br />
18200 W. McDurmott Street,<br />
Suite A<br />
Irvine, CA 92614<br />
Telephone<br />
(949) 955-0258<br />
FAx<br />
(949) 955-0259<br />
e-mAIl<br />
info@enwaveopt.com<br />
Web sITe<br />
www.enwaveopt.com<br />
number oF employees<br />
US: 8<br />
Outside the US: 15<br />
yeAr FounDeD<br />
2003<br />
Company Description<br />
Enwave Optronics, Inc. is an innovative leader in high performance<br />
and affordable Raman spectroscopy solutions.<br />
The Enwave engineering team has extensive knowledge<br />
in diode laser optical systems and Raman spectroscopy<br />
instrumentation. We specialize in providing solutions for<br />
Raman applications that other vendors are unable to solve.<br />
We provide full design, prototyping, R&D, manufacturing,<br />
and technical support. We are committed to assisting you<br />
resolve your most challenging application needs and to<br />
providing you with the best performance and quality solutions<br />
at the most affordable prices.<br />
Chief Spectroscopic Techniques Supported<br />
⦁ Raman spectroscopy<br />
Markets Served<br />
Enwave’s instruments can be found and utilized for a wide<br />
range of applications and in a variety of industries such<br />
as: education, research, environmental, semiconductor,<br />
pharmaceutical, forensics, chemical, paper and pulp, food<br />
and beverage, biotechnology and life sciences, gemology/<br />
mineralogy, and much more!
www.spectroscopyonline.com DECEMBER 2011 SpectroScopy corporAte cApABILItIeS 55<br />
Hamamatsu Corporation<br />
Major Products/Services<br />
⦁ Detectors: photomultiplier tubes,<br />
infrared detectors, photodiodes, and<br />
microchannel plates<br />
⦁ Image sensors: NMOS, CMOS, InGaAs<br />
photodiode arrays, and CCD<br />
⦁ Miniature spectrometers: UV–vis, NIR,<br />
and Raman<br />
⦁ Light sources: xenon lamps, xenon flash<br />
lamps, deuterium lamps, laser diodes,<br />
and quantum cascade lasers<br />
Company Description<br />
Hamamatsu Corporation is the North American subsidiary of<br />
Hamamatsu Photonics K.K. (Japan), a leading manufacturer of<br />
devices for the generation and measurement of infrared,<br />
visible, and ultraviolet light. These devices include<br />
photodiodes, photomultiplier tubes, scientific light sources, infrared<br />
detectors, photoconductive detectors, and image<br />
sensors. The parent company is dedicated to the advancement<br />
of photonics through extensive research. This corporate<br />
philosophy results in state-of-the-art products that are used<br />
throughout the world in scientific, industrial, and commercial<br />
applications.<br />
Facility<br />
Hamamatsu Corporation is a wholly<br />
owned subsidiary of Hamamatsu<br />
Photonics K.K. (Japan). Hamamatsu<br />
Corporation’s headquarters is located in<br />
Bridgewater, New Jersey. In addition, we<br />
have engineers located throughout the<br />
United States to provide you with<br />
technical and sales support.<br />
Hamamatsu Corporation<br />
360 Foothill Road<br />
Bridgewater, NJ 08807<br />
TelepHone<br />
(908) 231-0960<br />
Fax<br />
(908) 231-1539<br />
e-mail<br />
usa@hamamatsu.com<br />
Web siTe<br />
sales.hamamatsu.com<br />
Chief Spectroscopic Techniques Supported<br />
⦁ UV–visible spectroscopy<br />
⦁ IR spectroscopy<br />
⦁ Raman spectroscopy<br />
⦁ Mass spectroscopy<br />
⦁ Atomic absorption spectroscopy<br />
Markets Served<br />
Hamamatsu provides high performance devices for<br />
analytical instruments. These include detectors and light<br />
sources for use in UV–vis, NIR, Raman, TOF-MS, and other<br />
spectrometers. We also provide miniature spectrometers<br />
for medical and biological research, environmental<br />
monitoring, production and process control, semiconductor<br />
inspection, chromatography, food analysis, water content<br />
measurement, and other industries.
56 SpectroScopy corporAte cApABILItIeS DECEMBER 2011 www.spectroscopyonline.com<br />
Glass Expansion<br />
Major Products/Services<br />
Nebulizers<br />
⦁ SeaSpray — High dissolved solids nebulizer<br />
⦁ MicroMist — Low uptake nebulizer for<br />
all ICPs<br />
⦁ Conikal — An industry standard<br />
⦁ Slurry — For slurries andsSuspensions<br />
⦁ DuraMist — Routine high-precision HF<br />
analyses<br />
⦁ OpalMist — Ideal for geochemistry and<br />
semiconductor industry<br />
⦁ VeeSpray — Handles high particle and<br />
TDS loads best<br />
Glass expansion<br />
4 Barlows Landing Road<br />
Unit #2A<br />
Pocasset, MA 02559<br />
TelepHone<br />
(508) 563-1800<br />
(800) 208-0097<br />
Fax<br />
(508) 563-1802<br />
e-mail<br />
geusa@geicp.com<br />
Web siTe<br />
www.geicp.com<br />
YeaR Founded<br />
1985<br />
Company Description<br />
Glass Expansion has been manufacturing sample introduction<br />
components for ICP emission and mass spectrometers since<br />
the early 1980s. Today we support both new and old instruments<br />
for 16 different manufacturers, representing sample<br />
introduction systems for over 50 different ICP-AES and ICP-MS<br />
models. Glass Expansion has developed unique and proprietary<br />
manufacturing methods, which have resulted in the<br />
production of components of high mechanical strength and<br />
micron-level dimensional accuracy to satisfy the narrowest of<br />
analytical specifications, each and every time. Our products<br />
are recognized worldwide for their excellent precision,<br />
cost-effectiveness, and reproducibility of results.<br />
Chief Spectroscopic Techniques Supported<br />
⦁ ICP-AES<br />
⦁ ICP-MS<br />
Markets Served<br />
Glass Expansion’s products are used widely in private and<br />
government analytical laboratories within agricultural,<br />
environmental, food, forensic, geological, metallurgical,<br />
petrochemical, and pharmaceutical industries. We support<br />
leading ICP models including Thermo Fisher, PerkinElmer,<br />
Teledyne Leeman, Agilent, SPECTRO Ametek, and Horiba<br />
J-Y. Whether you need just a nebulizer, a complete sample<br />
introduction system, or the answer for a tricky sample, we<br />
have the innovative, high-quality products and applications<br />
expertise to assist.<br />
Spray Chambers<br />
⦁ Tracey Cyclonic — An industry standard<br />
⦁ Twister Cyclonic — Reduces solvent<br />
load<br />
⦁ Cinnabar Cyclonic — Low-volume spray<br />
⦁ IsoMist programmable temperature<br />
spray chamber<br />
Torches<br />
⦁ Fully Demountable D-Torches<br />
⦁ Semi-Demountable Torches<br />
⦁ Fixed Quartz Torches<br />
RF Coils<br />
Replacement RF Coils with optional silver<br />
or gold coating.<br />
Accessories<br />
⦁ Niagara Plus and Assist – Enhanced<br />
productivity accessories<br />
⦁ Capricorn – Argon humidifier<br />
⦁ TruFlo – sample uptake monitor<br />
Facilities<br />
Today, Glass Expansion has two global<br />
offices located in Australia and the<br />
United States. Between our two offices<br />
and network of distributors, we service<br />
every region of the globe, 24 hours a<br />
day. This ensures you receive a rapid<br />
response and timely order deliveries<br />
each and every time.
What makes<br />
Glass Expansion<br />
different?<br />
We are the world leader in the design of ICP<br />
sample introduction systems. The ICP that<br />
you are using now almost certainly incorporates<br />
sample introduction components based on<br />
original Glass Expansion designs.<br />
We provide a unique no-risk guarantee.<br />
If you find one of our products unsuitable in<br />
any way, you can return it for a credit or refund.<br />
We have a full staff of technical people to<br />
assist you. We have our own laboratory with<br />
four ICP spectrometers (ICP-OES and ICP-MS)<br />
and you can count on expert advice on your<br />
application from our experienced technical staff.<br />
We provide rapid delivery. Most items are held<br />
in stock and we ship immediately after receiving<br />
your order.<br />
To request a copy of our catalog, or sign up for our newsletter, please vist our website:<br />
Glass Expansion<br />
4 Barlows Landing Road<br />
Unit 2A • Pocasset • MA 0255 , USA<br />
Toll Free Phone: 800 208 00 7<br />
Telephone: 508 563 1800<br />
Facsimile: 508 563 1802<br />
Email: geusa@geicp.com<br />
Web: www.geicp.com
58 SPECTROSCOPY CORPORATE CAPABILITIES DECEMBER 2011 www.spectroscopyonline.com<br />
Harrick Scientific Products, Inc.<br />
Major Products/Services<br />
Harrick Scientific offers the most complete<br />
line of spectroscopy sampling products,<br />
including:<br />
⦁ Video MVP — a diamond micro ATR<br />
accessory with built-in camera<br />
⦁ MVP Pro Star — an affordable<br />
monolithic diamond ATR accessory<br />
⦁ Praying Mantis — a diffuse reflectance<br />
accessory available with environmental<br />
chambers/reaction cells<br />
⦁ Seagull — a variable angle specular<br />
reflection and ATR accessory<br />
⦁ VariGATR — a variable angle grazing<br />
angle ATR accessory for monolayers on<br />
Gold and Silicon substrates<br />
⦁ FiberMate 2 — an interface between spectrometers<br />
and fiberoptic applications<br />
⦁ MultiLoop, Omni-Diff, and<br />
Omni-Spec — fiberoptic probes for ATR,<br />
diffuse reflection, and specular<br />
reflection<br />
⦁ A variety of liquid and gas transmission<br />
cells<br />
⦁ Custom design development<br />
Harrick Scientific<br />
Products, Inc.<br />
141 Tompkins Ave,<br />
2nd Floor<br />
Pleasantville, NY 10570<br />
TELEPHONE<br />
(800) 248-3847<br />
FAX<br />
(914) 747-7209<br />
E-MAIL<br />
info@harricksci.com<br />
WEB SITE<br />
www.harricksci.com<br />
NUMBER OF EMPLOYEES<br />
25<br />
YEAR FOUNDED<br />
1969<br />
Company Description<br />
Harrick Scientific Products specializes in designing and manufacturing<br />
instruments for optical spectroscopy. Since being established<br />
in 1969, Harrick Scientific has advanced the frontiers of<br />
optical spectroscopy through its innovations in all spectroscopic<br />
techniques. The founder of the company, Dr. N.J. Harrick, pioneered<br />
ATR (attenuated total reflection) spectroscopy and became<br />
the principal developer of this technique. Harrick Scientific<br />
offers a complete selection of sampling accessories, including<br />
both standard and custom designs, as well as an extensive line of<br />
optical elements.<br />
Chief Spectroscopic Techniques Supported<br />
⦁ Transmission<br />
⦁ Specular reflection<br />
⦁ Diffuse reflection<br />
⦁ ATR<br />
⦁ Fiberoptics<br />
Markets Served<br />
Harrick Scientific serves analytical markets worldwide. Harrick’s<br />
customers typically are from research or quality control laboratories<br />
of industrial, governmental, research, and academic institutions<br />
throughout the world. Industries served include chemical,<br />
electronic, pharmaceutical, forensics, and biomedical.<br />
Facilities<br />
Harrick Scientific Products is located 30<br />
miles north of New York City in Pleasantville,<br />
New York. Our products are also<br />
available through FT-IR and UV-Vis spectrometer<br />
manufacturers, as well as distributors<br />
in the United States and throughout<br />
the world.
www.spectroscopyonline.com<br />
Hellma USA, Inc.<br />
DECEMBER 2011 SPECTROSCOPY CORPORATE CAPABILITIES 59<br />
Hellma USA, Inc.<br />
80 Skyline Drive<br />
Plainview, NY 11803<br />
TELEPHONE<br />
(516) 939-0888<br />
WEB SITE<br />
www.hellmausa.com<br />
Mini process probe.<br />
Company Description<br />
Hellma GmbH & Co., founded<br />
in 1922, is the world market<br />
leader in cells, fiber optic<br />
probes, and optical components<br />
made of glass or quartz<br />
which are used for modern<br />
optical analysis. Hellma<br />
Analytics products are available<br />
worldwide through a network<br />
of Hellma Analytics sister companies<br />
and additional<br />
distribution agents.<br />
Major Products/Services<br />
Complete traceability and excellent reliability of measurement<br />
results — with UV–vis calibration standards<br />
from the accredited DKD calibration laboratory of<br />
Hellma<br />
With the accreditation according to DIN EN ISO 17025, Hellma<br />
Analytics is one of the leading accredited calibration laboratories<br />
that produce and certify liquid and glass calibration filters made<br />
for testing spectrophotometers. Increased security and quality<br />
demands among laboratories require an improved traceability<br />
of measurement results to an internationally approved standard.<br />
An accreditation according to DIN EN ISO 17025 ensures the<br />
traceability of calibrations carried out to references of the NIST, by<br />
which an international correlation of measurement results is<br />
assured. Thus, procedures in laboratories gain greater transparency<br />
and improved protection of their measurement results.<br />
Fiber–optical systems<br />
The development of fiber-optical systems has caused a small<br />
revolution in chemical analysis. This technology makes it possible<br />
to carry out photometric measurements not only under<br />
laboratory conditions with cells, but also outside the lab.<br />
Through the development of fiber-optic probes, analysis has<br />
moved directly to the process for measurements with continuous<br />
measurements possible without sampling. This allows for<br />
better control of ongoing processes with much less effort.<br />
TrayCell — Micro Volume Analysis for sample volume<br />
of 0.5 µL to 10 µL<br />
Even in classical analysis the specialists at Hellma Analytics are always<br />
setting new standards. One of the most recent examples: the<br />
fiber-optic ultra-micro measuring cell “TrayCell,” which allows accurate<br />
analysis of DNA, RNA, or proteins in sample volumes of as<br />
low as 0.5 μL. The dimensions of the TrayCell are equivalent to a<br />
standard cell in order to work in all common spectrophotometers.<br />
Features:<br />
⦁ Unique fiber optic ultra-micro measuring cell<br />
⦁ Works with 0.5 μL to 10 μL sample volume<br />
⦁ A single drop measuring sample is<br />
sufficient<br />
⦁ High precision and reproducibility<br />
⦁ Dilution is not necessary<br />
Modern Flow Cytometry requires<br />
highest standards<br />
The heart of every flow cytometer is a<br />
small quartz glass flow channel providing<br />
reliable stability of the fluidic system and<br />
precise optical analysis of single cells. Due<br />
to sophisticated technologies Hellma is<br />
able to manufacture customer specified<br />
channel dimensions down to 50 μm ×<br />
50 μm with any outside dimension and<br />
highly polished surfaces.<br />
Custom Designed Products<br />
In addition to the large range of standard<br />
products, Hellma Analytics also manufactures<br />
special cells and other precision optical<br />
parts according to customer’s specifications.<br />
Hellma Analytics has more than 90 years<br />
experience in the field of glass machining<br />
and fabrication. Our specialists can carry out<br />
complex tasks and give full and competent<br />
advice regarding design ideas and any<br />
alternative possibilities.<br />
Analysis in space — processing at<br />
the cutting edge of technology<br />
A close collaboration with research institutes,<br />
universities, and scientific institutions is<br />
important for Hellma Analytics’ outstanding<br />
engineering competence. Based on this<br />
extensive know-how in processing<br />
techniques, Hellma Analytics is able to find<br />
unique solutions. Excellent examples of<br />
achievements are the individually designed,<br />
custom-made cells being used in the<br />
International Space Station (ISS) or those<br />
which were used in physics research that led<br />
to the winning of the Nobel Prize in 1997<br />
and 2001.
60 SPECTROSCOPY CORPORATE CAPABILITIES DECEMBER 2011 www.spectroscopyonline.com<br />
HORIBA Scientific<br />
Markets Served<br />
⦁ Academia<br />
⦁ Bio<br />
⦁ Chemicals<br />
⦁ Environmental<br />
⦁ Forensic science<br />
⦁ Life sciences<br />
⦁ Medical<br />
⦁ Metals<br />
⦁ Nanotechnology<br />
⦁ OEM<br />
⦁ Optoelectronics<br />
⦁ Paint/Pigments<br />
⦁ Petroleum<br />
⦁ Pharmaceuticals<br />
⦁ Photovoltaics<br />
⦁ Plastics, polymers, etc.<br />
⦁ Semiconductors<br />
⦁ WEEE/RoHS<br />
HORIBA Scientific<br />
3880 Park Avenue<br />
Edison, NJ 08820<br />
TELEPHONE<br />
(732) 494-8660<br />
FAX<br />
(732) 494-5125<br />
E-MAIL<br />
info.sci@horiba.com<br />
WEB SITE<br />
www.horiba.com/scientific<br />
NUMBER OF EMPLOYEES<br />
USA: 700<br />
Elsewhere: 5000<br />
YEAR FOUNDED<br />
1819<br />
Company Description<br />
HORIBA Scientific is the world-leading manufacturer of high performance<br />
optical spectroscopy instrumentation and components.<br />
Our spectrometers offer unsurpassed sensitivity, precision, performance<br />
and features as a consequence of our 194 years of history<br />
and expertise. HORIBA Scientific offers our customers the highest<br />
quality products and solutions, supported by a global network of<br />
scientists, engineers, technicians and customer service professionals.<br />
We are ready to be your partner whether you require components,<br />
custom solutions, OEM solutions and analytical, process or<br />
research spectrometers.<br />
HORIBA Scientific is part of the HORIBA Group, which employs<br />
over 5000 people worldwide, with annual sales in excess of $1.5<br />
billion. Some of our well-known and respected brand names include<br />
HORIBA Jobin Yvon, Sofie, Dilor, Spex ® , and IBH.<br />
Chief Spectroscopic Techniques Supported<br />
⦁ Molecular fluorescence spectroscopy<br />
⦁ Optical spectroscopy<br />
⦁ Raman spectroscopy and microscopy<br />
⦁ Ellipsometry and thin film analysis<br />
⦁ Atomic emission spectroscopy<br />
⦁ Fluorescence<br />
⦁ Forensic science<br />
Major Products/Services<br />
⦁ <strong>Spectroscopy</strong> and analysis<br />
⦁ Elemental analyzers<br />
⦁ Ellipsometers<br />
⦁ End-point detectors<br />
⦁ Fluorescence<br />
⦁ Gratings<br />
⦁ ICP & GD spectrometers<br />
⦁ Lifetime fluorescence<br />
⦁ Microscopy<br />
⦁ OEM components<br />
⦁ Particle size analyzers<br />
⦁ Process control<br />
⦁ Raman & FT-IR<br />
⦁ Spectrographs<br />
⦁ Spectrometers and CCDs<br />
⦁ TCSPC<br />
⦁ VUV equipment<br />
⦁ X-Ray fluorescence<br />
⦁ Surface Plasmon Resonance Imaging<br />
(SPRi)<br />
Facilities<br />
HORIBA Scientific manufactures quality<br />
instruments in Edison, New Jersey, as well<br />
as in France and Japan.<br />
Sales, service, and applications facilities<br />
are located around the world. We are an<br />
ISO 9001:2008-certified company.
www.spectroscopyonline.com DECEMBER 2011 SpectroScopy corporAte cApABILItIeS 61<br />
International Centre for Diffraction Data<br />
international Centre for<br />
diffraction data<br />
12 Campus Boulevard<br />
Newtown Square, PA 19073<br />
TelepHone<br />
(610) 325-9814<br />
Fax<br />
(610) 325-9823<br />
e-mail<br />
infox@icdd.com<br />
Web siTe<br />
www.icdd.com<br />
YeaR Founded<br />
1941<br />
Company Description<br />
ICDD is a non-profit scientific organization dedicated to collecting,<br />
editing, publishing, and distributing powder diffraction<br />
data for the identification of crystalline materials. Our mission<br />
is to continue to be the world center for quality diffraction<br />
and related data to meet the needs of the technical community.<br />
We promote the application of materials characterization<br />
methods in science and technology by providing forums<br />
for the exchange of ideas and information. We sponsor the<br />
Pharmaceutical Powder X-ray Diffraction Symposium (PPXRD),<br />
Denver X-ray Conference; its proceedings, Advances in X-ray<br />
Analysis and the journal, Powder Diffraction. ICDD and its<br />
members conduct workshops and clinics on materials characterization<br />
at our headquarters in Newtown Square, Pennsylvania<br />
and at X-ray analysis conferences around the world.<br />
Chief Spectroscopic Techniques Supported<br />
⦁ X-ray Diffraction<br />
⦁ Electron Diffraction<br />
⦁ Electron Backscatter Diffraction<br />
Markets Served<br />
The Powder Diffraction File is designed for materials identification<br />
and characterization. ICDD databases are used worldwide<br />
by scientists in academia, government, and industry who<br />
are actively engaged in the field of X-ray powder diffraction<br />
and related disciplines.<br />
Major Products/Services<br />
PDF-4+ 2011 is our advanced database<br />
with comprehensive material coverage<br />
for inorganic materials. The database is a<br />
powerful tool for phase identification using<br />
physical, chemical, and crystallographic<br />
data. It contains numerous features such<br />
as 316,291 data sets, digitized patterns,<br />
molecular graphics and atomic parameters.<br />
Many new features have been<br />
incorporated into PDF-4+ to enhance the<br />
ability to do quantitative analysis by any<br />
of three methods: Rietveld Analysis, Reference<br />
Intensity Ratio (RIR) method, or Total<br />
Pattern Analysis. PDF-4+ also offers a<br />
suite of electron diffraction tools including<br />
electron diffraction powder pattern simulations,<br />
an interactive spot pattern simulation,<br />
and an electron diffraction backscatter<br />
pattern simulation module.
62 SpectroScopy corporAte cApABILItIeS DECEMBER 2011 www.spectroscopyonline.com<br />
Iridian Spectral Technologies Ltd.<br />
Company Description<br />
Leader in optical filter solutions, Iridian, is a coating company that works with you in finding cost effective<br />
solutions to your problems. We are one of the leading companies for Raman, confocal fluorescence and<br />
flow cytometry filters. Our coatings reach from UV to LWIR of the optical spectrum. Our dielectric thin-films<br />
provide long term durability and reliability with industry leading optical performance. We provide filters from<br />
small prototype volumes to large volume productions. We are a reliable partner, with high quality standards<br />
and excellent customer service. Our product is state-of-the-art and we set high value on innovation.<br />
Chief Spectroscopic Techniques Supported<br />
⦁ Raman spectroscopy<br />
⦁ Confocal fluorescence microscopy<br />
⦁ Flow cytometry<br />
Markets Served<br />
We are a global supplier who addresses the worldwide need of optical filters for OEMs and individual end<br />
users through direct sales support offered and sales through local distribution channels in Europe and Asia.<br />
Iridian provides optical filters and coating services to a wide variety of industrial and research sectors. We are<br />
a global supplier for applications in telecommunications, spectroscopy (Raman, fluorescence, flow cytometry)<br />
and the entertainment industry (filter wheels, glasses for 3D cinema).<br />
iridian spectral<br />
Technologies ltd.<br />
1200 Montreal Rd.<br />
Bldg. M50<br />
Ottawa, Ontario, Canada<br />
TelepHone<br />
(613) 741-4513<br />
Major Products/Services<br />
We offer optical filters and coatings, for UV, visible, and IR applications. Our dielectric thin-film filters provide<br />
long term durability and reliability with industry leading optical performance. Get more signal with less<br />
background with our optical filters for Raman spectroscopy. We provide pass band transmittances of >90%,<br />
exceptional edge steepness, and blocking of >OD6. Capture better images with our single or multi-band<br />
filters for fluorescence spectroscopy and microscopy and flow cytometry. Our filters have high transmission<br />
with sharp cutoffs and excellent isolation providing brighter imaging and improved image contrast.<br />
Facility<br />
Iridian’s operations are located in Canada’s capital: Ottawa, Ontario. Our offices/headquarters and our<br />
manufacturing plant occupy a total space of 40,778 ft 2 out of which: 27,328 square feet is manufacturing<br />
area. We are a Canadian manufacturer.<br />
Fax<br />
(613) 741-9986<br />
e-mail<br />
inquiries@iridian.ca<br />
Web siTe<br />
www.iridian.ca<br />
numbeR oF emploYees<br />
ouTsiTe usa: 124<br />
YeaR Founded<br />
1998
64 SpectroScopy corporAte cApABILItIeS DECEMBER 2011 www.spectroscopyonline.com<br />
International Crystal Laboratories<br />
optics; KBr powder; liquid and gas transmission<br />
cells; cuvettes for UV–vis, NIR, and<br />
fluorescence spectroscopy; solid sampling<br />
accessories such as mills, mortars and<br />
pestles, lab presses, and dies for making<br />
KBr pellets for IR spectroscopy; and briquets<br />
for XRF spectroscopy.<br />
Facility<br />
ICL provides customer support at our state<br />
of the art manufacturing plant in Garfield,<br />
New Jersey. We maintain several FT-IR and<br />
UV–vis spectrophotometers for product<br />
quality control. Our plant is now serviced<br />
by a 150 KWH backup generator which<br />
guarantees that we are able to be productive<br />
at all times.<br />
international Crystal<br />
laboratories<br />
11 Erie Street<br />
Garfield, NJ 07026<br />
TelepHone<br />
(973) 478-8944<br />
Fax<br />
(973) 478-4201<br />
e-mail<br />
iclmail@optonline.net<br />
Web siTe<br />
www.internationalcrystal.net<br />
numbeR oF emploYees<br />
25<br />
YeaR Founded<br />
1962<br />
Company Description<br />
ICL is a fully integrated materials technology company that<br />
manufactures IR crystal optics and spectroscopy accessories.<br />
It is the only US manufacturer of KBr, NaCl, and KCl crystals.<br />
KBr beam splitters are an essential component of all FT-IR<br />
spectrophotometers. ICL is a highly regarded vendor to instrument<br />
manufacturers and has received numerous honors such<br />
as “Vendor of the Year” from instrument manufacturers for<br />
on time, defect free product deliveries. ICL is engaged in R&D<br />
projects with major research laboratories, including ongoing<br />
projects with Brookhaven National Laboratory.<br />
Chief Spectroscopic Techniques Supported<br />
⦁ IR<br />
⦁ FT-IR<br />
⦁ UV–vis<br />
⦁ Fluorescence<br />
⦁ XRF<br />
Markets Served<br />
ICL supplies a broad range of optics, supplies, and accessories<br />
for spectroscopy to end-users, dealers, catalog vendors, and<br />
instrument manufacturers worldwide. Customers can access<br />
ICL’s products on-line, through extensive catalogs and a network<br />
of more than 75 dealers who service customers in most<br />
markets throughout the world.<br />
Major Products/Services<br />
ICL products enable spectroscopists to make the most out of<br />
modern spectroscopic instruments. Products include IR crystal
www.spectroscopyonline.com<br />
Meinhard<br />
DECEMBER 2011 SPECTROSCOPY CORPORATE CAPABILITIES 65<br />
Meinhard<br />
700 <strong>Corporate</strong> Circle, Suite L<br />
Golden, Colorado 80401<br />
TELEPHONE<br />
(800) 634-6427<br />
FAX<br />
(303) 279-5156<br />
E-MAIL<br />
sales@meinhard.com<br />
WEB SITE<br />
www.meinhard.com<br />
NUMBER OF EMPLOYEES<br />
25<br />
YEAR FOUNDED<br />
1974<br />
Company Description<br />
Sample introduction components and accessories for ICP-OES<br />
and ICP-MS. Since 1974, Meinhard is the leading manufacturer<br />
of concentric nebulizers in borosilicate glass and quartz. The topperforming<br />
microconcentric High Efficiency Nebulizer operates at<br />
5 to 300 µL/min and 90, 120, 150, or 170 psi for 1 L/min carrier.<br />
A new sample collection device, the ALPXS, is an aerosol-to-liquid<br />
particle extraction system which puts atmospheric particulates directly<br />
into suspension for ICP analysis. As a division of Elemental<br />
Scientific, Meinhard products are available through a worldwide<br />
network of distributors.<br />
Chief Spectroscopic Techniques Supported<br />
⦁ ICP-OES<br />
⦁ ICP-MS<br />
Markets Served<br />
⦁ Agricultural<br />
⦁ Environmental<br />
⦁ Manufacturing<br />
⦁ Materials<br />
⦁ Metals<br />
⦁ Mining<br />
⦁ Petroleum<br />
⦁ Pharmaceuticals<br />
⦁ R & D<br />
Major Products/Services<br />
Nebulizers:<br />
⦁ HEN – highest sensitivity available, and<br />
low liquid flow<br />
⦁ Plus Series – combine the high sensitivity<br />
A-type nozzle with low dead volume for<br />
fast stabilization and rinse-out<br />
⦁ A-type – highest sensitivity in a conventional<br />
nebulizer<br />
⦁ C-type – high solids tolerance<br />
⦁ K-type – high solids tolerance with reduced<br />
carrier flow<br />
Spray Chambers:<br />
⦁ For all ICP instruments, with custom<br />
designs available<br />
Torches:<br />
⦁ For all ICP instruments, with custom designs<br />
available<br />
Accessories:<br />
⦁ ALPXS self-contained, portable air sampler<br />
⦁ Peristaltic pump tubing<br />
Facility<br />
Precision manufacturing of quartz and<br />
glass consumables for ICP-OES and<br />
ICP-MS.
66 SpectroScopy corporAte cApABILItIeS DECEMBER 2011 www.spectroscopyonline.com<br />
Moxtek, Inc.<br />
Major Products/Services<br />
⦁ ProFlux Wiregrid Polarizers — High<br />
transmission and contrast inorganic<br />
polarizers for UV, visible, and IR<br />
applications.<br />
⦁ MAGNUM Miniature X-ray Sources —<br />
The leading X-ray source technology for<br />
handheld and bench top X-ray analysis<br />
applications.<br />
⦁ XPIN Detectors — The latest generation<br />
of affordable Si-PIN detectors for X-ray<br />
fluorescence spectrometry.<br />
⦁ AP3 and ProLINE Windows — Ultrathin<br />
polymer windows for energy and<br />
wavelength dispersive spectroscopy.<br />
⦁ DuraBeryllium Windows — The most<br />
rugged and reliable beryllium windows<br />
available for X-ray applications.<br />
⦁ MX Series JFET — The lowest noise JFET<br />
available for X-ray detection systems.<br />
Moxtek, inc.<br />
452 W 1260 N<br />
Orem, UT 84057<br />
Telephone<br />
(801) 225-0930<br />
Fax<br />
(801) 221-1121<br />
e-Mail<br />
moxtek@moxtek.com<br />
Web siTe<br />
www.moxtek.com<br />
nuMber oF eMployees<br />
142<br />
year Founded<br />
1986<br />
Company Description<br />
We are a leading supplier of X-ray and optical components<br />
for analytical instrumentation and display electronics.<br />
Products include the new XPIN high-performance Si-<br />
PIN X-ray detectors; MAGNUM ® miniature low-power<br />
X-ray sources; AP3 and DuraBeryllium ® X-ray windows<br />
for EDS; ProLINE windows for WDS; and ProFlux ® wiregrid<br />
polarizers and beam splitters for UV, visible, and<br />
IR spectroscopy. Moxtek is well known for advanced<br />
technology, innovative solutions, and excellent<br />
customer service.<br />
Chief Spectroscopic Techniques Supported<br />
⦁ Energy dispersive X-ray spectroscopy<br />
⦁ Wavelength dispersive X-ray spectroscopy<br />
⦁ X-ray diffraction<br />
⦁ Microanalysis<br />
⦁ UV, visible, IR spectrometry<br />
Markets Served<br />
Moxtek, Inc. serves the analytical instrumentation and<br />
projection display markets.<br />
Wiregrid polarizer
68 SPECTROSCOPY CORPORATE CAPABILITIES DECEMBER 2011 www.spectroscopyonline.com<br />
Milestone Inc.<br />
⦁ Commercial testing<br />
⦁ Petrochemical<br />
⦁ Environmental<br />
⦁ Academic<br />
Major Products/Services<br />
⦁ Ethos EZ — the most advanced closed<br />
vessel microwave digestion system<br />
⦁ UltraWAVE — single reaction chamber microwave<br />
digestion in a benchtop package<br />
⦁ UltraCLAVE — single reaction chamber microwave<br />
digestion — ultimate throughput<br />
⦁ DMA-80 — direct mercury analysis with<br />
results in 6 min<br />
⦁ DuoPUR — on demand acid purification<br />
⦁ TraceCLEAN — automated acid reflux<br />
cleaning system<br />
⦁ PYRO — fast, microwave ashing<br />
Milestone Inc.<br />
25 Controls Drive<br />
Shelton, CT 06484<br />
TELEPHONE<br />
(886) 995-5100<br />
FAX<br />
(203) 925-4241<br />
E-MAIL<br />
mwave@milestonesci.com<br />
WEB SITE<br />
www.milestonesci.com<br />
www.milestonesrl.com<br />
NUMBER OF EMPLOYEES<br />
30 (in the US)<br />
100 (outside the US)<br />
YEAR FOUNDED<br />
1988<br />
Company Description<br />
Today’s laboratories are challenged to process more samples at<br />
lower detection levels with fewer available resources. Often the<br />
limitations of the existing sample preparation approach creates a<br />
“bottleneck” in productivity. At Milestone our full suite of<br />
microwave sample prep productivity tools are backed by over<br />
50 patents and 20 years of industry expertise to break these<br />
bottlenecks by providing safe, reliable, and flexible platforms to<br />
enhance your productivity. The key to Milestone’s technological<br />
leadership lies in bringing together individuals from diverse<br />
scientific and engineering disciplines to solve real world problems<br />
with innovative microwave instrumentation. This philosophy has<br />
enabled Milestone to develop an extraordinary range of products<br />
from an unmatched portfolio of over 30 patents.<br />
Over 15,000 customers worldwide look to Milestone to improve<br />
their metals digestions, organic extractions, mercury analysis, and<br />
synthetic chemistry processes. We partner with our customers to<br />
meet their challenges now, and well into the future.<br />
Chief Spectroscopic Techniques Supported<br />
⦁ ICP mass spectrometry (ICP-MS)<br />
⦁ Inductively coupled plasma (ICP-OES)<br />
⦁ Atomic absorption ( AA)<br />
⦁ Mercury analysis<br />
Markets Served<br />
⦁ Pharmaceutical<br />
⦁ Clinical<br />
⦁ Food testing<br />
Facility<br />
Milestone’s Global HQ is based in Bergamo,<br />
Italy with manufacturing and R&D facilities<br />
in Germany and Switzerland. We support<br />
our global customers through direct offices<br />
in China, Japan, Korea, as well as distributor<br />
networks in 70 countries.<br />
Milestone’s North American Headquarters<br />
are located in Shelton, Connecticut to provide<br />
applications, technical, and customer<br />
service support to our clients. Our stocking<br />
facilities are managed for immediate<br />
turn around for consumables, accessories,<br />
and service parts. Our applications lab is<br />
equipped with a full range of productivity<br />
tools and a team of application chemists to<br />
provide customer demonstrations as well<br />
as method development. With a service and<br />
support team to complement our field sales<br />
team, Milestone can look after customer<br />
needs locally.
www.spectroscopyonline.com DECEMBER 2011 SpectroScopy corporAte cApABILItIeS 69<br />
Nippon Instruments North America<br />
requirements. These analyzers provide<br />
simple, highly effective results for such<br />
methods as EPA 245.1.<br />
⦁ Model RA-3420 Mercury Analyzer:<br />
A unique analyzer that performs the<br />
typical EPA Method 245.1 analysis in<br />
a fully automatic sequence, including<br />
sample preparation.<br />
⦁ Model PE-1000 Mercury Analyzer:<br />
A specifically designed mercury analyzer<br />
for direct, automated analysis of<br />
mercury in liquid and gaseous hydrocarbons.<br />
nippon instruments<br />
north america<br />
1511 Texas Ave S #270<br />
College Station, TX 77840<br />
Telephone<br />
(979) 774-3800<br />
Fax<br />
(979) 774-3807<br />
e-Mail<br />
sales@hg-nic.us<br />
Web siTe<br />
www.hg-nic.us<br />
nuMber oF eMployees<br />
19<br />
year Founded<br />
2003<br />
Company Description<br />
Nippon Instruments North America is the regional office for<br />
Nippon Instruments Corporation-Japan. Nippon Instruments<br />
has over 30 years of experience in the design and manufacture<br />
of high-quality mercury analyzers. With an absolute focus<br />
on mercury analyzers, Nippon Instruments offers mercury<br />
analyzers for just about every application. From systems for<br />
most EPA methods to direct mercury analyzers to online<br />
monitoring systems to specially designed systems for the petrochem<br />
industry, Nippon Instruments has a mercury analyzer<br />
for your laboratory.<br />
Chief Spectroscopic Techniques Supported<br />
⦁ Atomic absorption spectroscopy<br />
⦁ Atomic fluorescence spectroscopy<br />
Markets Served<br />
Nippon Instruments provides mercury analyzers for EPA compliance<br />
monitoring in the environmental, government, and<br />
industrial markets. We provide highly versatile systems for the<br />
research and education markets, as well as mercury analyzers<br />
that are specifically designed for the unique tasks of the industrial<br />
and petrochem markets.<br />
Major Products/Services<br />
⦁ Model MA-2000 Mercury Analyzer: A direct mercury<br />
analyzer that allows for mercury analysis of just about any<br />
matrix without the need for sample preparation.<br />
⦁ Model RA-3000 Series Mercury Analyzers: Mercury analyzers<br />
with several configurations available to fit various budget<br />
Facilities<br />
Nippon Instruments North America is in<br />
the final stages of building a new office in<br />
College Station, Texas, in order to continue<br />
to expand our capabilities. Nippon Instruments<br />
Corporation currently maintains offices<br />
in Osaka and Tokyo, Japan, as well as<br />
an additional office in Singapore.
70 SpectroScopy corporAte cApABILItIeS DECEMBER 2011 www.spectroscopyonline.com<br />
Ocean Optics<br />
students’ learning experience. You can find<br />
Ocean Optics products in virtually any application<br />
from food safety to forensics and<br />
from semiconductors to marine biology.<br />
ocean optics<br />
830 Douglas Ave.<br />
Dunedin, FL 34698<br />
Telephone<br />
(727) 733-2447<br />
Fax<br />
(727) 733-3962<br />
e-Mail<br />
info@oceanoptics.com<br />
Web siTe<br />
www.oceanoptics.com<br />
nuMber oF eMployees<br />
250<br />
year Founded<br />
1989<br />
Company Description<br />
Ocean Optics is the inventor of the world’s first miniature<br />
spectrometer and has specified and delivered nearly 200,000<br />
of them over the past 20 years. The company provides solutions<br />
for diverse applications of optical sensing in medical<br />
and biological research, environmental regulation, science<br />
education, production and process control. Ocean Optics also<br />
provides a comprehensive range of complementary technologies,<br />
including chemical sensors, metrology instrumentation,<br />
optical fibers, probes, filters and many more spectroscopic<br />
peripherals and accessories. Our spectrometers and sensors<br />
also are ideal for OEM applications — with modular options<br />
that meet virtually any application requirement.<br />
Chief Spectroscopic Techniques Supported<br />
Absorbance, transmission, reflectance, irradiance, fluorescence,<br />
Raman, UV-vis, NIR, spectroradiometry, color spectroscopy,<br />
laser-induced breakdown spectroscopy (LIBS), fiber<br />
optic chemical sensing, flow injection analysis, elemental<br />
analysis, end-point detection, headspace monitoring, laser<br />
characterization, nondestructive testing, multispectral imaging.<br />
Markets Served<br />
Ocean Optics’ technologies can be found in a diverse range of<br />
industries and disciplines. Our products are used by innovators,<br />
researchers, scientists, OEMs, medical and health care<br />
professionals and manufacturing facilities in every country on<br />
the planet. Military and security concerns have incorporated<br />
Ocean Optics technologies into their equipment and science<br />
educators have made our equipment an integral part of their<br />
Major Products/Services<br />
Spectrometers: UV-vis/NIR, high-resolution,<br />
time-gated fluorescence, spectrofluorometers,<br />
absorbance, laser-induced<br />
breakdown, LED measurement, reflectometer,<br />
Raman, remote sensing, field<br />
measurement<br />
OEM offerings: Spectrometers, sensors,<br />
fibers, and sub-assemblies for embedding<br />
into OEM applications<br />
Optical sensors: Oxygen sensors, pH sensors,<br />
temperature sensing, and transducing<br />
materials<br />
Sampling accessories: Collimating<br />
lenses, cuvettes and holders, standards,<br />
filters and holders, flow cells, cosine correctors,<br />
integrating spheres<br />
Light sources: Deuterium, tungsten halogen,<br />
LED, calibration sources, excitation<br />
sources, lasers<br />
Optical fiber and probes: Premiumgrade<br />
assemblies, bare fiber, custom<br />
options, reflection, transmission and temperature<br />
probes, vacuum feedthroughs,<br />
complete fiber kits<br />
Facility<br />
Ocean Optics is headquartered in<br />
Dunedin, Florida, and has full-service<br />
locations in Europe, Latin America and the<br />
People’s Republic of China. Ocean Optics<br />
is part of Halma, p.l.c., a safety and<br />
environmental technology group<br />
domiciled in the United Kingdom.
72 SpectroScopy corporAte cApABILItIeS DECEMBER 2011 www.spectroscopyonline.com<br />
OI Analytical<br />
Major Products/Services<br />
OI Analytical provides instruments for<br />
spectroscopic analysis including:<br />
⦁ iTOC-CRDS Isotopic Carbon Analyzer<br />
⦁ IonCam Mass Spectrometer<br />
⦁ IonCam 2020 Transportable GC–MS<br />
⦁ IonCCD Array Detector<br />
⦁ DA 3500 Discrete Analyzer<br />
⦁ FS 3100 Automated Chemistry Analyzer<br />
Facilities<br />
OI Analytical operates research and manufacturing<br />
sites in College Station, Texas<br />
and Birmingham, Alabama occupying<br />
88,000 square feet.<br />
oi analytical<br />
151 Graham Road<br />
P.O. Box 9010<br />
College Station, TX 77842<br />
Telephone<br />
(979) 690-1711<br />
(800) 653-1711<br />
Fax<br />
(979) 690-0440<br />
e-Mail<br />
oimail@oico.com<br />
Web siTe<br />
www.oico.com<br />
nuMber oF eMployees<br />
135<br />
year Founded<br />
1969<br />
Company Description<br />
OI Analytical designs, manufactures, markets, and supports<br />
analytical instruments used for sample preparation, detection,<br />
and measurement of chemical compounds and elements. OI<br />
Analytical is based in College Station, Texas, with a second<br />
facility in Birmingham, Alabama.<br />
Chief Spectroscopic Techniques Supported<br />
⦁ Total organic carbon-cavity ring down spectroscopy (TOC-<br />
CRDS)<br />
⦁ Mass spectrometry<br />
⦁ Gas chromatography–mass spectrometry (GC–MS)<br />
⦁ Discrete analysis<br />
⦁ Flow injection analysis (FIA)<br />
⦁ Segmented flow analysis (SFA)<br />
Markets Served<br />
Principal markets/industries served include environmental<br />
testing, drinking and wastewater treatment, chemicals and<br />
petrochemicals, pharmaceuticals, food and beverage, homeland<br />
security, and chemical weapons demilitarization.
www.spectroscopyonline.com<br />
OptiGrate Corp.<br />
DECEMBER 2011 SPECTROSCOPY CORPORATE CAPABILITIES 73<br />
OptiGrate Corp.<br />
3267 Progress Drive<br />
Orlando, FL 32826<br />
TELEPHONE<br />
(407) 381-4115<br />
FAX<br />
(407) 384-5995<br />
E-MAIL<br />
info@optigrate.com<br />
WEB SITE<br />
www.optigrate.com<br />
NUMBER OF EMPLOYEES<br />
30<br />
YEAR FOUNDED<br />
1999<br />
Company Description<br />
OptiGrate Corp designs and manufactures ultra-narrow band<br />
optical filters based on volume Bragg grating (VBG) technologies<br />
in proprietary photo-thermo-refractive glass. Filters with<br />
bandwidth as low as 30 pm are formed by holographic techniques<br />
in the bulk of glass material, and demonstrate superior<br />
optical quality, outstanding durability, environmental stability,<br />
and high optical damage threshold. OptiGrate is a pioneer<br />
and world leader in VBG technologies and, for over 10 years,<br />
OptiGrate has delivered holographic optical elements (HOE) to<br />
a large number of government contractors and OEMs in optoelectronics,<br />
analytical, medical, defense, and other industries.<br />
Markets<br />
OptiGrate supplied ultra narrow band filters to hundreds of<br />
customers on 5 continents. These filters are used for: Raman<br />
spectroscopy and microscopy; semiconductor, solid state,<br />
and fiber lasers; hyperspectral and Raman imaging systems;<br />
ultrafast laser systems; optical recording and storage; medical<br />
diagnostics and treatment; etc.<br />
Optical Density<br />
760 770 780 790 800 810<br />
1E+00<br />
1E+01<br />
1E+02<br />
1E+03<br />
1E+04<br />
1E+05<br />
1E+06<br />
1E+07<br />
1E+08<br />
Wavelength [nm]<br />
TFF Notch<br />
2x BNF<br />
Main Product Lines<br />
⦁ Ultra-narrow band optical notch and<br />
bandpass filters with linewidth less than<br />
10 cm -1<br />
⦁ Laser resonator mode selection filters/<br />
mirrors for spectral narrowing and thermal<br />
stabilization of lasers<br />
⦁ Deflectors — transmitting volume Bragg<br />
gratings for angular filtering and deflection<br />
of laser light<br />
⦁ Chirped volume Bragg gratings for compact<br />
and robust stretchers and compressors<br />
of ultra-short laser pulses<br />
⦁ Spectral beam combiner — angular<br />
and spectral filters for high-power laser<br />
spectral beam combining<br />
Facilities<br />
OptiGrate designs, develops, and makes<br />
all products in Orlando, Florida. The<br />
volume Bragg grating filters are manufactured<br />
in a unique, vertically integrated<br />
facility that includes photosensitive glass<br />
production facility, holographic facility,<br />
and laser development facility. Opti-<br />
Grate’s internal capability to develop,<br />
fine-tune, and mass produce photosensitive<br />
glass, the core of VBG technology,<br />
provides better process control and<br />
stability and also enables fabrication of<br />
filters with record characteristics.<br />
Ultra-narrow band BragGrate optical filters enable Raman shift measurements to 5 cm -1<br />
Optical Density<br />
784.5 784.75 785 785.25 785.5<br />
1E+00<br />
1E+02<br />
1E+04<br />
1E+06<br />
1E+08<br />
Wavelength [nm]
74 SpectroScopy corporAte cApABILItIeS DECEMBER 2011<br />
Optometrics Corporation<br />
www.spectroscopyonline.com<br />
optometrics Corporation<br />
8 Nemco Way<br />
Ayer, MA 01432<br />
Telephone<br />
(978) 772-1700<br />
Fax<br />
(978) 772-0017<br />
e-Mail<br />
sales@optometrics.com<br />
Web siTe<br />
www.optometrics.com<br />
nuMber oF eMployees<br />
45<br />
year Founded<br />
1969<br />
Company Description<br />
Optometrics has a distinguished 40 year history of manufacturing<br />
and providing optical components, in particular diffraction<br />
gratings and interference filters, for a wide range of spectroscopic<br />
and laser applications. Optometrics’ goal is to provide advanced<br />
optical components and systems for use in wavelength selection<br />
applications. Products include diffraction gratings, interference<br />
filters, components for military and civilian sighting and ranging<br />
equipment, monochromators, and ruled and holographic wire<br />
grid polarizers and beamsplitters. Optometrics caters, in particular,<br />
to the needs of its OEM customers by offering special services<br />
such as kanban stocking, bar coding capabilities, custom packaging<br />
programs, and higher level pre-aligned optical assemblies.<br />
Chief Spectroscopic Techniques Supported<br />
⦁ UV, Visible, IR spectrometry<br />
⦁ Infrared (including FT-IR)<br />
⦁ Fluorescence<br />
⦁ Raman spectroscopy<br />
⦁ Laser<br />
⦁ Liquid chromatography–mass spectrometry<br />
⦁ High performance liquid chromatography<br />
⦁ Color spectroscopy<br />
Markets Served<br />
⦁ Life sciences<br />
⦁ Scientific & analytical instrumentation<br />
⦁ FT-IR accessories<br />
⦁ Environmental & process monitoring<br />
⦁ Homeland security<br />
⦁ Scientific research<br />
⦁ Military<br />
⦁ Laser manufacturers<br />
Major Products/Services<br />
⦁ Diffraction gratings, ruled & holographic,<br />
originals or replicated, reflection and<br />
transmission<br />
⦁ Interference filters from 334–1650 nm<br />
⦁ Ruled & holographic wire grid<br />
polarizers<br />
⦁ Laser gratings<br />
⦁ Monochromators<br />
⦁ Tunable light sources<br />
⦁ Light sources, sample compartments,<br />
stepper motor controllers<br />
⦁ Components for military and civilian<br />
sighting and ranging equipment<br />
⦁ Beamsplitters<br />
⦁ Steep edge laser line longpass filters<br />
⦁ Laser safety eyewear coatings<br />
Facilities<br />
Optometrics’ facility in Ayer, Massachusetts<br />
contains space for offices, engineering,<br />
R&D, and production. Equipment that supports<br />
our broad range of capabilities include<br />
four metal vacuum coating systems,<br />
three filter vacuum systems, two ionassisted<br />
hard coat vacuum systems, three<br />
grating ruling engines, two holographic<br />
laboratories, full replication and lamination<br />
facilities as well as full assembly,<br />
alignment, and test facilities.<br />
A Dynasil Company
www.spectroscopyonline.com<br />
Oriel ® Instruments<br />
DECEMBER 2011 SpectroScopy corporAte cApABILItIeS 75<br />
Major Products/Services<br />
⦁ Light sources from low to high power<br />
and UV to IR<br />
⦁ Monochromators<br />
⦁ Light detection systems (single point<br />
and array based)<br />
⦁ Spectrographs<br />
⦁ Spectrometers<br />
⦁ Photovoltaic metrology devices<br />
⦁ Solar simulators<br />
⦁ Various components designed to make,<br />
manage, and measure light.<br />
Facility<br />
Located in Stratford, Connecticut, including<br />
dedicated engineering, sales,<br />
and manufacturing.<br />
oriel instruments<br />
150 Long Beach Blvd.<br />
Stratford, CT 06615<br />
Telephone<br />
(203) 377-8282<br />
Fax<br />
(203) 378-2457<br />
e-Mail<br />
oriel.sales@newport.com<br />
Web siTe<br />
www.newport.com/Oriel<br />
nuMber oF eMployees<br />
65 (Stratford, CT facility)<br />
nuMber oF WorldWide<br />
2500<br />
year Founded<br />
1965<br />
Company Description<br />
Oriel Instruments, a Newport Corporation brand, was founded<br />
in 1965 and delevoped a reputation as an innovative supplier<br />
of products for the making and measuring of light. Today, the<br />
Oriel brand provides sophisticated broad band light sources<br />
covering the range from UV to IR, pulsed or continuous, and<br />
low to high power. Oriel also offers monochromators,<br />
spectrographs, and a flexible modular FT-IR spectrometer, for<br />
users across many industries with diverse applications. Oriel is<br />
a leader in photovoltaics metrology products with its<br />
offering of solar simulators and quantum efficiency<br />
measurement tools. Oriel brings innovative products and solutions<br />
to Newport Corporation customers around the world.<br />
Chief Spectroscopic Techniques Supported<br />
⦁ UV–vis spectroscopy<br />
⦁ NIR spectroscopy<br />
⦁ FT-IR spectroscopy<br />
Markets Served<br />
⦁ Research<br />
⦁ Industrial manufacturing<br />
⦁ Pharmaceuticals<br />
⦁ Food sciences<br />
⦁ Life and health sciences<br />
⦁ Microelectronics<br />
⦁ Aerospace<br />
⦁ Defense
76 SPECTROSCOPY CORPORATE CAPABILITIES DECEMBER 2011<br />
Parker Hannifin Corporation<br />
Filtration and Separation Division<br />
www.spectroscopyonline.com<br />
Parker Hannifin<br />
Corporation<br />
Filtration and Separation<br />
Division<br />
242 Neck Road<br />
Haverhill, MA 01835<br />
TELEPHONE<br />
(978) 858-0505<br />
FAX<br />
(978) 556-7501<br />
WEB SITE<br />
www.labgasgenerators.com<br />
NUMBER OF EMPLOYEES<br />
55,000<br />
YEAR FOUNDED<br />
1924<br />
Company Description<br />
Safety: Parker Balston gas generators completely eliminate the<br />
safety hazards involved with handling high-pressure gas cylinders.<br />
Enjoy hassle-free automation with no tanks to change<br />
and no downtime.<br />
Reliability: Thousands of laboratories worldwide have Parker<br />
Balston gas generators in routine use. Parker Balston gas generators<br />
are recommended and used by major instrument manufacturers.<br />
We offer the best technology at an affordable price from<br />
the brand you trust.<br />
Quality: Each Parker Balston gas generator is manufactured<br />
under a strict total quality management program. We have a<br />
world-class ISO 9001-certified manufacturing facility in the United<br />
States. All Parker Balston gas generators are backed by a complete<br />
satisfaction guarantee. Parker offers preventative maintenance,<br />
extended warranties, and field repair programs for all laboratory<br />
gas generators, as well as a network of highly specialized sales,<br />
aplication, and technical support people.<br />
Parker offers preventative maintenance, extended warranties and<br />
Products: Hydrogen gas generators produce 99.99999% pure<br />
hydrogen for gas chromatographs. Zero air generators produce<br />
zero grade air for gas chromatographs. UHP nitrogen generators<br />
produce 99.9999% pure nitrogen for GCs or ICP spectrometers.<br />
FT-IR gas generators produce dry, CO 2<br />
-free purge gas for FT-IR<br />
spectrometers. Pure air and nitrogen generators produce dry,<br />
ultrapure compressed gas for laboratory instruments, including<br />
LC–MS instruments.<br />
Chief Spectroscopic Techniques<br />
Supported<br />
⦁ Optical<br />
⦁ Atomic<br />
⦁ Infrared<br />
⦁ Mass universal<br />
⦁ Hyphenated techniques<br />
Markets Served<br />
⦁ Agriculture<br />
⦁ Biotechnology<br />
⦁ Chemicals<br />
⦁ Chemical and explosives detection<br />
⦁ Energy<br />
⦁ Environmental<br />
⦁ Inorganic chemicals<br />
⦁ Instrument development<br />
⦁ Life science<br />
⦁ Organic chemicals<br />
⦁ Paints and coatings<br />
⦁ Petrochemicals<br />
⦁ Pharmaceuticals<br />
⦁ Plastics<br />
Major Products/Services<br />
Gas generators for the following analytical<br />
instruments:<br />
⦁ Gas chromatographs<br />
⦁ LC–MS<br />
⦁ FT-IR spectrometers<br />
⦁ ICP emission spectrometers<br />
⦁ TOC analyzers<br />
⦁ Atomic absorption spectrophotometers<br />
⦁ Nuclear magnetic resonance (NMR)<br />
⦁ Rheometers/thermal analyzers<br />
⦁ Sample evaporators/concentrators<br />
Facilities<br />
Parker Hannifin manufactures all gas generator<br />
products in Haverhill, Massachusetts.<br />
Distribution points stretch across the United<br />
States and worldwide, including Canada, the<br />
UK, China, India, Germany, France, Japan, and<br />
Singapore. Parker is pleased to announce<br />
that the Filtration & Separation Division,<br />
Balston Operation has been recommended<br />
for ISO4001:2004 certification by DNV.
www.spectroscopyonline.com<br />
DECEMBER 2011 SPECTROSCOPY CORPORATE CAPABILITIES 77<br />
PHOTONIS USA<br />
PHOTONIS USA<br />
Sturbridge Business Park<br />
660 Main Street<br />
Sturbridge, MA 01566<br />
TELEPHONE<br />
(508) 347-4000<br />
(800) 648-1800<br />
FAX<br />
(508) 347-3849<br />
E-MAIL<br />
sales@usa.photonis.com<br />
WEB SITE<br />
www.photonis.com<br />
NUMBER OF EMPLOYEES<br />
USA: 150<br />
Elsewhere: 900<br />
YEAR FOUNDED<br />
1937<br />
Company Description<br />
PHOTONIS is a leading developer,<br />
manufacturer, and<br />
supplier of scientific detector<br />
products and components<br />
for scientific and analytical<br />
instrumentation systems. We<br />
specialize in ion, electron,<br />
and photon detection with<br />
unrivaled expertise in designing<br />
and delivering standard<br />
and custom products to<br />
meet the most demanding<br />
applications.<br />
Our engineering and<br />
manufacturing expertise<br />
delivers solutions for virtually<br />
every detection application.<br />
With the PHOTONIS<br />
worldwide manufacturing<br />
capability and support network, we can both design and<br />
manufacture your most challenging detection needs.<br />
Chief Spectroscopic Techniques Supported<br />
⦁ Mass spectrometry<br />
⦁ Time of flight MS<br />
⦁ Raman spectroscopy<br />
⦁ Nuclear spectroscopy<br />
⦁ UV and X-ray spectroscopy<br />
⦁ Charged particle imaging<br />
⦁ Electron microscopy<br />
⦁ Residual gas analysis/leak detection<br />
⦁ E-beam/X-ray lithography<br />
⦁ Luminescence<br />
⦁ Fluorescence<br />
⦁ Atomic absorption<br />
⦁ Deep UV/X-ray optics<br />
Markets Served<br />
PHOTONIS detection products are found in most of today’s<br />
high technology-based markets, including scientific and<br />
analytical instrumentation, medical diagnostics, chemistry,<br />
scientific research, life sciences, space and geophysical<br />
exploration, environmental and process monitoring, homeland<br />
security, control, and communications.<br />
Major Products/Services<br />
⦁ Micro pore optics<br />
⦁ Channeltron ® electron multipliers<br />
⦁ MAGNUM ® electron multipliers<br />
⦁ Long-Life microchannel plates<br />
⦁ Time-of-flight MCP detectors<br />
⦁ MCP detector assemblies<br />
⦁ FieldMaster ion guides and<br />
drift tubes<br />
⦁ Glass capillary arrays<br />
⦁ Resistive glass products<br />
⦁ Electron generator arrays<br />
⦁ MCP-based pmts<br />
⦁ Image intensifier tubes<br />
⦁ Intensified camera units<br />
⦁ Hybrid photo detectors<br />
⦁ Streak tubes<br />
⦁ High voltage power supplies<br />
⦁ Power tubes<br />
⦁ Neutron and gamma detectors<br />
⦁ Glass-coated wire<br />
⦁ Flexible fiber optics<br />
Facilities<br />
PHOTONIS in Sturbridge, Massachusetts<br />
manufactures Channeltron ® electron<br />
multipliers, microchannel plates, MCP<br />
detectors, ion guides, prototype detectors,<br />
and other custom glass products.<br />
The Lancaster, Pennsylvania facility<br />
manufactures power tubes and other<br />
related products. PHOTONIS in Roden,<br />
Netherlands manufactures image intensifier<br />
tubes, intensified camera units,<br />
and hybrid photo detectors. PHOTONIS<br />
in Brive, France manufactures image intensifier<br />
tubes and related products.
78 SpectroScopy corporAte cApABILItIeS DECEMBER 2011 www.spectroscopyonline.com<br />
PerkinElmer, Inc.<br />
⦁ Mass spectrometry: ICP-MS, GC–MS,<br />
LC–MS<br />
⦁ Molecular spectroscopy: FT-IR and<br />
FT-NIR, UV–vis and UV–vis–NIR, Raman<br />
spectroscopy, fluorescence spectroscopy<br />
⦁ Thermal analysis: DSC, TGA, STA, DMA<br />
⦁ Organic elemental analysis: CHN/O,<br />
CHNS/O<br />
⦁ Consumables: Atomic spectroscopy,<br />
chromatography, molecular spectroscopy,<br />
thermal analysis, elemental<br />
analysis<br />
⦁ OneSource ® Laboratory Services<br />
Major Products/Services<br />
PerkinElmer, Inc. offers a wide breadth<br />
of instrumentation and solutions to meet<br />
your analytical measurement needs.<br />
Company Description<br />
PerkinElmer is a global scientific leader providing an extensive<br />
range of technology solutions and services to address the<br />
most critical issues facing humanity. From critical research and<br />
prenatal screening to environmental testing and industrial<br />
monitoring, we’re actively engaged in improving health and<br />
enhancing quality of life all around the world.<br />
Facility<br />
PerkinElmer, Inc. operates globally in 150<br />
countries.<br />
perkinelmer, inc.<br />
940 Winter Street<br />
Waltham, MA 02451<br />
Telephone<br />
(203) 925-4602<br />
Fax<br />
(203) 944-4904<br />
e-Mail<br />
as.info@perkinelmer.com<br />
Web siTe<br />
www.perkinelmer.com<br />
nuMber oF eMployees<br />
3400 (in the US)<br />
3600 (outside the US)<br />
year Founded<br />
1937<br />
Chief Spectroscopic Techniques Supported<br />
⦁ Atomic absorption<br />
⦁ Inductively coupled plasma (ICP-OES and ICP-AES)<br />
⦁ ICP mass spectrometry (ICP-MS)<br />
⦁ Infrared (FT-IR and FT-NIR) spectroscopy<br />
⦁ UV–vis and UV–vis–NIR<br />
⦁ Raman spectroscopy<br />
Markets Served<br />
PerkinElmer is a leading provider of precision instrumentation,<br />
reagents and chemistries, software, and services for a<br />
wide range of scientific and industrial laboratory applications,<br />
including environmental monitoring, food and beverage quality/safety,<br />
and chemical analysis, as well as genetic screening,<br />
drug discovery, and development.<br />
⦁ Atomic spectroscopy: AA, ICP-OES, ICP-MS<br />
⦁ Chromatography: GC and GC custom solutions, GC–MS,<br />
HPLC and UHPLC, LC–MS<br />
⦁ Hyphenated techniques: HPLC–ICP-MS, GC–ICP-MS, HS-<br />
GC, HS-GC–MS, TD-GC, TD-GC–MS, TG-IR, TG-MS, TG-GC–<br />
MS, DSC-Raman
©2011 PerkinElmer, Inc. 400222_02. All rights reserved. PerkinElmer ® is a registered trademark of PerkinElmer, Inc. All other trademarks are the property of their respective owners.<br />
NexION 300 ICP-MS<br />
The NexION 300 ICP-MS: Three Modes Of Operation. One High-Performance Instrument. Nothing keeps<br />
your laboratory moving forward like the revolutionary NexION® 300 ICP-MS. With three modes of operation (Standard,<br />
Collision and Reaction), it’s the only instrument of its kind that can adapt as your samples, analytical needs or data<br />
requirements change. Experience unparalleled flexibility. Enjoy unsurpassed stability. Optimize your detection limits<br />
and analysis times. The NexION 300 ICP-MS. Choose the simplest, most<br />
cost-efficient path from sample to results.<br />
See the NexION at PerkinElmer's Gateway—www.perkinelmer.com/gateway
80 SpectroScopy corporAte cApABILItIeS DECEMBER 2011<br />
PerkinElmer, Inc.<br />
www.spectroscopyonline.com<br />
perkinelmer, inc.<br />
940 Winter Street<br />
Waltham, MA 02451<br />
Telephone<br />
(203) 925-4602<br />
Fax<br />
(203) 944-4904<br />
e-Mail<br />
as.info@perkinelmer.com<br />
Web siTe<br />
www.perkinelmer.com<br />
nuMber oF eMployees<br />
3100 (in the US)<br />
3800 (outside the US)<br />
year Founded<br />
1937<br />
Company Description<br />
PerkinElmer is a global scientific leader providing an extensive<br />
range of technology solutions and services to address the<br />
most critical issues facing humanity. From critical research and<br />
prenatal screening to environmental testing and industrial<br />
monitoring, we’re actively engaged in improving health and<br />
enhancing quality of life all around the world.<br />
Chief Spectroscopic Techniques Supported<br />
⦁ Atomic absorption<br />
⦁ Inductively coupled plasma (ICP-OES and ICP-AES)<br />
⦁ ICP mass spectrometry (ICP-MS)<br />
⦁ Infrared (FT-IR & FT-NIR) spectroscopy<br />
⦁ UV-vis & UV-vis-NIR<br />
⦁ Raman spectroscopy<br />
Markets Served<br />
PerkinElmer is a leading provider of precision instrumentation,<br />
reagents and chemistries, software, and services for a<br />
wide range of scientific and industrial laboratory applications,<br />
including environmental monitoring, food and beverage quality/safety,<br />
and chemical analysis, as well as genetic screening,<br />
drug discovery, and development.<br />
Major Products/Services<br />
PerkinElmer, Inc. offers a wide breadth<br />
of instrumentation and solutions to meet<br />
your analytical measurement needs:<br />
⦁ Atomic spectroscopy: AA, ICP-OES,<br />
ICP-MS<br />
⦁ Chromatography: GC & GC Custom Solutions,<br />
GC–MS, HPLC & UHPLC<br />
⦁ Hyphenated techniques: HPLC–ICP-MS,<br />
GC–ICP-MS, HS-GC, HS-GC–MS, TD-GC,<br />
TD-GC–MS, TG-IR, TG-MS, TG-GC–MS,<br />
DSC-Raman<br />
⦁ Mass spectrometry: ICP-MS, GC–MS,<br />
LC–MS<br />
⦁ Molecular spectroscopy: FT-IR & FT-NIR,<br />
UV–vis & UV–vis–NIR, Raman spectroscopy,<br />
fluorescence spectroscopy<br />
⦁ Thermal analysis: DSC, TGA, STA, DMA<br />
⦁ Organic elemental analysis: CHN/O,<br />
CHNS/O<br />
⦁ Consumables: Atomic spectroscopy,<br />
chromatography, molecular spectroscopy,<br />
thermal analysis, elemental<br />
analysis<br />
⦁ OneSource ® Laboratory Services<br />
Facilities<br />
PerkinElmer, Inc. operates globally in 150<br />
countries.
© 2010 PerkinElmer, Inc. 400219_01. All trademarks or registered trademarks are the property of PerkinElmer, Inc. and/or its subsidiaries.<br />
IR READY<br />
TO GO<br />
IR spectrometry just got easier. With Spectrum Two, you<br />
can perform fast analyses anytime, anywhere. Bringing<br />
laboratory performance to non-laboratory environments,<br />
Spectrum Two assures the quality of your materials across multiple applications.<br />
Easy to use, powerful, compact and robust, it’s ideally suited to everyday<br />
measurements. Rely on 65 years of spectroscopy experience to help you protect<br />
www.perkinelmer.com/spectrumtwo
82 SpectroScopy corporAte cApABILItIeS DECEMBER 2011 www.spectroscopyonline.com<br />
PIKE Technologies<br />
⦁ Automation and temperature control<br />
are available for many of our spectroscopy<br />
accessories to speed sampling and<br />
to provide precise thermal analysis.<br />
Markets Served<br />
PIKE products are designed for molecular spectrometers<br />
in the petrochemical, food, forensic,<br />
biochemical, pharmaceutical, semiconductor,<br />
agriculture, and material science industries. In<br />
addition, PIKE specializes in custom design of<br />
products for specific applications. PIKE products<br />
are designed and built with craftsmanship and<br />
care to exceed customer expectations. Visit our<br />
new website and take advantage of our unique<br />
and interactive Crystal Properties Chart and FT-<br />
IR Calculators.<br />
piKe Technologies<br />
6125 Cottonwood Drive<br />
Madison, WI 53719<br />
Telephone<br />
(608) 274-2721<br />
Fax<br />
(608) 274-0103<br />
e-Mail<br />
sales@piketech.com<br />
Web siTe<br />
www.piketech.com<br />
nuMber oF eMployees<br />
42<br />
year Founded<br />
1989<br />
Company Description<br />
PIKE Technologies was established in the summer of 1989, specializing<br />
in the development and manufacture of accessories and<br />
optical systems that enhance the performance of commercial<br />
spectrometers. PIKE concentrates on making the life of laboratory<br />
personnel easier. This is achieved through replacing traditional,<br />
tedious sampling routines with a range of innovative products<br />
and techniques.<br />
Chief Spectroscopic Techniques Supported<br />
PIKE products are designed to work with FT-IR and molecular<br />
spectometers and are based upon the principles of transmission<br />
and reflection spectroscopy measurements. The sampling techniques<br />
offered can be divided into seven major groups:<br />
⦁ Attenuated total reflectance (ATR), for analysis of liquids,<br />
pastes, and soft solid materials.<br />
⦁ Diffuse reflectance (DRIFTS), used in sampling of powders and<br />
solids.<br />
⦁ Specular reflectance, useful in thin film composition and thickness<br />
measurements.<br />
⦁ Microsampling products, FT-IR microscope and beam condensers<br />
to analyze microsamples.<br />
⦁ Integrating spheres, NIR, and Mid-IR versions for FT-IR<br />
spectrometers.<br />
⦁ Transmission supplies, including IR optics, and windows of all<br />
sizes and designs.<br />
Major Products/Services<br />
⦁ MIRacle TM Patented “universal”<br />
sampling accessory - Diamond, ZnSe,<br />
Ge, Si, and AMTIR crystals<br />
⦁ GladiATR TM and GladiATR Vision TM -<br />
Highest performance diamond ATR<br />
⦁ VeeMax TM patented variable angle<br />
specular reflection<br />
⦁ ATR Max TM used for variable depth of<br />
penetration experiments and studies.<br />
⦁ A wide range of fully automated FT-IR<br />
and NIR products with easy to integrate<br />
AutoPRO TM software<br />
⦁ Valu-Line TM Kits combining the most<br />
often used sampling accessories and<br />
transmission kits containing sampling<br />
holders, cells, and optics<br />
⦁ Long Path Gas Cells — 2.4 to 20 m,<br />
heating available.<br />
Facility<br />
PIKE Technologies is located in Madison,<br />
Wisconsin. We distribute direct to our customers<br />
worldwide and OEM worldwide for<br />
packaging with spectrometers of all manufacturers.<br />
Please call or visit our website for<br />
additional contact and product information.
<strong>Spectroscopy</strong> Sampling Solutions<br />
Whether your samples are precious or ordinary, large or small,<br />
hard or soft, liquid or solid, pure or contaminated, PIKE<br />
accessories provide ways and means for their analysis.<br />
We specialize in ATR, diffuse and specular reflectance,<br />
micro sampling, temperature control and sampling<br />
automation. We also provide custom solutions.<br />
Contact us to order the PIKE catalog (or get it on line)<br />
for the complete picture…<br />
FTIR, NIR and UV-Vis sampling made easier<br />
www.piketech.com<br />
sales@piketech.com<br />
tel: 608-274-2721
84 SPECTROSCOPY CORPORATE CAPABILITIES DECEMBER 2011 www.spectroscopyonline.com<br />
Polymicro Technologies,<br />
A subsidiary of Molex Incorporated<br />
Major Products/Services<br />
Polymicro manufactures multimode,<br />
step-index fused silica optical fiber with<br />
polyimide, silicone, acrylate, and other<br />
buffers/coatings; hard clad optical fiber;<br />
dual clad optical fiber; highly stable deep<br />
UV optical fiber; broad spectrum optical<br />
fiber; fiber optic cables and assemblies;<br />
high-strength, high-temperature flexible<br />
fused-silica capillary tubing; light-guiding<br />
capillary; flow cells; square capillary<br />
tubing; windowed capillary tubes; UV<br />
transparent capillary; precision silica and<br />
quartz rods and “cleaved to length” tubing<br />
pieces; multilumen tubing; and microcomponents<br />
such as laser machined<br />
fiber tips, ferrules, sleeves, and laser cut<br />
rods or tubing.<br />
Polymicro Technologies,<br />
A subsidiary of Molex<br />
Incorporated<br />
18019 North 25th Avenue<br />
Phoenix, AZ 85023<br />
TELEPHONE<br />
(602) 375-4100<br />
FAX<br />
(602) 375-4110<br />
E-MAIL<br />
polymicrosales@molex.com<br />
WEB SITE<br />
www.polymicro.com<br />
NUMBER OF EMPLOYEES<br />
115<br />
YEAR FOUNDED<br />
1984<br />
Company Description<br />
For over a quarter century, (since 1984), Polymicro Technologies<br />
delivers CREATIVE . . . INNOVATIVE . . . SOLUTIONS<br />
for the aerospace, analytical, astronomy, automotive, biodefense,<br />
biotechnology, communications, energy, manufacturing,<br />
medical, military, and pharmaceutical industries.<br />
Polymicro is the leader in providing specialty optical fibers<br />
and capillary tubing world wide.<br />
Chief Spectroscopic Techniques Supported<br />
⦁ <strong>Spectroscopy</strong>, UV to mid-IR<br />
⦁ Sensors<br />
⦁ Analytical detectors<br />
⦁ Laser light delivery<br />
⦁ Remote illumination<br />
⦁ Astronomy spectral analysis<br />
Markets Served<br />
Polymicro’s optical fiber, capillary tubing, fiber optic assemblies,<br />
and fiber and tubing arrays are commonly used in academic<br />
labs, national labs, and industry. Polymicro products<br />
find use in aerospace, analytical, astronomy, automotive, biodefense,<br />
biotechnology, communications, energy, manufacturing,<br />
medical, military, and pharmaceutical. Typical applications<br />
include spectroscopy, sensing, analytical detection and analysis,<br />
laser light delivery, remote illumination, process and quality<br />
monitoring and control, in addition to unique applications<br />
from astronomy and aerospace to your laboratory bench.<br />
Facilities<br />
Polymicro has 50,000 sq. ft. of facility<br />
located in the North Phoenix area. At our<br />
location we have several draw towers<br />
that produce a large portion of capillary<br />
tubing and multimode step-index fibers<br />
used throughout the world. Polymicro<br />
has its own glass laboratory, assembly<br />
department, laser machining department,<br />
and sophisticated testing equipment to<br />
meet our customers’ needs for the highest<br />
quality products and service.<br />
To get your copy of our handbook or<br />
inquire about our products, simply e-mail<br />
our technical sales department at<br />
polymicrosales@molex.com. Or you can<br />
fax us at (602) 375-4110.
www.spectroscopyonline.com DECEMBER 2011 SpectroScopy corporAte cApABILItIeS 85<br />
Rigaku Corporation<br />
rigaku Corporation<br />
4-14-4, Sendagaya<br />
Tokyo 151-0051, JAPAN<br />
Telephone<br />
+1(281) 362-2300<br />
Fax<br />
+1(281) 364-3628<br />
e-Mail<br />
info@Rigaku.com<br />
Web siTe<br />
www.Rigaku.com<br />
nuMber oF eMployees<br />
US: 400<br />
Outside US: 700<br />
year Founded<br />
1951<br />
Company Description<br />
Since its inception in 1951, Rigaku has been at the forefront<br />
of analytical and industrial instrumentation technology. Today,<br />
with hundreds of major innovations to their credit, the Rigaku<br />
Group of Companies are world leaders in the fields of protein<br />
and small molecule X-ray crystallography, general X-ray diffraction<br />
(XRD and PXRD), X-ray spectrometry (EDXRF and WDXRF),<br />
X-ray optics, semiconductor metrology, Raman spectroscopy,<br />
automation, computed tomography, nondestructive testing,<br />
and thermal analysis.<br />
Chief Spectroscopic Techniques Supported<br />
⦁ X-ray spectrometry<br />
⦁ Raman spectroscopy<br />
⦁ Energy dispersive X-ray fluorescence (EDXRF)<br />
⦁ Wavelength dispersive X-ray fluorescence (WDXRF)<br />
⦁ Related: X-ray diffraction (XRD)<br />
⦁ Related: X-ray reflectometry (XRR)<br />
Markets Served<br />
Cement, petroleum, mining, refining, pulp and paper, wood<br />
treating, chemicals, pharmaceuticals, biotechnology, forensics,<br />
homeland security, defense, aerospace, energy, metals &<br />
alloys, life sciences, polymers and plastics, inks and dyes,<br />
cosmetics, nanomaterials, photovoltaics, semiconductors, chemistry,<br />
geology and minerals, physics, teaching, and academy.<br />
Major Products/Services<br />
⦁ NEX CG — Cartesian geometry EDXRF<br />
spectrometer<br />
⦁ NEX QC — low cost benchtop EDXRF<br />
analyzer<br />
⦁ Supermini — benchtop WDXRF<br />
spectrometer<br />
⦁ ZSX Primus — 4 kW sequential WDXRF<br />
spectrometer<br />
⦁ ZSX Primus II — 4 kW tube-above<br />
sequential WDXRF<br />
⦁ Simultix 14 — 3 kW (or optional 4 kW)<br />
simultaneous WDXRF spectrometer<br />
⦁ ZSX 400 — large sample sequential<br />
WDXRF spectrometer<br />
⦁ NANOHUNTER — benchtop total reflection<br />
XRF (TXRF)<br />
⦁ MiniFlex II — benchtop X-ray diffractometer<br />
(XRD)<br />
⦁ Xantus — family of portable Raman<br />
spectrometers<br />
⦁ FirstGuard — family of handheld Raman<br />
spectrometers<br />
Facility<br />
Based in Tokyo, Japan, Rigaku is a global<br />
organization with offices, laboratories, and<br />
production facilities around the world.<br />
Major production facilities are located in<br />
Auburn Hills, Michigan; Austin, Texas;<br />
Boston, Massachusetts; Carlsbad, California;<br />
Osaka, Japan; Prague, Czech Republic;<br />
Tokyo, Japan; Tucson, Arizona; The Woodlands,<br />
Texas, and Yamanashi, Japan.
86 SpectroScopy corporAte cApABILItIeS DECEMBER 2011 www.spectroscopyonline.com<br />
Shimadzu Scientific Instruments<br />
⦁ Compact, high-resolution UV-1800<br />
⦁ Easy-to-use UVmini-1240<br />
⦁ Bioscience-oriented BioSpec-mini<br />
⦁ Micro-volume (1 μL to 2 μL samples)<br />
BioSpec-nano<br />
⦁ Single monochromator UV-2600 with<br />
measurement capabilities to 1400 nm<br />
⦁ Double monochromator UV-2700 with<br />
absorbance level to 8 Abs<br />
⦁ Three-detector UV-3600 UV-VIS-NIR<br />
⦁ SolidSpec-3700 UV-VIS-NIR<br />
Shimadzu Scientific<br />
Instruments<br />
7102 Riverwood Drive<br />
Columbia, MD 21046<br />
Telephone<br />
(800) 477-1227<br />
(410) 381-1227<br />
Fax<br />
(410) 381-1222<br />
e-maIl<br />
webmaster@shimadzu.com<br />
Web SITe<br />
www.ssi.shimadzu.com<br />
number oF employeeS<br />
USA: 335<br />
Worldwide: 9600<br />
year Founded<br />
Shimadzu Scientific<br />
Instruments: 1975<br />
Shimadzu Corporation: 1875<br />
Company Description<br />
Shimadzu Scientific Instruments (SSI) is the North American<br />
subsidiary of Shimadzu Corp., headquartered in Kyoto, Japan.<br />
SSI was established in 1975 to provide analytical solutions to a<br />
wide range of laboratories in the Americas. With a vast installed<br />
base and preferred vendor status at many institutions, SSI’s<br />
instruments are used by top researchers across the globe, customers<br />
who can count on the stability, experience, and support<br />
only Shimadzu offers.<br />
Chief Spectroscopic Techniques Supported<br />
⦁ UV–vis<br />
⦁ FT-IR<br />
⦁ Fluorescence<br />
⦁ Atomic (AA/ICP)<br />
⦁ X-Ray (EDX/XRD/XRF)<br />
⦁ GC–MS<br />
⦁ LC–MS-MS<br />
Markets Served<br />
Shimadzu offers more spectroscopy instrumentation, with<br />
more software and accessory options, than any other company.<br />
This flexibility enables spectroscopists in virtually any<br />
laboratory, from biotechnology, pharmaceutical, and industrial<br />
to academic, forensic, and environmental, to select the instrument<br />
best suited to their application. Shimadzu provides free<br />
technical support for the life of the instruments and encourages<br />
customer alliances to further product development.<br />
Major Products/Services<br />
Shimadzu meets your needs for ruggedness, ease of<br />
use, validation, and applications with a variety of UV–vis<br />
spectrophotometers.<br />
FT-IR: Our robust, yet stable, FT-IR spectrophotometers<br />
deliver optimum performance,<br />
sensitivity, and reliability at an exceptional<br />
price, and we offer more of the<br />
sampling accessories you need, including<br />
an automated microscope.<br />
Fluorescence: High-performance spectrofluorophotometer<br />
handles a range of<br />
applications from routine analysis to high<br />
level R&D.<br />
AA/ICP: Simultaneous ICP and our series<br />
of high-quality AA spectrometers offer superior<br />
reliability, precision, sensitivity, and<br />
throughput to deliver maximum performance<br />
and value.<br />
X-ray: Our EDX/XRF/XRD systems are<br />
packed with powerful features to provide<br />
users with versatile, easy-to-use solutions.<br />
Facility<br />
Shimadzu’s U.S. headquarters includes<br />
customer service and technical support,<br />
as well as a customer training and education<br />
center. Ten regional facilities, strategically<br />
located around the U.S., provide<br />
customers with local sales, service, and<br />
technical support.
www.ssi.shimadzu.com<br />
Elevating Excellence in UV-Vis Analyses<br />
From Performance to Price, New Compact, Research-Grade<br />
UV-Vis Spectrophotometers Outclass the Competition<br />
With advanced optical systems engineered to<br />
substantially reduce stray light, Shimadzu’s<br />
new ultra-compact single-monochromator UV-<br />
2600 and double monochromator UV-2700<br />
spectrophotometers offer a number of highperformance<br />
and productivity-enhancing features<br />
to enable confident and convenient use for<br />
routine analysis as well as demanding research<br />
applications. At prices that can’t be beat.<br />
Shimadzu’s UV-2600/2700<br />
spectrophotometers feature:<br />
n<br />
n<br />
n<br />
n<br />
n<br />
n<br />
n<br />
High absorbance level to 8 Abs<br />
Wide measurement range to 1400 nm<br />
Ultra low stray light (0.00005 %T at 220 nm)<br />
Smallest footprint in their class<br />
USB connection<br />
Wide range of accessories and<br />
software packages available<br />
Unbelievable performance/price ratio<br />
For pharmaceutical and<br />
other applications requiring<br />
that hardware be validated,<br />
the UV-2600/2700 Series<br />
provides validation software<br />
as standard.<br />
You have demands. Shimadzu delivers.<br />
Learn more about Shimadzu’s UV-2600/2700.<br />
Call (800) 477-1227 or visit us online at<br />
www.ssi.shimadzu.com/262700<br />
SHIMADZU UV-2600/UV-2700<br />
Order consumables and accessories on-line at http://store.shimadzu.com<br />
Shimadzu Scientific Instruments Inc., 7102 Riverwood Dr., Columbia, MD 21046, USA
88 SpectroScopy corporAte cApABILItIeS DECEMBER 2011<br />
SPEX CertiPrep<br />
www.spectroscopyonline.com<br />
Spex Certiprep<br />
203 Norcross Ave.<br />
Metuchen, NJ 08840<br />
Telephone<br />
(800) 522-7739<br />
Fax<br />
(732) 603-9647<br />
e-maIl<br />
CRMSales@spexcsp.com<br />
Web SITe<br />
www.spexcertiprep.com<br />
year Founded<br />
1954<br />
Company Description<br />
SPEX CertiPrep is a leading manufacturer of Certified Reference<br />
Materials (CRMs) and calibration standards for analytical<br />
spectroscopy and chromatography. We offer a full range of<br />
inorganic CRMs for ICP, ICP-MS, and AA. We are certified by<br />
UL-DQS for ISO 9001:2008 and are proud to be accredited<br />
by A2LA under ISO 17025:2005 and ISO Guide 34-2009. The<br />
scope of our accreditation is the most comprehensive in the industry<br />
and encompasses all of our manufactured products. We<br />
also offer laboratories the option to create their own custom<br />
standards with quick turnaround times, at no additional cost.<br />
Chief Spectroscopic Techniques Supported<br />
⦁ ICP<br />
⦁ ICP-MS<br />
⦁ IC<br />
⦁ AA<br />
⦁ ISE<br />
⦁ XRF<br />
⦁ XRD<br />
Markets Served<br />
SPEX CertiPrep supplies inorganic Certified Reference<br />
Materials to laboratories worldwide in the following markets:<br />
research and development laboratories, environmental<br />
laboratories, wastewater treatment facilities, government<br />
agencies, industrial laboratories, clinical laboratories,<br />
pharmaceutical manufacturers, colleges and universities,<br />
public utilities, oil refineries, nuclear plants, and wineries,<br />
among others.<br />
Major Products/Services<br />
SPEX CertiPrep’s products include aqueous<br />
and organometallic Certified Reference<br />
Materials for ICP-MS, ICP, and AA; ion<br />
chromatography and ion selective electrode<br />
standards; and inorganic and organic<br />
quality control samples. We also manufacture<br />
a line of contamination control<br />
products including sub-boiling acid stills,<br />
a pipette washer, and OdorEroder odor<br />
control products. Our newest product offering<br />
is a line of consumer safety compliance<br />
standards, which includes standards<br />
for use with USP 232, a RoHS/WEEE check<br />
standard, and extractable metals in plastic<br />
toys standards. Our services include shipment<br />
of stock items within 24–48 h from<br />
our Metuchen, New Jersey facility. Technical<br />
customer service is available Monday<br />
through Friday 8:00 a.m. – 5:30 p.m. EST.<br />
Live chat, along with our complete product<br />
catalog and a technical knowledge base is<br />
also available on our website:<br />
www.spexcertiprep.com.<br />
Facility<br />
Our US headquarters is located in<br />
Metuchen, New Jersey. All of our products<br />
are manufactured and shipped from this<br />
facility. SPEX CertiPrep, Ltd. is the<br />
European subsidiary of SPEX CertiPrep,<br />
Inc. and is located in Middlesex, England.<br />
Distributors located throughout the world<br />
extend SPEX CertiPrep’s global reach.
www.spectroscopyonline.com<br />
Teledyne Leeman Labs<br />
DECEMBER 2011 SpectroScopy corporAte cApABILItIeS 89<br />
Teledyne leeman labs<br />
6 Wentworth Drive<br />
Hudson, NH 03051<br />
Telephone<br />
(603) 886-8400<br />
Fax<br />
(603) 886-9141<br />
e-maIl<br />
leemanlabsinfo@teledyne.com<br />
Web SITe<br />
www.teledyneleemanlabs.com<br />
number oF employeeS<br />
60<br />
year Founded<br />
1981<br />
Company Description<br />
Since its founding in 1981,<br />
Teledyne Leeman Labs has<br />
been an innovator in atomic<br />
spectroscopy and introduced<br />
many concepts that are now<br />
considered industry standards.<br />
Among these was the first use<br />
of an Echelle spectrometer<br />
and the first fully automated<br />
mercury analyzer.<br />
As a leading supplier of<br />
instruments for elemental<br />
analysis, we take great pride<br />
in the quality and value of our products and the depth of our<br />
commitment to our customers.<br />
Key <strong>Spectroscopy</strong> Techniques Offered<br />
⦁ Inductively coupled plasma (ICP) spectrometers<br />
⦁ DC Arc spectrometers<br />
⦁ Mercury analysis of liquids, solids and semi solids via cold<br />
vapor atomic absorption or atomic fluorescence<br />
Markets Served<br />
Leeman Lab’s products are used in applications essential to<br />
QA/QC, environmental analysis, research and development<br />
and commercial production. They are used in many industries<br />
including: aerospace, agriculture, automotive, beverage, biofuels,<br />
electronics, energy, environmental/contract labs, gas, food/food<br />
processing, forensics, geological, metals production, mining,<br />
nuclear, petrochemical, petroleum, pharmaceutical, wastewater<br />
and wear metals/oils.<br />
Major Products/Services<br />
Inductively Coupled Plasma Spectrometers (ICP)<br />
Prodigy is our most powerful and versatile ICP spectrometer.<br />
It brings together a state of the art large format, programmable<br />
array detector (L-PAD) with an advanced high dispersion Echelle<br />
spectrometer to provide exceptional analytical performance.<br />
Prism delivers performance and high sample throughput<br />
efficiency via a simultaneous array detector especially suitable<br />
for QA/QC and environmental analysis applications. Our<br />
Profile Plus<br />
ICP is an excellent step up from atomic absorption<br />
spectrometers and a highly cost effective solution for labs with<br />
moderate sample load.<br />
Mercury Analysis<br />
The Hydra II family of automated mercury analyzers operate<br />
on the principle of cold vapor atomic absorption (CVAAS)<br />
spectrometry or atomic fluorescence<br />
(CVAFS). The Hydra II analyzers can be<br />
configured to perform low (ppb to ppt) to<br />
ultra trace (
90 SpectroScopy corporAte cApABILItIeS DECEMBER 2011 www.spectroscopyonline.com<br />
Thermo Fisher Scientific<br />
Markets Served<br />
Our growing portfolio of products includes<br />
innovative technologies for a multitude<br />
of markets including food safety,<br />
environmental testing, materials science,<br />
and pharmaceutical.<br />
Major Products/Services<br />
Thermo Scientific spectroscopy instruments<br />
are ideal for investigative analysis<br />
or quality control applications.<br />
<strong>Spectroscopy</strong> systems are used to determine<br />
the molecular or elemental composition<br />
of a wide range of complex samples,<br />
including liquids, solids, and gases. We offer<br />
an expansive range of techniques, such<br />
as FT-IR, FT-NIR, infrared microsampling,<br />
Raman spectroscopy, AA, ICP, ICP-MS and<br />
ARL OES, XRD and XRF spectrometers.<br />
Thermo Fisher Scientific<br />
Instruments<br />
5225 Verona Road<br />
Madison, WI 53711<br />
Telephone<br />
(800) 532-4752<br />
Fax<br />
(608) 273-5046<br />
e-maIl<br />
analyze@thermofisher.com<br />
Web SITe<br />
www.thermoscientific.com<br />
Company Description<br />
Thermo Fisher Scientific is the world leader in serving science,<br />
enabling our customers to make the world healthier,<br />
cleaner, and safer. Our goal is to make our customers more<br />
productive and to enable them to solve their analytical challenges,<br />
from routine testing to complex research and discovery.<br />
We offer a wide range of products including analytical<br />
instruments, equipment, reagents and consumables, software,<br />
and services for research, analysis, discovery, and diagnostics.<br />
Our manufacturing sites in the United States and<br />
Europe provide products for customers within pharmaceutical<br />
and biotech companies, hospitals and clinical diagnostic<br />
labs, universities, research institutions, and government and<br />
environmental industries.<br />
Chief Spectroscopic Techniques Supported<br />
⦁ AA<br />
⦁ ICP<br />
⦁ ICP-MS<br />
⦁ Combustion analyzers<br />
⦁ FT-IR<br />
⦁ FT-NIR<br />
⦁ UV–vis<br />
⦁ Raman<br />
⦁ EDS/WDS/EBSD<br />
⦁ OES<br />
⦁ XRD<br />
⦁ XRF
www.spectroscopyonline.com<br />
DECEMBER 2011 SpectroScopy corporAte cApABILItIeS 91<br />
Waters<br />
Waters Corporation<br />
34 Maple Street<br />
Milford, MA 01757<br />
Telephone<br />
(508) 478-2000<br />
(800) 252-4752<br />
Fax<br />
(508) 872-1990<br />
Web SITe<br />
www.waters.com<br />
number oF employeeS<br />
USA: 2290<br />
Worldwide: 5200<br />
year Founded<br />
1958<br />
Company Description<br />
Waters Corporation, the premium<br />
brand in the analytical instruments<br />
industry since 1958, creates business<br />
advantages for laboratory-dependent<br />
organizations by delivering practical<br />
and sustainable scientific innovation<br />
to enable significant advancements<br />
in such areas as: healthcare delivery,<br />
environmental management, food<br />
safety, and water quality worldwide.<br />
Waters helps customers make profound<br />
discoveries, optimize laboratory<br />
operations, deliver product<br />
performance, and ensure regulatory<br />
compliance by providing a connected<br />
portfolio of separations and analytical<br />
science, laboratory informatics, mass<br />
spectrometry, as well as thermal analysis products.<br />
Chief Spectroscopic Techniques Supported<br />
⦁ UPLC ® –MS<br />
⦁ UPSFC<br />
⦁ LC–MS<br />
⦁ Mass spectrometry<br />
⦁ Informatics<br />
⦁ Supercritical fluid chromatography (SFC)<br />
⦁ Supercritical fluid extraction (SFE)<br />
⦁ Preparative LC<br />
⦁ Purification solutions<br />
⦁ Thermal analysis<br />
⦁ GC–MS<br />
⦁ Rheology<br />
⦁ Microcalorimetry<br />
⦁ Mycotoxin testing<br />
⦁ Proficiency testing<br />
Markets Served<br />
Waters drives decision-making and improves laboratory effectiveness<br />
within the life sciences, pharmaceutical, environmental,<br />
food and beverage, agriculture, clinical, and chemical industries<br />
by providing the tools to improve the quality of today’s science<br />
and explore the infinite possibilities of tomorrow’s.<br />
Major Products/Services<br />
Instruments<br />
⦁ ACQUITY UPLC ® systems<br />
⦁ ACQUITY UPLC ® H-Class systems<br />
⦁ ACQUITY UPLC ® I-Class systems<br />
⦁ nanoACQUITY UPLC ® with HDX technology<br />
⦁ Alliance ® HPLC systems<br />
⦁ Xevo ® mass spectrometers<br />
⦁ SYNAPT ® mass spectrometers<br />
⦁ PATROL UPLC ® Process Analyzer<br />
⦁ MassTrak Clinical Solutions<br />
⦁ MassTrak Forensic Solutions<br />
⦁ TRIZAIC UPLC ® systems<br />
Chemistries<br />
⦁ ACQUITY UPLC ® columns<br />
⦁ ACQUITY UPLC ® BEH Glycan columns<br />
⦁ ACQUITY UPLC ® CSH columns<br />
⦁ XSelect columns<br />
⦁ Viridis ® SFC columns<br />
⦁ XTerra ® columns<br />
⦁ XBridge columns<br />
⦁ Symmetry ® columns<br />
⦁ TRIZAIC UPLC nanoTile Technology<br />
⦁ Atlantis ® columns<br />
⦁ SunFire columns<br />
⦁ DisQuE sample extraction products<br />
⦁ Oasis ® sample extraction products<br />
⦁ Ostro sample preparation products<br />
⦁ TruView LCMS Certified Vials<br />
Informatics<br />
⦁ Empower chromatography software<br />
(21 CFR Part 11 compliant-ready)<br />
⦁ MassLynx MS software<br />
⦁ NuGenesis ® SDMS software<br />
Services and Support<br />
⦁ Empower -Driven Services<br />
⦁ Compliance Services (IQ,OQ,PQ)<br />
⦁ Waters Quality Parts ®<br />
⦁ Waters Global Services<br />
⦁ Educational Services<br />
Facilities<br />
Waters operates cGMP, ISO 13485: 2003,<br />
and ISO 9001-2008-certified manufacturing<br />
plants in Milford, Massachusetts<br />
(instruments and parts); Manchester, UK<br />
(mass spectrometers); Taunton,<br />
Massachusetts (chemistries); Wexford,<br />
Ireland (chemistries and mass spectrometers);<br />
Waters Milford facility is also<br />
approved for Part 1, Canadian Medical Device<br />
Regulations (CMDR). The company’s<br />
subsidiary, TA Instruments, Inc., is located<br />
in New Castle, Delaware.
92 SpectroScopy corporAte cApABILItIeS DECEMBER 2011 www.spectroscopyonline.com<br />
WITec GmbH<br />
Major Products/Services<br />
WITec alpha300 Confocal Raman<br />
Microscope: The alpha300 R is a Raman<br />
imaging system focusing on high-resolution<br />
as well as high-speed spectra and image<br />
acquisition. The acquisition time for a single<br />
Raman spectrum is in the range of 1 ms or<br />
even below; thus, a complete Raman image<br />
consisting of tens of thousands of spectra<br />
can be obtained in 1 min or less. Differences<br />
in chemical composition, although completely<br />
invisible in the optical image, will be<br />
apparent in the Raman image and can be<br />
analyzed with a resolution down to 200 nm.<br />
WITec Gmbh<br />
Main Address:<br />
Lise-Meitner-Str. 6, 89081<br />
Ulm, Germany<br />
WITec Instruments Corp.<br />
122 McCammon Ave.<br />
Maryville, TN 37804<br />
Telephone<br />
+49 (0) 731 140 700<br />
USA: (865) 984-4445<br />
Fax<br />
+49 (0) 731 140 7020<br />
USA: (865) 984-4441<br />
e-maIl<br />
info@witec.de<br />
Web SITe<br />
www.witec.de<br />
number oF employeeS<br />
35<br />
year Founded<br />
1997<br />
Company Description<br />
WITec is a manufacturer of high-resolution optical and scanning<br />
probe microscopy solutions for scientific and industrial<br />
applications. A modular product line allows the combination<br />
of different microscopy techniques such as Raman, NSOM, or<br />
AFM in one instrument. The company’s product line features<br />
a near-field scanning optical microscope, using unique cantilever<br />
technology, a confocal Raman microscope designed<br />
for highest sensitivity and resolution, and an AFM for material<br />
research and nanotechnology. Focusing on innovations and<br />
constantly introducing new technologies, WITec is the leading<br />
expert for a wide variety of optical, structural, and chemical<br />
imaging tasks.<br />
Chief Spectroscopic Techniques Supported<br />
⦁ Raman spectroscopy<br />
⦁ Confocal Raman imaging<br />
⦁ Ultrafast confocal Raman imaging<br />
⦁ Confocal and near-field fluorescence spectroscopy<br />
⦁ Upgradeable with atomic force and near-field microscopy<br />
capabilities<br />
Markets Served<br />
WITec products are delivered worldwide to academic and<br />
industrial research labs focusing on high-resolution chemical<br />
imaging and materials characterization. Areas of application<br />
for WITec’s confocal Raman imaging systems include polymer<br />
sciences, pharmaceutics, life science, geoscience, thin films<br />
and coating analysis, semiconductors, and nanotechnology.<br />
WITec alpha500 Automated Confocal<br />
Raman & Atomic Force Microscope: The<br />
alpha500 is an automated confocal Raman<br />
and atomic force microscopy system<br />
incorporating a motorized sample stage<br />
for large samples and customized multiarea/multi-point<br />
measurements. It allows<br />
nondestructive chemical imaging with<br />
confocal Raman microscopy as well as<br />
high-resolution topography imaging with<br />
AFM using the integrated piezo scan-stage.<br />
Both modes can be run fully automatically,<br />
guaranteeing the most comprehensive<br />
surface inspection possibilities for systematic<br />
and routine research tasks or highlevel<br />
quality control.<br />
Facilities<br />
WITec Headquarters is located in Ulm,<br />
Germany, and includes the R&D department,<br />
production, sales & marketing, and<br />
administration. WITec Instruments Corp.<br />
in Maryville, Tennessee, is responsible for<br />
North American sales and service activities.
APPLICATION NOTES – DECEMBER 2011 Mass Spectrometry 93<br />
Simultaneous Qualitative and<br />
Quantitative Analysis of<br />
Buspirone and Its Metabolites<br />
with the Agilent 6550 iFunnel<br />
Q-TOF LC–MS System<br />
Yuqin Dai, Michael Flanagan, and Keith Waddell,<br />
Agilent Technologies, Inc.<br />
Timely and rapid assessment of metabolic stability, metabolite<br />
identification, and metabolite profiling is critical for accelerating<br />
lead optimization and enhancing the success rate of drug<br />
candidates entering into development. Traditionally, qualitative<br />
and quantitative analyses are often performed on different types<br />
of LC–MS instruments and in multiple runs. Te ability to obtain<br />
quantitation and identification (qual/quan) in a single analysis<br />
makes metabolic stability, metabolite identification, and metabolite<br />
profiling studies much more efficient. Tis note describes an<br />
integrated qual/quan workflow that is enabled by the sensitivity<br />
enhancement of iFunnel technology implementation on a quadrupole<br />
time-of-flight (Q-TOF) instrument. It demonstrates how Agilent<br />
6550 iFunnel Q-TOF permits high sensitivity, simultaneous<br />
determination of metabolic stability, metabolite identification, and<br />
metabolite profiling in an in vitro buspirone (1 μM) metabolism<br />
study in rat liver microsomes.<br />
An Integrated Qualitative/Quantitative Workflow<br />
Te qual/quan workflow starts with the LC–MS injection of a biological<br />
sample. Using the Agilent 6550 iFunnel Q-TOF LC–MS<br />
system, data acquisition includes a full MS scan followed by three<br />
data dependent auto MS-MS scans. Metabolite identification and<br />
structure elucidation are facilitated by MassHunter Metabolite ID<br />
software. Metabolic stability and metabolite profiling are established<br />
from the same set of data, which are processed in batch<br />
mode by MassHunter Quantitative Analysis software.<br />
Qual/Quan Analysis<br />
Figure 1 illustrates the metabolic stability of buspirone and the<br />
profiles of its metabolites, illustrating broad coverage of the high<br />
and low abundance metabolites across the entire 60-min time<br />
course.<br />
Figure 2 demonstrates the MS and MS-MS spectra of a buspirone<br />
monohydroxyl metabolite from a 10-min incubation<br />
sample. Te sub-ppm mass accuracy of the precursor and fragment<br />
ions, along with the excellent isotopic fidelity (overall score<br />
>99%), provided highly confident metabolite identification and<br />
structure elucidation.<br />
Normalized peak area (%)<br />
100 Buspirone (parent)<br />
90<br />
80<br />
70<br />
60<br />
50<br />
40<br />
30<br />
20<br />
10<br />
dihydroxy<br />
N-oxide<br />
N, N’-desethyl + O<br />
Incubation time (min)<br />
monohydroxy<br />
trihydroxy<br />
N, N’-desethyl<br />
1-Pyrimidinlypiperazine<br />
0<br />
0 10 20 30 40 50 60<br />
Figure 1: Metabolic stability of buspirone and its metabolite<br />
profiles.<br />
x10 5<br />
2.2 123.0918<br />
2<br />
1.8<br />
1.6<br />
1.4<br />
1.2<br />
1<br />
0.8<br />
0.6<br />
0.4<br />
0.2<br />
0<br />
x10 4 122.0713<br />
C6 H8 N3<br />
4<br />
3.5<br />
3<br />
2.5<br />
2<br />
1.5<br />
1<br />
0.5<br />
0<br />
0.07 ppm<br />
155.1539<br />
O<br />
224.1280<br />
150.1023<br />
C8 H12 N3 178.1212 238.1439 281.1859<br />
-2.01 ppm<br />
C9 H14 N4 C13 H20 N O3 C15 H25 N2 O3<br />
-0.39ppm 0.68 ppm -0.41 ppm<br />
Counts vs. Mass-to-Charge (m/z)<br />
MS spectrum<br />
MS/MS spectrum<br />
402.2499<br />
C21 H32 N5 O3<br />
402.2499<br />
120 140 160 180 200 220 240 260 280 300 320 340 360 380 400 420<br />
Figure 2: Excellent mass accuracy in both MS and MS-MS spectra<br />
and isotopic fidelity.<br />
Conclusions<br />
An efficient qual/quan workflow has been developed using the<br />
Agilent 6550 iFunnel Q-TOF LC–MS system combined with two<br />
powerful software tools: MassHunter Metabolite ID and Quantitative<br />
Analysis. Te 6550 iFunnel Q-TOF LC–MS system enables<br />
the simultaneous quantitation and metabolite identification from<br />
1 μM buspirone incubations with sufficient sensitivity, throughput<br />
(run time of 3.5 min), and high analytical confidence. Tis single<br />
analytical platform also allows rapid generic LC–MS method development<br />
and eliminates the time-consuming MRM optimization<br />
for each analyte that is required on a triple quadrupole instrument.<br />
Agilent Technologies Inc.<br />
2315 Stevens Creek Blvd., Santa Clara, CA 95052<br />
tel. (800) 227-9770; Fax (302) 633-8901<br />
Website: www.agilent.com
94 Molecular <strong>Spectroscopy</strong> APPLICATION NOTES – DECEMBER 2011<br />
Long-Wavelength Dispersive<br />
1064 nm Raman: In-Line<br />
Pharmaceutical Compound<br />
Identification<br />
Clare Dentinger, Steven Pullins, and Eric Bergles,<br />
BaySpec, Inc.<br />
Increased capability for in-line pharmaceutical compound<br />
identification is achieved by using dispersive<br />
1064 nm Raman instruments.<br />
Current practice for in-line monitoring of pharmaceuticals<br />
requires that the identity of the raw material be confirmed.<br />
Tis confirmation is, usually, done in industry by removing a<br />
sample of the raw material and doing off-site analysis. In-line<br />
spectroscopy devices, such as Raman instruments, have the<br />
potential to make identifying pharmaceutical raw materials<br />
faster and easier.<br />
Raman spectroscopy is a powerful technique for compound<br />
identification. Te nondestructive Raman analysis produces<br />
compound specific spectra and enables accurate identification.<br />
However, many pharmaceutical materials show significant fluorescence<br />
when Raman spectrometers with 532 nm or 785 nm<br />
excitation are used (1). Tis fluorescence reduces the signal to<br />
the background noise ratio, can significantly increase the acquisition<br />
time, and reduces the number of peaks available for<br />
compound identification.<br />
New laser, optics, and detector technology originally<br />
developed for the telecommunications industry has allowed<br />
BaySpec, Inc. to develop multiple bench-top Raman instruments<br />
including systems with 1064 nm excitation. Te long<br />
excitation wavelength enables significant reduction in fluorescence<br />
while the deep-cooled detectors and dispersive grating,<br />
with no moving parts, while improving reliability for on-site<br />
compound identification.<br />
Figure 1 shows a picture of BaySpec’s 1064 nm RamSpec<br />
Raman instrument designed for high resolution low signal<br />
sensitivity. Te 1064 nm RamSpec can even measure compounds<br />
in containers that are opaque at visible wavelengths and can be<br />
identified without removing a sample from the container. Figure<br />
2 shows the spectra collected from a drug sample at both<br />
1064 nm excitation and 785 nm excitation. With the 785 nm<br />
excitation a large fluorescence band is seen which obscures all<br />
but the strongest Raman bands. However, when the 1064 nm<br />
excitation was used very clear Raman bands are seen and these<br />
bands would allow for definitive identification of the drug.<br />
Figure 1: BaySpec’s RamSpec 1064 nm instrument.<br />
200 700 1200 1700<br />
Raman shift (cm -1 )<br />
1064<br />
Figure 2: Raman spectra of drug measured with 785 nm excitation<br />
and 1064 nm excitation wavelengths.<br />
Long-wavelength dispersive 1064 nm Raman instruments<br />
are now available from BaySpec. For more information on these<br />
and our complete line of spectroscopic instruments contact:<br />
info@bayspec.com.<br />
785<br />
Reference<br />
(1) M. Mathlouthi and D.V. Luu, Carbohyd. Res. 78, 225 (1980).<br />
BaySpec, Inc.<br />
1101 McKay Drive, San Jose, CA 95131<br />
tel. (408) 512-5928<br />
Website: www.bayspec.com<br />
Email: info@bayspec.com
APPLICATION NOTES – DECEMBER 2011 Molecular <strong>Spectroscopy</strong> 95<br />
60000<br />
Various methanol concentrations in 40% ethanol<br />
Determination of Low<br />
Concentration Methanol in<br />
Alcohol by an Affordable<br />
High Sensitivity Raman<br />
Instrument<br />
50000<br />
40000<br />
30000<br />
20000<br />
10000<br />
0ppm<br />
50ppm<br />
0.05 %<br />
0.25 %<br />
1.25 %<br />
2.5 %<br />
Duyen Nguyen and Eric Wu, Enwave Optronics, Inc.<br />
0<br />
250 450 650 850 1050 1250<br />
Raman Shift (cm -1 )<br />
1450 1650 1850<br />
Low concentration natural methanol exists in most alcoholic<br />
beverages and usually causes no immediate health threat.<br />
Nevertheless, it is possible to have natural occurring methanol<br />
in beverages with concentration as high as 18 g/L of ethanol;<br />
or equivalent to 0.72% methanol in 40% ethanol, in alcohol<br />
(1). Current EU regulation limits naturally occurring methanol<br />
to below 10 g/L of ethanol; or equivalent to 0.4% methanol in<br />
40% ethanol.<br />
Raman spectroscopy has been shown to be an efiective tool<br />
in compositions analysis as well as adulteration identiTcations in<br />
foods (2). In the alcoholic beverage industry, the standard composition<br />
analysis method were more expensive and time-consuming<br />
gas chromatography (3). Here, we present a Raman spectroscopy<br />
method for a quick and lower cost alternative to verify the<br />
existence of low concentration methanol in alcohol.<br />
Experiment<br />
40% ethanol/water solution was prepared using 200-proof<br />
ethanol and distilled water. HPLC grade methanol was added<br />
into the 40% ethanol solution to make samples with methanol<br />
concentration ranging from 50 ppm to 2.5%. An Enwave<br />
Optronics’ ProRaman instrument with laser excitation at 785<br />
nm was used for the measurements. The sample solutions<br />
were measured in quartz cuvette in a sample holder. Figure 1<br />
depicts the results of the measured spectra in the fingerprint<br />
region of the Raman spectra.<br />
Partial least square (PLS) regression method was used for calibration<br />
and prediction model for methanol. ffe spectral region<br />
from 950–1200 cm -1 was chosen for developing the calibration<br />
model. ffe actual vs. predicted concentration value of methanol<br />
is shown in Figure 2. It is shown that the measured data and PLS<br />
prediction match very well with correlation coeflcient R 2 @ 0.997.<br />
Conclusion<br />
An afiordable, high sensitivity ProRaman instrument was used<br />
with PLS method to successfully analyze low concentration methanol<br />
in 40% alcohol. Based on our Tndings, the detection limit<br />
for methanol in 40% of ethanol is much better than 50 ppm and<br />
Figure 1: The fingerprint range spectra of the various solutions.<br />
Predicted value (ppm)<br />
24800<br />
19800<br />
14800<br />
9800<br />
4800<br />
-200<br />
reliable quantitative determination using PLS prediction could<br />
reach 50 ppm of methanol in 40% alcohol.<br />
References<br />
(1) F. Bindler, E. Voges, and P. Laugel, Food Addit. Contam. 5, 343–351<br />
(1988).<br />
Actual vs. Predicted concentrations of methanol in 40% ethanol<br />
(2) W.M. Mackenzie and R.I. Aylott, The Analyst 129, 607–612 (2004).<br />
(3) L.M. Reid, C.P. O’Donnell, and G. Downey, Trends in Food Science &<br />
Technology 17, 344–353 (2006).<br />
y = x + 0.0369<br />
R 2 = 0.997<br />
0 5000 10000 15000<br />
Actual concentration (ppm)<br />
20000 25000<br />
Figure 2: Actual and predicted methanol concentrations using<br />
PLS regression model.<br />
Enwave Optronics, Inc.<br />
18200 McDurmott St., Suite B, Irvine, CA 92614<br />
tel. (949) 955-0258; fax (949) 955-0259<br />
Website: www.enwaveopt.com
96 Molecular <strong>Spectroscopy</strong> APPLICATION NOTES – DECEMBER 2011<br />
Optical Compensation in<br />
Variable Angle Transmission<br />
Measurements of Thick<br />
Samples<br />
(a)<br />
(b)<br />
S. L. Berets 1 and M. Milosevic 2 , 1 Harrick Scientific Products,<br />
Inc., and 2 MeV Consulting<br />
Variable angle transmission spectroscopy is used to extract Tlm<br />
thicknesses and refractive index data. fie sample is placed in<br />
the spectrometer at a known incident angle for analysis. fie infrared<br />
or UV–vis beam refracts through the sample in accordance to Snell’s<br />
Law. Consider two samples (n = 1.5), 1-mm and 10-mm thick. Radiation<br />
passing through these samples at a 45° incident angle will be<br />
offset roughly 0.5 mm and 5 mm, respectively. fiis offset radiation<br />
will be misaligned on the detector, reducing the measured transmittance<br />
regardless of sample absorption.<br />
fiis applications note illustrates this problem and presents the use<br />
of a second thickness-matched sample to refract the beam back so it is<br />
properly centered on the detector.<br />
Experimental<br />
fie sample investigated consisted of two pieces of 13.8-mm thick<br />
Plexiglas cut from the same sheet.<br />
fie measurements were carried out using Harrick’s Variable Angle<br />
Transmission Accessory in a UV–vis spectrometer with a nominally<br />
collimated beam. Spectra were collected from 190 nm to 900 nm<br />
with a full aperture and a 1-nm scan interval. Data were collected<br />
with either one or two samples positioned in the beam path at 0° and<br />
60° incident angles. fie double-transmission spectra were adjusted<br />
for comparison to the single-transmission data.<br />
Results and Discussion<br />
fie results are presented in Figure 2. At normal (0°) incidence, there<br />
is little refraction of the beam, so the measurements with and without<br />
compensation should simply show differences in reflectance losses.<br />
Assuming the samples are plane parallel, the reflectance losses on two<br />
plates should be roughly double that of a single plate at normal incidence.<br />
Here, the transmittances are nearly identical indicating that<br />
the surfaces are not plane parallel, so some radiation is defected away<br />
from the detector.<br />
At 60°, the transmittance of single sample shows very little radiation<br />
reaching the detector. A visual comparison of the white light<br />
beam intensity before and after the sample shows a more intense<br />
transmitted beam than expected for
APPLICATION NOTES – DECEMBER 2011 Molecular <strong>Spectroscopy</strong> 97<br />
Near Infrared <strong>Spectroscopy</strong> Is<br />
a Useful Tool in Photovoltaics<br />
Panel Development<br />
90<br />
80<br />
70<br />
Sample 1<br />
Sample 2<br />
Sample 3<br />
Sample 4<br />
Sample 5<br />
% Reflection: Samples with Film Side Up<br />
60<br />
Rob Morris and Andrew Tatsch, Ocean Optics<br />
With their modest cost, compact size and great<br />
fiexibility, UV-VIS-NIR miniature fiber optic spectro<br />
meters are attractive analytical tools for photovoltaic<br />
materials research and quality control. Typical<br />
applications include analysis of the optical properties<br />
of solar cell materials, spectroradiometric measurement<br />
of solar simulators used in panel testing and<br />
quality control in panel production.<br />
We evaluated NIR spectroscopy as a method to measure the<br />
refiection of photovoltaic panel materials. A manufacturer<br />
of thin fflm photovoltaic panels requested NIR refiectivity analysis<br />
of several coated glass samples. Measurements were conducted<br />
from 1200–2100 nm under ambient lab lighting conditions.<br />
Because the absorbance of photovoltaic panels is so critical,<br />
determining the refiectivity at panel edges and elsewhere is a<br />
good indicator of the light loss at those areas. Te use of antirefiective<br />
coatings and glass dopants are among the approaches<br />
manufacturers may evaluate in improving panel eflciency.<br />
Experimental Conditions<br />
Five coated glass samples were analyzed with an Ocean Optics<br />
NIRQuest256-2.1 Spectrometer conffgured with a 100 µm slit<br />
and optimized for the range from 1200–2100 nm. Te sampling<br />
setup comprised a tungsten halogen light source, 400 µm refiection<br />
probe and an optical stage. A specular refiection standard was<br />
used as a reference. SpectraSuite spectrometer operating software<br />
completed the setup.<br />
Te glass samples were placed on the sample holder uncoated<br />
side down, to ensure that the probe measured the refiection from<br />
the coating through the glass. Te optical stage helped to position<br />
the probe at 90° to measure specular refiectance.<br />
Measurements were taken under overhead lighting conditions.<br />
Te high-powered (20 W) tungsten halogen light source provided<br />
continuous illumination from 360–2000 nm. Te distance from<br />
the tip of the refiection probe to the surface of the sample was measured<br />
at ~7 cm for each sample, to simulate production conditions.<br />
Ocean Optics NIR Spectrometers use a high-performance<br />
InGaAs-array detector in a compact optical bench with thermoelectric<br />
cooler and low-noise electronics. Te NIRQuest256-2.1 is<br />
suited to applications involving higher wavelengths (peak responsivity<br />
is ~1900 nm). Te spectrometer’s rapid integration times —<br />
% Reflection (relative)<br />
50<br />
40<br />
30<br />
20<br />
10<br />
0<br />
1250 1350 1450 1550 1650<br />
Wavelength (nm)<br />
1750 1850 1950 2050<br />
Figure 1: NIR specular refiection of photovoltaic materials (coated<br />
glass samples).<br />
spectral acquisition of 1 ms is possible — makes it viable for high<br />
volume production environments.<br />
Results<br />
Te measurements showed good stability with no averaging and<br />
boxcar smoothing. Te refiection spectra for the samples (Figure 1)<br />
demonstrated that refiection values increased as a function of wavelength<br />
comparably across all ffve samples, peaking at about 2000 nm.<br />
Also, the gap between the least refiective and most refiective samples<br />
was relatively narrow at the lower and upper ranges of the wavelength<br />
range, with the greatest variation observed near 1700 nm.<br />
Refiectance intensity of the coated samples ranged from ~25%<br />
at the lower wavelengths to as much as 80% at the higher wavelengths.<br />
Tese values are relative to the response of the specular<br />
refiectance standard, which has nearly “fiat” refiectivity across all<br />
NIR wavelengths.<br />
Conclusions<br />
As developers of photovoltaic materials seek improvement in cell<br />
eflciency, the need for convenient analytical tools to evaluate glass<br />
coatings, dopants and other materials is great. Optical sensing systems<br />
such as NIR spectrometers, thin fflm measurement systems and solar<br />
simulator testing units are easily conffgured for both research lab and<br />
process line applications.<br />
NIR spectroscopy can be used to determine the specular refiectivity<br />
of coated glass samples relative to each other and to known refiectance<br />
standards. As a result, the solar light capturing eflciency of<br />
the ffve sample coatings now can be inferred with the utilized Ocean<br />
Optics spectrometer and accessories.<br />
Ocean Optics, Inc.<br />
830 Douglas Ave., Dunedin, FL 34698<br />
tel. (727) 733-2447; Fax (727) 733-3962<br />
Website: www.oceanoptics.com; Email: info@oceanoptics.com
98 Molecular <strong>Spectroscopy</strong> APPLICATION NOTES – DECEMBER 2011<br />
Mid-Infrared Refiectivity Measurements of<br />
Diffuse Materials<br />
Jenni L. Briggs, PIKE Technologies<br />
The approach to infrared measurements of diffusely<br />
scattering materials often is dictated by the objective<br />
of the analysis. Spectral data from three different<br />
mid-infrared refiectance sampling accessories are<br />
contrasted.<br />
100<br />
95<br />
90<br />
85<br />
80<br />
75<br />
70<br />
Infrared analysis of highly scattering or textured samples is often<br />
accomplished via diffuse refiectance sampling accessories.<br />
Among two of the most popular diffuse refiectance accessories<br />
are the confocal ellipsoidal mirror design, which results in only a<br />
fraction of the refiected light being collected, and the integrating<br />
sphere design (1). Te speciflc accessory used for the measurement<br />
will be determined by the information desired. Te aim of<br />
this application note is to compare mid-infrared spectral data of<br />
a diffuse sample obtained by using various refiection accessories.<br />
Experimental Conditions<br />
A powdered coated metal panel was analyzed using the PIKE<br />
UpIR , a diffuse refiection accessory with an ellipsoidal collection<br />
mirror, or the PIKE mid-infrared IntegratIR , a<br />
gold-coated integrating sphere equipped with a liquid nitrogen<br />
cooled MCT detector. Te sampling surface of the UpIR<br />
is positioned above the FT-IR making it ideal for analyzing<br />
large samples. Additionally, a spectrum was collected using a<br />
10 o specular refiection accessory. Te background and sample<br />
collection time was 20 s, and the resolution was set to 4 cm -1 .<br />
Results<br />
All spectra are shown in Figure 1. Te spectrum of the powdered<br />
coated sample collected with the 10° specular refiection<br />
accessory resulted in refiectivity values near 1% and minimal<br />
chemical information is discernable due to the diffuse characteristic<br />
of this sample. Only the specular component refiecting at<br />
the angle equivalent to the angle of incidence, 10° in this case,<br />
is collected. Specular refiection accessories are appropriate for<br />
specular samples such as mirrors, optical windows, and coatings<br />
on refiective surfaces.<br />
Chemical information from a high quality spectrum is obtained<br />
from the ellipsoidal collection mirror (UpIR) and the integrating<br />
sphere accessory. Terefore, either accessory is suitable for<br />
this purpose. Te refiectivity measurements were different; at 4000<br />
cm -1 65% refiectivity was measured using the integrating sphere<br />
while the refiectivity of the sample collected using the UpIR was<br />
93%. However, only the integrating sphere accessory produces re-<br />
% Reflectance<br />
65<br />
60<br />
55<br />
50<br />
45<br />
40<br />
35<br />
30<br />
25<br />
20<br />
15<br />
10<br />
5<br />
0<br />
4000 3500 3000 2500 2000 1500 1000 500<br />
Wavenumber (cm -1 )<br />
Figure 1: Spectrum of painted panel obtained using an elliptical<br />
collection type accessory (shown in purple), an integrating<br />
sphere ( shown in blue), and a 10 o specular refiection accessory<br />
(shown in red).<br />
liable refiectivity data because it is able to collect close to the entire<br />
available hemispherical (2π steradians) scattered photons.<br />
Te integrating sphere has a highly refiective, close to a Lambertian<br />
surface, such that the light enters the sphere, bounces<br />
around the highly refiective diffuse surface of the sphere wall,<br />
and flnally impinges upon the detector. In addition to refiectivity<br />
measurements as described here, the PIKE IntegratIR may be<br />
used for diffuse transmission measurements. Despite the 100 year<br />
history of the sphere, new applications are continually developed.<br />
Conclusions<br />
For refiectivity measurements of diffuse samples, using an integrating<br />
sphere is preferred, whereas for obtaining only chemical<br />
information a ellipsoidal mirror design diffuse refiection<br />
accessory is adequate.<br />
References<br />
(1) L.M. Hanssen and K.A. Snail, Handbook of Vibrational <strong>Spectroscopy</strong>, Chalmers<br />
and Griffiths, Eds. (2002).<br />
PIKE Technologies<br />
6125 Cottonwood Drive, Madison, WI 53719<br />
tel. (608) 274-2721; fax (608) 274-0103<br />
Website: www.PIKEtech.com
<strong>Spectroscopy</strong>’s<br />
Global Digital Edition<br />
Subscribe to the first global digital magazine for spectroscopists<br />
<strong>Spectroscopy</strong>’s Global Digital Edition provides practitioners of spectroscopic techniques<br />
from around the world access to the same objective, peer-reviewed, nuts-and-bolts<br />
technical information found in the monthly print edition. The digital edition is delivered<br />
to professionals in the U.S., Europe, Asia, and elsewhere, as <strong>Spectroscopy</strong> continues to<br />
recognize the global scale of the issues faced by spectroscopists in labs worldwide.<br />
Created specifically for on-the-go professionals, <strong>Spectroscopy</strong>’s Global Digital Edition is:<br />
❯ Convenient - Delivered directly to your inbox and easily accessible with a click of the mouse<br />
❯ International - Available to all spectroscopic professionals, anywhere in the world<br />
❯ Timely - The most up-to-date technical, application-oriented articles and features<br />
at your fingertips in the spectroscopy industry providing up to date news,<br />
interactive web seminars, podcasts, archived articles and opinion surveys.<br />
SUBSCRIBE FREE<br />
www.spectroscopyonline.com/digitalsubscribe