Higher aspirations: an agenda for reforming European universities
Higher aspirations: an agenda for reforming European universities
Higher aspirations: an agenda for reforming European universities

Create successful ePaper yourself
Turn your PDF publications into a flip-book with our unique Google optimized e-Paper software.
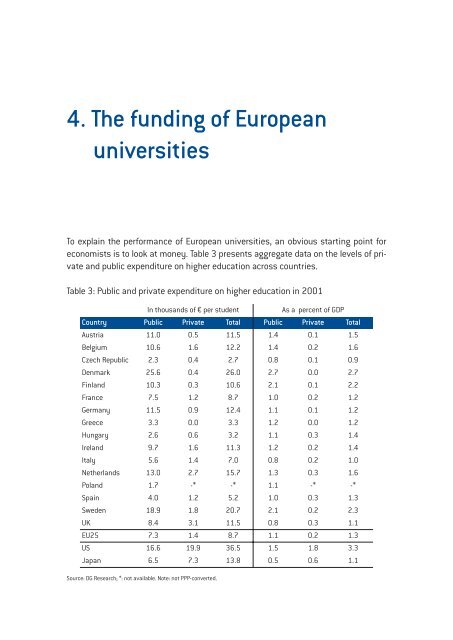
4. The funding of Europe<strong>an</strong><br />
<strong>universities</strong><br />
To explain the per<strong>for</strong>m<strong>an</strong>ce of Europe<strong>an</strong> <strong>universities</strong>, <strong>an</strong> obvious starting point <strong>for</strong><br />
economists is to look at money. Table 3 presents aggregate data on the levels of private<br />
<strong>an</strong>d public expenditure on higher education across countries.<br />
Table 3: Public <strong>an</strong>d private expenditure on higher education in 2001<br />
In thous<strong>an</strong>ds of € per student<br />
As a percent of GDP<br />
Country Public Private Total Public Private Total<br />
Austria 11.0 0.5 11.5 1.4 0.1 1.5<br />
Belgium 10.6 1.6 12.2 1.4 0.2 1.6<br />
Czech Republic 2.3 0.4 2.7 0.8 0.1 0.9<br />
Denmark 25.6 0.4 26.0 2.7 0.0 2.7<br />
Finl<strong>an</strong>d 10.3 0.3 10.6 2.1 0.1 2.2<br />
Fr<strong>an</strong>ce 7.5 1.2 8.7 1.0 0.2 1.2<br />
Germ<strong>an</strong>y 11.5 0.9 12.4 1.1 0.1 1.2<br />
Greece 3.3 0.0 3.3 1.2 0.0 1.2<br />
Hungary 2.6 0.6 3.2 1.1 0.3 1.4<br />
Irel<strong>an</strong>d 9.7 1.6 11.3 1.2 0.2 1.4<br />
Italy 5.6 1.4 7.0 0.8 0.2 1.0<br />
Netherl<strong>an</strong>ds 13.0 2.7 15.7 1.3 0.3 1.6<br />
Pol<strong>an</strong>d 1.7 -* -* 1.1 -* -*<br />
Spain 4.0 1.2 5.2 1.0 0.3 1.3<br />
Sweden 18.9 1.8 20.7 2.1 0.2 2.3<br />
UK 8.4 3.1 11.5 0.8 0.3 1.1<br />
EU25 7.3 1.4 8.7 1.1 0.2 1.3<br />
US 16.6 19.9 36.5 1.5 1.8 3.3<br />
Jap<strong>an</strong> 6.5 7.3 13.8 0.5 0.6 1.1<br />
Source: DG Research; *: not available. Note: not PPP-converted.