

Thermal X-ray radiation (PDF) - SRON
Thermal X-ray radiation (PDF) - SRON
Thermal X-ray radiation (PDF) - SRON

You also want an ePaper? Increase the reach of your titles
YUMPU automatically turns print PDFs into web optimized ePapers that Google loves.
exercise 3.12. The hydrogen column density to the Galactic pole is about 10 24 m −2 .<br />
How large is the transmission for photons of 0.1, 0.2, 1 and 10 keV?<br />
Complexity of the ISM<br />
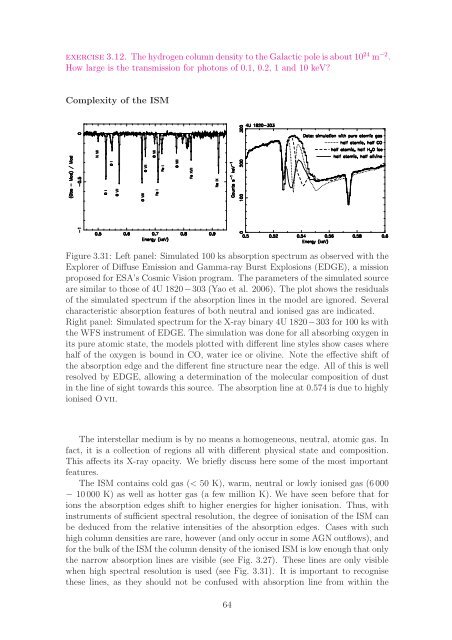
Figure 3.31: Left panel: Simulated 100 ks absorption spectrum as observed with the<br />
Explorer of Diffuse Emission and Gamma-<strong>ray</strong> Burst Explosions (EDGE), a mission<br />
proposed for ESA’s Cosmic Vision program. The parameters of the simulated source<br />
are similar to those of 4U 1820−303 (Yao et al. 2006). The plot shows the residuals<br />
of the simulated spectrum if the absorption lines in the model are ignored. Several<br />
characteristic absorption features of both neutral and ionised gas are indicated.<br />
Right panel: Simulated spectrum for the X-<strong>ray</strong> binary 4U 1820−303 for 100 ks with<br />
the WFS instrument of EDGE. The simulation was done for all absorbing oxygen in<br />
its pure atomic state, the models plotted with different line styles show cases where<br />
half of the oxygen is bound in CO, water ice or olivine. Note the effective shift of<br />
the absorption edge and the different fine structure near the edge. All of this is well<br />
resolved by EDGE, allowing a determination of the molecular composition of dust<br />
in the line of sight towards this source. The absorption line at 0.574 is due to highly<br />
ionised Ovii.<br />
The interstellar medium is by no means a homogeneous, neutral, atomic gas. In<br />
fact, it is a collection of regions all with different physical state and composition.<br />
This affects its X-<strong>ray</strong> opacity. We briefly discuss here some of the most important<br />
features.<br />
The ISM contains cold gas (< 50 K), warm, neutral or lowly ionised gas (6000<br />
− 10000 K) as well as hotter gas (a few million K). We have seen before that for<br />
ions the absorption edges shift to higher energies for higher ionisation. Thus, with<br />
instruments of sufficient spectral resolution, the degree of ionisation of the ISM can<br />
be deduced from the relative intensities of the absorption edges. Cases with such<br />
high column densities are rare, however (and only occur in some AGN outflows), and<br />
for the bulk of the ISM the column density of the ionised ISM is low enough that only<br />
the narrow absorption lines are visible (see Fig. 3.27). These lines are only visible<br />
when high spectral resolution is used (see Fig. 3.31). It is important to recognise<br />
these lines, as they should not be confused with absorption line from within the<br />
64


