A comparison of bathymetry mapped with the Simrad ME70 ...
A comparison of bathymetry mapped with the Simrad ME70 ...
A comparison of bathymetry mapped with the Simrad ME70 ...

You also want an ePaper? Increase the reach of your titles
YUMPU automatically turns print PDFs into web optimized ePapers that Google loves.
Page 2 <strong>of</strong> 9<br />
G. R. Cutter et al.<br />
Organization’s (IHO) S–44 Order 1 standard (Kongsberg<br />
Maritime, 2003).<br />
In terms <strong>of</strong> seabed mapping, <strong>the</strong> principal difference between<br />
<strong>the</strong> FM and <strong>the</strong> BM is <strong>the</strong> seabed-detection scheme, although<br />
<strong>the</strong>re are o<strong>the</strong>r differences such as <strong>the</strong> number <strong>of</strong> beams, transmit<br />
power, and side-lobe suppression. Near-normal incidence, <strong>the</strong><br />
sample corresponding to <strong>the</strong> seabed range, can be estimated accurately<br />
using <strong>the</strong> peak or centre-<strong>of</strong>-mass <strong>of</strong> <strong>the</strong> seabed echo, after<br />
filtering or thresholding to avoid spurious detections <strong>of</strong> <strong>the</strong> transmit<br />
pulse or strong water-column scatterers. However, for oblique<br />
angles caused by <strong>the</strong> orientation <strong>of</strong> <strong>the</strong> transducer, <strong>the</strong> beam direction,<br />
and <strong>the</strong> seabed slope, <strong>the</strong> phase differences between wavefronts<br />
received by different elements or portions <strong>of</strong> <strong>the</strong> receiver<br />
array (interferometric phase differences) can be used to estimate<br />
more accurately <strong>the</strong> range to <strong>the</strong> seabed. The moment when <strong>the</strong><br />
phase difference is equal to zero indicates <strong>the</strong> range to <strong>the</strong><br />
seabed at <strong>the</strong> centre <strong>of</strong> <strong>the</strong> beam. However, interferometric<br />
phase can be used to estimate multiple ranges to <strong>the</strong> seabed<br />
<strong>with</strong>in each beam (Jin and Tang, 1996). The BM employs both<br />
strategies, dependent on incidence angle and echo properties,<br />
whereas <strong>the</strong> default method in FM is only peak-echo detection.<br />
Note that <strong>the</strong> seabed-detection algorithms employed in BM can<br />
also be used <strong>with</strong> <strong>the</strong> FM data. Therefore, <strong>with</strong> custom algorithms<br />
and s<strong>of</strong>tware, bathymetric data can be obtained from <strong>the</strong> <strong>ME70</strong><br />
operating in FM and S v . TS can be sampled from <strong>the</strong> <strong>ME70</strong> operating<br />
in BM (see Figure 1 for more details). This flexibility allows<br />
data on fish and <strong>the</strong>ir seabed habitat to be collected concurrently<br />
and efficiently.<br />
Here, we demonstrate that <strong>the</strong> <strong>ME70</strong> operating in FM can<br />
produce high-resolution <strong>bathymetry</strong> data that are equivalent to<br />
those produced by <strong>the</strong> <strong>ME70</strong> operating in BM. Such processing<br />
allows <strong>the</strong> <strong>ME70</strong> to collect data simultaneously and efficiently<br />
from marine organisms, <strong>the</strong>ir seabed habitat, and navigationalquality<br />
bathymetric maps, <strong>with</strong>out <strong>the</strong> configuration limitations<br />
<strong>of</strong> <strong>the</strong> BM and <strong>the</strong> costs associated <strong>with</strong> <strong>the</strong> bathymetric option<br />
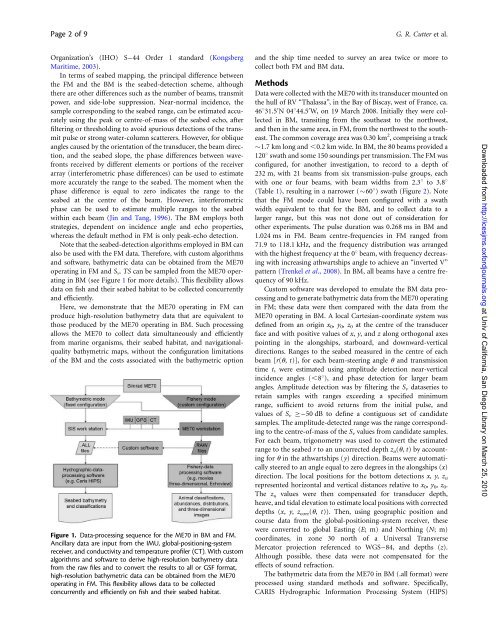
Figure 1. Data-processing sequence for <strong>the</strong> <strong>ME70</strong> in BM and FM.<br />
Ancillary data are input from <strong>the</strong> IMU, global-positioning-system<br />
receiver, and conductivity and temperature pr<strong>of</strong>iler (CT). With custom<br />
algorithms and s<strong>of</strong>tware to derive high-resolution <strong>bathymetry</strong> data<br />
from <strong>the</strong> raw files and to convert <strong>the</strong> results to all or GSF format,<br />
high-resolution bathymetric data can be obtained from <strong>the</strong> <strong>ME70</strong><br />
operating in FM. This flexibility allows data to be collected<br />
concurrently and efficiently on fish and <strong>the</strong>ir seabed habitat.<br />
and <strong>the</strong> ship time needed to survey an area twice or more to<br />
collect both FM and BM data.<br />
Methods<br />
Data were collected <strong>with</strong> <strong>the</strong> <strong>ME70</strong> <strong>with</strong> its transducer mounted on<br />
<strong>the</strong> hull <strong>of</strong> RV “Thalassa”, in <strong>the</strong> Bay <strong>of</strong> Biscay, west <strong>of</strong> France, ca.<br />
46831.5 0 N04844.5 0 W, on 19 March 2008. Initially <strong>the</strong>y were collected<br />
in BM, transiting from <strong>the</strong> sou<strong>the</strong>ast to <strong>the</strong> northwest,<br />
and <strong>the</strong>n in <strong>the</strong> same area, in FM, from <strong>the</strong> northwest to <strong>the</strong> sou<strong>the</strong>ast.<br />
The common coverage area was 0.30 km 2 , comprising a track<br />
1.7 km long and ,0.2 km wide. In BM, <strong>the</strong> 80 beams provided a<br />
1208 swath and some 150 soundings per transmission. The FM was<br />
configured, for ano<strong>the</strong>r investigation, to record to a depth <strong>of</strong><br />
232 m, <strong>with</strong> 21 beams from six transmission-pulse groups, each<br />
<strong>with</strong> one or four beams, <strong>with</strong> beam widths from 2.38 to 3.88<br />
(Table 1), resulting in a narrower (608) swath (Figure 2). Note<br />
that <strong>the</strong> FM mode could have been configured <strong>with</strong> a swath<br />
width equivalent to that for <strong>the</strong> BM, and to collect data to a<br />
larger range, but this was not done out <strong>of</strong> consideration for<br />
o<strong>the</strong>r experiments. The pulse duration was 0.268 ms in BM and<br />
1.024 ms in FM. Beam centre-frequencies in FM ranged from<br />
71.9 to 118.1 kHz, and <strong>the</strong> frequency distribution was arranged<br />
<strong>with</strong> <strong>the</strong> highest frequency at <strong>the</strong> 08 beam, <strong>with</strong> frequency decreasing<br />
<strong>with</strong> increasing athwartships angle to achieve an “inverted V”<br />
pattern (Trenkel et al., 2008). In BM, all beams have a centre frequency<br />
<strong>of</strong> 90 kHz.<br />
Custom s<strong>of</strong>tware was developed to emulate <strong>the</strong> BM data processing<br />
and to generate bathymetric data from <strong>the</strong> <strong>ME70</strong> operating<br />
in FM; <strong>the</strong>se data were <strong>the</strong>n compared <strong>with</strong> <strong>the</strong> data from <strong>the</strong><br />
<strong>ME70</strong> operating in BM. A local Cartesian-coordinate system was<br />
defined from an origin x 0 ,y 0 ,z 0 at <strong>the</strong> centre <strong>of</strong> <strong>the</strong> transducer<br />
face and <strong>with</strong> positive values <strong>of</strong> x, y, and z along orthogonal axes<br />
pointing in <strong>the</strong> alongships, starboard, and downward-vertical<br />
directions. Ranges to <strong>the</strong> seabed measured in <strong>the</strong> centre <strong>of</strong> each<br />
beam [r(u, t)], for each beam-steering angle u and transmission<br />
time t, were estimated using amplitude detection near-vertical<br />
incidence angles (,88), and phase detection for larger beam<br />
angles. Amplitude detection was by filtering <strong>the</strong> S v dataseries to<br />
retain samples <strong>with</strong> ranges exceeding a specified minimum<br />
range, sufficient to avoid returns from <strong>the</strong> initial pulse, and<br />
values <strong>of</strong> S v –50 dB to define a contiguous set <strong>of</strong> candidate<br />
samples. The amplitude-detected range was <strong>the</strong> range corresponding<br />
to <strong>the</strong> centre-<strong>of</strong>-mass <strong>of</strong> <strong>the</strong> S v values from candidate samples.<br />
For each beam, trigonometry was used to convert <strong>the</strong> estimated<br />
range to <strong>the</strong> seabed r to an uncorrected depth z u (u, t) by accounting<br />
for u in <strong>the</strong> athwartships (y) direction. Beams were automatically<br />
steered to an angle equal to zero degrees in <strong>the</strong> alongships (x)<br />
direction. The local positions for <strong>the</strong> bottom detections x, y, z u<br />
represented horizontal and vertical distances relative to x 0 ,y 0 ,z 0 .<br />
The z u values were <strong>the</strong>n compensated for transducer depth,<br />
heave, and tidal elevation to estimate local positions <strong>with</strong> corrected<br />
depths (x, y, z corr (u, t)). Then, using geographic position and<br />
course data from <strong>the</strong> global-positioning-system receiver, <strong>the</strong>se<br />
were converted to global Easting (E; m) and Northing (N; m)<br />
coordinates, in zone 30 north <strong>of</strong> a Universal Transverse<br />
Mercator projection referenced to WGS–84, and depths (z).<br />
Although possible, <strong>the</strong>se data were not compensated for <strong>the</strong><br />
effects <strong>of</strong> sound refraction.<br />
The bathymetric data from <strong>the</strong> <strong>ME70</strong> in BM (.all format) were<br />
processed using standard methods and s<strong>of</strong>tware. Specifically,<br />
CARIS Hydrographic Information Processing System (HIPS)<br />
Downloaded from http://icesjms.oxfordjournals.org at Univ <strong>of</strong> California, San Diego Library on March 25, 2010