A comparison of bathymetry mapped with the Simrad ME70 ...
A comparison of bathymetry mapped with the Simrad ME70 ...
A comparison of bathymetry mapped with the Simrad ME70 ...

You also want an ePaper? Increase the reach of your titles
YUMPU automatically turns print PDFs into web optimized ePapers that Google loves.
Page 4 <strong>of</strong> 9<br />
G. R. Cutter et al.<br />
s<strong>of</strong>tware was used to remove outliers, examine <strong>the</strong> motion data,<br />
compensate for tidal elevation and refraction, merge data, create<br />
surfaces, and export <strong>the</strong> results for display and <strong>comparison</strong> in<br />
ESRI ArcMap GIS.<br />
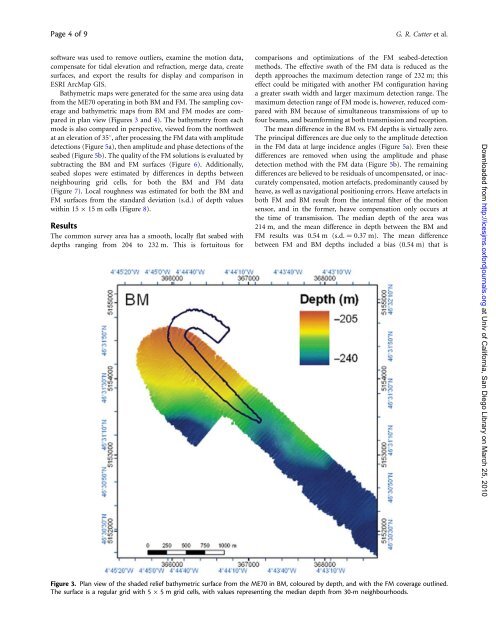
Bathymetric maps were generated for <strong>the</strong> same area using data<br />
from <strong>the</strong> <strong>ME70</strong> operating in both BM and FM. The sampling coverage<br />
and bathymetric maps from BM and FM modes are compared<br />
in plan view (Figures 3 and 4). The <strong>bathymetry</strong> from each<br />
mode is also compared in perspective, viewed from <strong>the</strong> northwest<br />
at an elevation <strong>of</strong> 358, after processing <strong>the</strong> FM data <strong>with</strong> amplitude<br />
detections (Figure 5a), <strong>the</strong>n amplitude and phase detections <strong>of</strong> <strong>the</strong><br />
seabed (Figure 5b). The quality <strong>of</strong> <strong>the</strong> FM solutions is evaluated by<br />
subtracting <strong>the</strong> BM and FM surfaces (Figure 6). Additionally,<br />
seabed slopes were estimated by differences in depths between<br />
neighbouring grid cells, for both <strong>the</strong> BM and FM data<br />
(Figure 7). Local roughness was estimated for both <strong>the</strong> BM and<br />
FM surfaces from <strong>the</strong> standard deviation (s.d.) <strong>of</strong> depth values<br />
<strong>with</strong>in 15 15 m cells (Figure 8).<br />
Results<br />
The common survey area has a smooth, locally flat seabed <strong>with</strong><br />
depths ranging from 204 to 232 m. This is fortuitous for<br />
<strong>comparison</strong>s and optimizations <strong>of</strong> <strong>the</strong> FM seabed-detection<br />
methods. The effective swath <strong>of</strong> <strong>the</strong> FM data is reduced as <strong>the</strong><br />
depth approaches <strong>the</strong> maximum detection range <strong>of</strong> 232 m; this<br />
effect could be mitigated <strong>with</strong> ano<strong>the</strong>r FM configuration having<br />
a greater swath width and larger maximum detection range. The<br />
maximum detection range <strong>of</strong> FM mode is, however, reduced compared<br />
<strong>with</strong> BM because <strong>of</strong> simultaneous transmissions <strong>of</strong> up to<br />
four beams, and beamforming at both transmission and reception.<br />
The mean difference in <strong>the</strong> BM vs. FM depths is virtually zero.<br />
The principal differences are due only to <strong>the</strong> amplitude detection<br />
in <strong>the</strong> FM data at large incidence angles (Figure 5a). Even <strong>the</strong>se<br />
differences are removed when using <strong>the</strong> amplitude and phase<br />
detection method <strong>with</strong> <strong>the</strong> FM data (Figure 5b). The remaining<br />
differences are believed to be residuals <strong>of</strong> uncompensated, or inaccurately<br />
compensated, motion artefacts, predominantly caused by<br />
heave, as well as navigational positioning errors. Heave artefacts in<br />
both FM and BM result from <strong>the</strong> internal filter <strong>of</strong> <strong>the</strong> motion<br />
sensor, and in <strong>the</strong> former, heave compensation only occurs at<br />
<strong>the</strong> time <strong>of</strong> transmission. The median depth <strong>of</strong> <strong>the</strong> area was<br />
214 m, and <strong>the</strong> mean difference in depth between <strong>the</strong> BM and<br />
FM results was 0.54 m (s.d. ¼ 0.37 m). The mean difference<br />
between FM and BM depths included a bias (0.54 m) that is<br />
Downloaded from http://icesjms.oxfordjournals.org at Univ <strong>of</strong> California, San Diego Library on March 25, 2010<br />
Figure 3. Plan view <strong>of</strong> <strong>the</strong> shaded relief bathymetric surface from <strong>the</strong> <strong>ME70</strong> in BM, coloured by depth, and <strong>with</strong> <strong>the</strong> FM coverage outlined.<br />
The surface is a regular grid <strong>with</strong> 5 5 m grid cells, <strong>with</strong> values representing <strong>the</strong> median depth from 30-m neighbourhoods.