Measuring the Economic Output of the Education Sector in the ...
Measuring the Economic Output of the Education Sector in the ...
Measuring the Economic Output of the Education Sector in the ...

You also want an ePaper? Increase the reach of your titles
YUMPU automatically turns print PDFs into web optimized ePapers that Google loves.
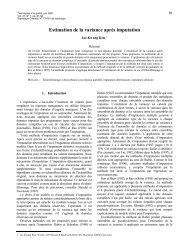
Table 9<br />
Regression results for <strong>the</strong> log <strong>of</strong> literacy scores <strong>in</strong> Canada<br />
Variable<br />
Model 1 Model 2<br />
Model 3<br />
coefficient t-stat coefficient t-stat coefficient t-stat<br />
Constant 5.3040 106.75 5.1631 63.97 5.0467 43.36<br />
Some or completed high school 0.3118 6.24 0.4170 5.11 0.4259 3.91<br />
Post-secondary education below<br />
bachelor's 0.3774 7.55 0.5110 6.27 0.5273 4.85<br />
Bachelor's degree 0.4426 8.86 0.5657 6.95 0.5665 5.21<br />
Master's degree and above 0.4872 9.69 0.6077 7.35 0.6168 5.66<br />
Time × 0 to 8 years <strong>of</strong> school<strong>in</strong>g ... ... 0.0086 2.24 0.0099 1.93<br />
Time × some or completed high school ... ... 0.0021 3.42 0.0017 1.75<br />
Time × post-secondary education below<br />
bachelor's ... ... 0.0005 0.70 -0.0008 -1.07<br />
Time × bachelor's degree ... ... 0.0011 1.76 -0.0006 -0.78<br />
Time × master's degree or above ... ... 0.0012 1.35 -0.0008 -1.09<br />
Female ... ... ... ... -0.0102 -1.74<br />
Age ... ... ... ... 0.0080 4.44<br />
Age squared ... ... ... ... -0.0001 -5.82<br />
Good math grades ... ... ... ... 0.0473 8.20<br />
Teachers too fast ... ... ... ... -0.0258 -2.01<br />
Read<strong>in</strong>g difficulties ... ... ... ... -0.0637 -5.21<br />
Mo<strong>the</strong>r post-secondary education ... ... ... ... 0.0360 5.69<br />
Fa<strong>the</strong>r post-secondary education ... ... ... ... 0.0338 5.74<br />
Mo<strong>the</strong>r Canadian ... ... ... ... -0.0143 -1.37<br />
Fa<strong>the</strong>r Canadian ... ... ... ... 0.0051 0.53<br />
Source: Statistics Canada, authors' calculations.<br />
The results for <strong>the</strong> effects <strong>of</strong> <strong>the</strong> student-ability and family-background variables on literacy<br />
scores are consistent with those <strong>in</strong> Green and Riddell (2007). Student ability and parental<br />
education levels both have positive effects on literacy scores. The immigration status <strong>of</strong> parents<br />
does not appear to have a significant effect on literacy scores. Controll<strong>in</strong>g for <strong>the</strong> effect <strong>of</strong><br />
student ability and <strong>of</strong> family background does not lead to a significant difference <strong>in</strong> <strong>the</strong> estimated<br />
changes <strong>in</strong> education quality.<br />
3.2 Hedonic regression<br />
Canadian data from <strong>the</strong> 2003 IALSS are used to estimate <strong>the</strong> hedonic function for education<br />
output that relates test scores to <strong>in</strong>crements <strong>in</strong> lifetime <strong>in</strong>comes. Ideally, it would be prefereable<br />
to construct <strong>in</strong>crements <strong>in</strong> lifetime <strong>in</strong>comes for all <strong>in</strong>dividuals <strong>in</strong> <strong>the</strong> sample and to estimate a<br />
hedonic function that relates test scores to ga<strong>in</strong>s <strong>in</strong> lifetime <strong>in</strong>come. In this paper, marg<strong>in</strong>al ga<strong>in</strong>s<br />
<strong>in</strong> current labour <strong>in</strong>come from education (or returns to education) are used as a proxy for ga<strong>in</strong>s<br />
<strong>in</strong> lifetime labour <strong>in</strong>comes.<br />
The hedonic regression for <strong>the</strong> output <strong>of</strong> education services is estimated as a standard M<strong>in</strong>certype<br />
human capital earn<strong>in</strong>gs function:<br />
2 3<br />
<br />
score A score A<br />
ln( earn<strong>in</strong>gs) ln( score ) A2 ln( score ) A3<br />
it <br />
it it it it<br />
ln( ) 4 ln( ) 5<br />
4 it it 5 it 5 it<br />
+ Z .<br />
it<br />
it<br />
The earn<strong>in</strong>gs are annual earn<strong>in</strong>gs. The dummy variables A2 to A5 are <strong>the</strong> dummy variables that<br />
represent <strong>the</strong> levels <strong>of</strong> education achieved. It is assumed that <strong>the</strong> <strong>in</strong>dividuals who achieved a<br />
higher education level also received <strong>the</strong> lower level. For an <strong>in</strong>dividual whose highest level <strong>of</strong><br />
<strong>Economic</strong> Analysis Research Paper Series - 34 - Statistics Canada – Catalogue no.11F0027M, no. 080<br />
(10)