Annual Report for the year 2012
Annual Report for the year 2012
Annual Report for the year 2012

You also want an ePaper? Increase the reach of your titles
YUMPU automatically turns print PDFs into web optimized ePapers that Google loves.
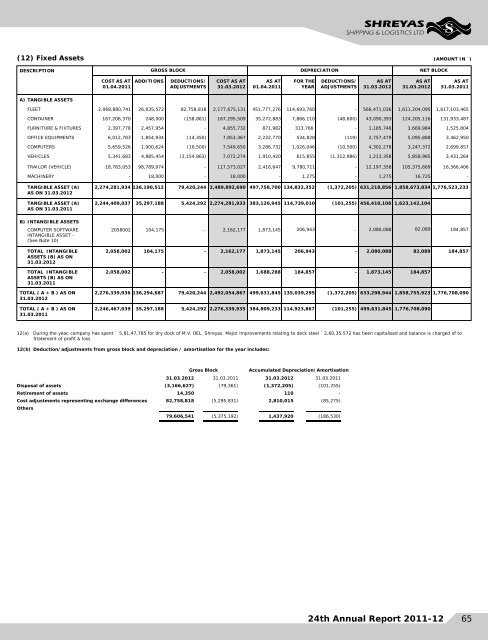
(12) Fixed Assets<br />
0<br />
(AMOUNT IN `)<br />
DESCRIPTION<br />
GROSS BLOCK<br />
DEPRECIATION<br />
NET BLOCK<br />
COST AS AT<br />
01.04.2011<br />
ADDITIONS<br />
DEDUCTIONS/<br />
ADJUSTMENTS<br />
COST AS AT<br />
31.03.<strong>2012</strong><br />
AS AT<br />
01.04.2011<br />
FOR THE<br />
YEAR<br />
DEDUCTIONS/<br />
ADJUSTMENTS<br />
AS AT<br />
31.03.<strong>2012</strong><br />
AS AT<br />
31.03.<strong>2012</strong><br />
AS AT<br />
31.03.2011<br />
A) TANGIBLE ASSETS<br />
FLEET 2,068,880,741 26,035,572 82,758,818 2,177,675,131 451,777,276 114,693,760 - 566,471,036 1,611,204,095 1,617,103,465<br />
CONTAINER 167,206,370 248,000 (158,861) 167,295,509 35,272,883 7,866,110 (48,600) 43,090,393 124,205,116 131,933,487<br />
FURNITURE & FIXTURES 2,397,778 2,457,954 - 4,855,732 871,982 313,766 -<br />
OFFICE EQUIPMENTS 6,012,783 1,854,934 (14,350) 7,853,367 2,222,770 534,828 (119)<br />
COMPUTERS 5,659,526 1,900,624 (10,500) 7,549,650 3,286,732 1,026,046 (10,500)<br />
VEHICLES 5,341,683 4,885,454 (3,154,863) 7,072,274 1,910,420 615,855 (1,312,986)<br />
TRAILOR (VEHICLE) 18,783,053 98,789,974 - 117,573,027 2,416,647 9,780,711 -<br />
MACHINERY - 18,000 - 18,000 - 1,275 -<br />
1,185,748 3,669,984 1,525,804<br />
2,757,479 5,095,888 3,462,950<br />
4,302,278 3,247,372 2,699,857<br />
1,213,358 5,858,985 3,431,264<br />
12,197,358 105,375,669 16,366,406<br />
1,275 16,725 -<br />
TANGIBLE ASSET (A)<br />
AS ON 31.03.<strong>2012</strong><br />
TANGIBLE ASSET (A)<br />
AS ON 31.03.2011<br />
2,274,281,934 136,190,512 79,420,244 2,489,892,690 497,758,700 134,832,352 (1,372,205) 631,218,856 1,858,673,834 1,776,523,233<br />
2,244,409,037 35,297,188 5,424,292 2,274,281,933 383,120,945 114,739,010 (101,255) 456,410,106 1,623,142,104<br />
B) INTANGIBLE ASSETS<br />
COMPUTER SOFTWARE<br />
INTANGIBLE ASSET -<br />
(See Note 10)<br />
TOTAL INTANGIBLE<br />
ASSETS (B) AS ON<br />
31.03.<strong>2012</strong><br />
TOTAL INTANGIBLE<br />
ASSETS (B) AS ON<br />
31.03.2011<br />
2058002 104,175 - 2,162,177 1,873,145 206,943 -<br />
2,058,002 104,175 - 2,162,177 1,873,145 206,943 -<br />
2,058,002 - - 2,058,002 1,688,288 184,857 -<br />
2,080,088 82,089 184,857<br />
2,080,088 82,089 184,857<br />
1,873,145 184,857<br />
TOTAL ( A + B ) AS ON<br />
31.03.<strong>2012</strong><br />
TOTAL ( A + B ) AS ON<br />
31.03.2011<br />
2,276,339,936 136,294,687 79,420,244 2,492,054,867 499,631,845 135,039,295 (1,372,205) 633,298,944 1,858,755,923 1,776,708,090<br />
2,246,467,039 35,297,188 5,424,292 2,276,339,935 384,809,233 114,923,867 (101,255) 499,631,845 1,776,708,090<br />
12(a) During <strong>the</strong> <strong>year</strong>, company has spent ` 5,81,47,785 <strong>for</strong> dry dock of M.V. OEL. Shreyas. Major improvements relating to deck steel ` 2,60,35,572 has been capitalised and balance is charged of to<br />
Statement of profit & loss<br />
12(b) Deduction/adjustments from gross block and depreciation / amortisation <strong>for</strong> <strong>the</strong> <strong>year</strong> includes:<br />
Gross Block<br />
31.03.<strong>2012</strong> 31.03.2011<br />
Disposal of assets (3,166,627) (79,361)<br />
Retirement of assets 14,350 -<br />
Cost adjustments representing exchange differences 82,758,818 (5,295,831)<br />
O<strong>the</strong>rs<br />
79,606,541 (5,375,192)<br />
Accumulated Depreciation/Amortisation<br />
31.03.<strong>2012</strong> 31.03.2011<br />
(1,372,205) (101,255)<br />
110 -<br />
2,810,015 (85,275)<br />
1,437,920 (186,530)<br />
24th <strong>Annual</strong> <strong>Report</strong> 2011-12<br />
65