Prof. Dr. W. Zucchini 1. ¨Ubungsblatt TIME SERIES ANALYSIS ...
Prof. Dr. W. Zucchini 1. ¨Ubungsblatt TIME SERIES ANALYSIS ...
Prof. Dr. W. Zucchini 1. ¨Ubungsblatt TIME SERIES ANALYSIS ...

Create successful ePaper yourself
Turn your PDF publications into a flip-book with our unique Google optimized e-Paper software.
<strong>Prof</strong>. <strong>Dr</strong>. W. <strong>Zucchini</strong><br />
<strong>1.</strong> Übungsblatt<br />
<strong>TIME</strong> <strong>SERIES</strong> <strong>ANALYSIS</strong> Wintersemester 2010/2011<br />
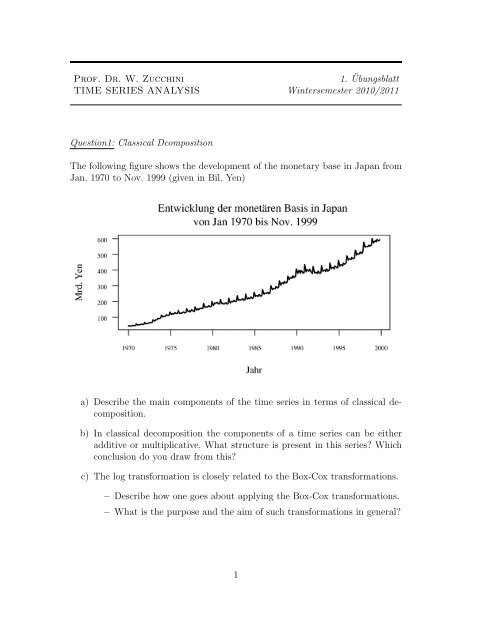
Question1: Classical Dcomposition<br />
The following figure shows the development of the monetary base in Japan from<br />
Jan. 1970 to Nov. 1999 (given in Bil. Yen)<br />
a) Describe the main components of the time series in terms of classical decomposition.<br />
b) In classical decomposition the components of a time series can be either<br />
additive or multiplicative. What structure is present in this series? Which<br />
conclusion do you draw from this?<br />
c) The log transformation is closely related to the Box-Cox transformations.<br />
– Describe how one goes about applying the Box-Cox transformations.<br />
– What is the purpose and the aim of such transformations in general?<br />
1
Question 2: Filters<br />
a) Explain the terms simple moving average, weighted moving average and<br />
centered filter.<br />
b) A simple moving average is given by<br />
D t =<br />
a∑<br />
i=−a<br />
Describe how a influences the filtering?<br />
1<br />
2a + 1 x t+i<br />
c) Explain the terms linearity, additivity und commutativity in the context of<br />
filters.<br />
Aufgabe 3: R<br />
a) Read the dataset tui (Shares and trading volume of the TUI AG from<br />
01/03/2000 to 05/14/2002) using read.table() with the option header=T.<br />
The data is given as a matrix: The first column ("open") contains the<br />
opening values, the second and third columns give the daily highs and lows,<br />
respectively ("high" "low"). The fourth column contains the closing values<br />
("close"). The trading volume ("volume") is given in the fifth column.<br />
– Consider the closing values (tui[,4]). Plot the values and filter the<br />
given time series using simple moving averages with (a = 2, 12 and<br />
37). Add the filtered values to the figure using the lines() command.<br />
b) The dataset yen from question 1 is stored as yen.dat . Read the data with<br />
scan() and plot the time series.<br />
– Transform the data if necessary and choose an appropriate filter in<br />
order to obtain the trend T t . Create a plot of the estimated trend and<br />
of the component (S t + e t )!<br />
2