Econometrics 2 Pr. Dr. S. Sperlich Assignment 4: Tobit Models ...
Econometrics 2 Pr. Dr. S. Sperlich Assignment 4: Tobit Models ...
Econometrics 2 Pr. Dr. S. Sperlich Assignment 4: Tobit Models ...

Create successful ePaper yourself
Turn your PDF publications into a flip-book with our unique Google optimized e-Paper software.
<strong>Econometrics</strong> 2<br />
<strong>Pr</strong>. <strong>Dr</strong>. S. <strong>Sperlich</strong><br />
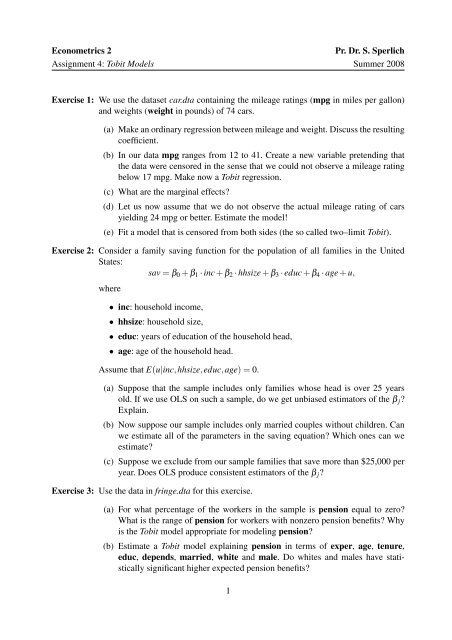
<strong>Assignment</strong> 4: <strong>Tobit</strong> <strong>Models</strong> Summer 2008<br />
Exercise 1: We use the dataset car.dta containing the mileage ratings (mpg in miles per gallon)<br />
and weights (weight in pounds) of 74 cars.<br />
(a) Make an ordinary regression between mileage and weight. Discuss the resulting<br />
coefficient.<br />
(b) In our data mpg ranges from 12 to 41. Create a new variable pretending that<br />
the data were censored in the sense that we could not observe a mileage rating<br />
below 17 mpg. Make now a <strong>Tobit</strong> regression.<br />
(c) What are the marginal effects?<br />
(d) Let us now assume that we do not observe the actual mileage rating of cars<br />
yielding 24 mpg or better. Estimate the model!<br />
(e) Fit a model that is censored from both sides (the so called two–limit <strong>Tobit</strong>).<br />
Exercise 2: Consider a family saving function for the population of all families in the United<br />
States:<br />
sav = β 0 + β 1 · inc + β 2 · hhsize + β 3 · educ + β 4 · age + u,<br />
where<br />
• inc: household income,<br />
• hhsize: household size,<br />
• educ: years of education of the household head,<br />
• age: age of the household head.<br />
Assume that E(u|inc,hhsize,educ,age) = 0.<br />
(a) Suppose that the sample includes only families whose head is over 25 years<br />
old. If we use OLS on such a sample, do we get unbiased estimators of the β j ?<br />
Explain.<br />
(b) Now suppose our sample includes only married couples without children. Can<br />
we estimate all of the parameters in the saving equation? Which ones can we<br />
estimate?<br />
(c) Suppose we exclude from our sample families that save more than $25,000 per<br />
year. Does OLS produce consistent estimators of the β j ?<br />
Exercise 3: Use the data in fringe.dta for this exercise.<br />
(a) For what percentage of the workers in the sample is pension equal to zero?<br />
What is the range of pension for workers with nonzero pension benefits? Why<br />
is the <strong>Tobit</strong> model appropriate for modeling pension?<br />
(b) Estimate a <strong>Tobit</strong> model explaining pension in terms of exper, age, tenure,<br />
educ, depends, married, white and male. Do whites and males have statistically<br />
significant higher expected pension benefits?<br />
1
<strong>Econometrics</strong> 2<br />
<strong>Pr</strong>. <strong>Dr</strong>. S. <strong>Sperlich</strong><br />
<strong>Assignment</strong> 4: <strong>Tobit</strong> <strong>Models</strong> Summer 2008<br />
(c) Use the results from (b) to estimate the difference in expected pension benefits<br />
for a white male and a nonwhite female, both of whom are 35 years old, single<br />
with no dependents, have 16 years of education and 10 years of experience.<br />
(d) Add union to the <strong>Tobit</strong> model and comment on its significance.<br />
(e) Apply the <strong>Tobit</strong> model from part (d) but with peratio, the pension-earnings<br />
ratio, as the dependent variable. (Notice that is a fraction between zero and one,<br />
but, while it often takes on the value zero, it never gets close to being unity.<br />
Thus, a <strong>Tobit</strong> model is fine as an approximation.) Does gender or race have an<br />
effect on the pension-earnings ratio?<br />
Exercise 4: Consider a double hurdle model of durable goods expenditure, where the purchase<br />
decision is represented by<br />
Y i1 = 1I Y ∗<br />
i1 >0<br />
but the actual amount purchased is represented by a censored regression model, thereby<br />
avoiding negativity of Y i2 . In this case<br />
Y i2 = Y i1 · max(0,Y ∗<br />
i2).<br />
One interpretation of this model is that observed demand Y i2 is zero either because<br />
an individual genuinely does not consume the good (that is, Yi1 ∗ ≤ 0), or because<br />
for some reason (infrequently of purchase, misreporting, etc.) zero expenditure was<br />
recorded (that is, Yi2 ∗ ≤ 0).<br />
(a) Determine P(Y i2 = 0) when Yi1 ∗ and Y i2 ∗ are independent.<br />
(b) Specify the sample log–likelihood.<br />
(c) What happens when P(Y i1 = 1) = 1 for all sample units?<br />
(d) Which other than the ML–estimator could we use for estimation?<br />
2