sustainable forest management - Forestry Tasmania
sustainable forest management - Forestry Tasmania
sustainable forest management - Forestry Tasmania

Create successful ePaper yourself
Turn your PDF publications into a flip-book with our unique Google optimized e-Paper software.
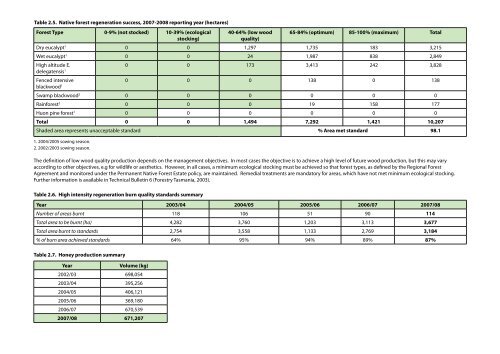
Table 2.5. Native <strong>forest</strong> regeneration success, 2007-2008 reporting year (hectares)<br />
Forest Type 0-9% (not stocked) 10-39% (ecological<br />
stocking)<br />
40-64% (low wood<br />
quality)<br />
65-84% (optimum) 85-100% (maximum) Total<br />
Dry eucalypt 1 0 0 1,297 1,735 183 3,215<br />
Wet eucalypt 1 0 0 24 1,987 838 2,849<br />
High altitude E.<br />
0 0 173 3,413 242 3,828<br />
delegatensis 1<br />
Fenced intensive<br />
0 0 0 138 0 138<br />
blackwood 1<br />
Swamp blackwood 2 0 0 0 0 0 0<br />
Rain<strong>forest</strong> 2 0 0 0 19 158 177<br />
Huon pine <strong>forest</strong> 1 0 0 0 0 0 0<br />
Total 0 0 1,494 7,292 1,421 10,207<br />
Shaded area represents unacceptable standard % Area met standard 98.1<br />
1. 2004/2005 sowing season.<br />
2. 2002/2003 sowing season.<br />
The definition of low wood quality production depends on the <strong>management</strong> objectives. In most cases the objective is to achieve a high level of future wood production, but this may vary<br />
according to other objectives, e.g for wildlife or aesthetics. However, in all cases, a minimum ecological stocking must be achieved so that <strong>forest</strong> types, as defined by the Regional Forest<br />
Agreement and monitored under the Permanent Native Forest Estate policy, are maintained. Remedial treatments are mandatory for areas, which have not met minimum ecological stocking.<br />
Further information is available in Technical Bulletin 6 (<strong>Forestry</strong> <strong>Tasmania</strong>, 2003).<br />
Table 2.6. High intensity regeneration burn quality standards summary<br />
Year 2003/04 2004/05 2005/06 2006/07 2007/08<br />
Number of areas burnt 118 106 51 90 114<br />
Total area to be burnt (ha) 4,282 3,760 1,203 3,113 3,677<br />
Total area burnt to standards 2,754 3,558 1,133 2,769 3,184<br />
% of burn area achieved standards 64% 95% 94% 89% 87%<br />
Table 2.7. Honey production summary<br />
Year<br />
Volume (kg)<br />
2002/03 698,054<br />
2003/04 395,256<br />
2004/05 406,121<br />
2005/06 369,180<br />
2006/07 670,539<br />
2007/08 671,207