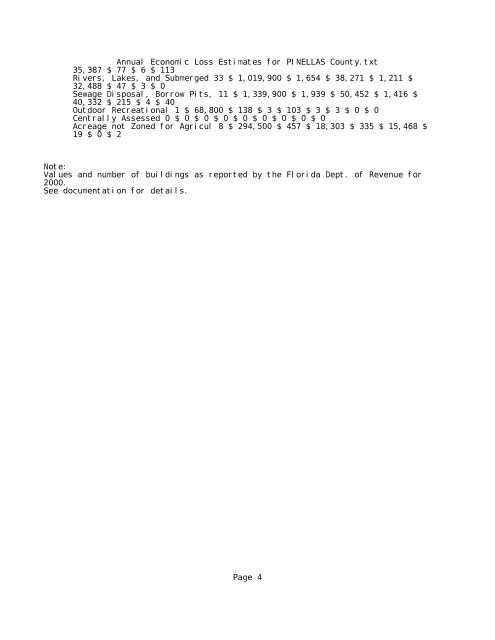
Annual Economic Loss Estimates for PINELLAS County.txt 35,387 $ 77 $ 6 $ 113 Rivers, Lakes, and Submerged 33 $ 1,019,900 $ 1,654 $ 38,271 $ 1,211 $ 32,488 $ 47 $ 3 $ 0 Sewage Disposal, Borrow Pits, 11 $ 1,339,900 $ 1,939 $ 50,452 $ 1,416 $ 40,332 $ 215 $ 4 $ 40 Outdoor Recreational 1 $ 68,800 $ 138 $ 3 $ 103 $ 3 $ 3 $ 0 $ 0 Centrally Assessed 0 $ 0 $ 0 $ 0 $ 0 $ 0 $ 0 $ 0 $ 0 Acreage not Zoned for Agricul 8 $ 294,500 $ 457 $ 18,303 $ 335 $ 15,468 $ 19 $ 0 $ 2 Note: Values and number of buildings as reported by the Florida Dept. of Revenue for 2000. See documentation for details. Page 4
Event Based Loss Estimates (Wind) for PINELLAS County.txt Event Based Loss Estimates (Wind) for PINELLAS CountyEvent Based Loss Estimates (Wind) for PINELLAS County Total Structures Total Exposure Cat 1 Cat 2 Cat 3 Cat 4 Cat 5 Cat 1 Mit Cat 2 Mit Cat 3 Mit Cat 4 Mit Cat 5 Mit Total: 373,646 $ 28,526,643,200 $ 1,491,899,136 $ 4,229,541,376 $ 9,459,751,936 $ 19,566,073,856 $ 28,400,158,720 $ 1,026,977,280 $ 3,263,412,224 $ 7,772,764,672 $ 16,816,545,792 $ 27,638,278,144 Value of structures in each zone by DOR Use Code DOR CodeTotal Structures Total Exposure Cat 1 Cat 2 Cat 3 Cat 4 Cat 5 Cat 1 Mit Cat 2 Mit Cat 3 Mit Cat 4 Mit Cat 5 Mit Vacant Residential 8,966 $ 640,172,032 $ 37,888,164 $ 104,304,736 $ 230,356,768 $ 481,256,320 $ 639,599,104 $ 26,498,546 $ 81,164,120 $ 190,355,744 $ 414,970,912 $ 632,933,184 Single Family 235,918 $ 13,567,053,824 $ 692,028,288 $ 1,967,360,128 $ 4,428,114,944 $ 9,221,175,296 $ 13,486,886,912 $ 475,212,288 $ 1,515,873,664 $ 3,636,444,928 $ 7,911,776,256 $ 13,142,378,496 Mobile Homes 14,739 $ 169,640,592 $ 25,685,964 $ 65,165,700 $ 137,187,648 $ 169,640,592 $ 169,640,592 $ 18,475,718 $ 51,350,388 $ 114,106,216 $ 169,640,592 $ 169,640,592 Multi-family 780 $ 1,087,981,568 $ 50,824,944 $ 147,181,632 $ 331,094,816 $ 695,806,144 $ 1,080,246,272 $ 34,478,700 $ 112,668,160 $ 270,568,192 $ 594,997,696 $ 1,029,604,672 Condominia 80,587 $ 5,259,876,352 $ 291,781,792 $ 815,936,192 $ 1,818,154,880 $ 3,764,014,848 $ 5,241,884,672 $ 202,520,928 $ 632,369,024 $ 1,498,601,088 $ 3,237,943,808 $ 5,128,927,232 Cooperatives 1,492 $ 42,022,400 $ 2,305,581 $ 6,822,517 $ 14,581,000 $ 31,069,896 $ 42,020,132 $ 1,596,520 $ 5,306,556 $ 12,019,161 $ 26,766,594 $ 41,650,248 Retirement Homes 0 $ 0 $ 0 $ 0 $ 0 $ 0 $ 0 $ 0 $ 0 $ 0 $ 0 $ 0 Boarding Homes (Institutional 263 $ 9,278,700 $ 458,837 $ 1,321,668 $ 2,978,505 $ 6,305,775 $ 9,250,371 $ 313,592 $ 1,016,261 $ 2,442,651 $ 5,409,112 $ 8,989,823 Multi-family less than 10 un 13,610 $ 676,236,800 $ 35,867,296 $ 101,410,032 $ 224,854,032 $ 469,276,064 $ 675,620,928 $ 24,739,466 $ 78,343,608 $ 184,853,360 $ 403,001,984 $ 662,139,136 Undefined reserved for DOR 0 $ 0 $ 0 $ 0 $ 0 $ 0 $ 0 $ 0 $ 0 $ 0 $ 0 $ 0 Vacant Commercial 670 $ 8,191,700 $ 416,580 $ 1,215,181 $ 2,636,401 $ 5,526,258 $ 8,171,860 $ 285,730 $ 937,811 $ 2,162,514 $ 4,738,960 $ 7,819,540 Stores One-Story 2,674 $ 792,143,872 $ 40,210,768 $ 114,954,712 $ 257,452,768 $ 535,596,864 $ 789,965,120 $ 27,581,348 $ 88,557,808 $ 211,330,592 $ 459,349,728 $ 765,456,576 Mixed Use, i.e., Store and Of 348 $ 32,158,400 $ 1,725,100 $ 4,915,262 $ 10,861,578 $ 22,600,308 $ 32,142,010 $ 1,191,743 $ 3,803,756 $ 8,938,560 $ 19,421,574 $ 31,533,334 Department Stores 2 $ 3,581,200 $ 204,527 $ 545,838 $ 1,258,264 $ 2,661,196 $ 3,581,200 $ 142,334 $ 422,155 $ 1,037,927 $ 2,293,240 $ 3,581,200 Supermarket 0 $ 0 $ 0 $ 0 $ 0 $ 0 $ 0 $ 0 $ 0 $ 0 $ 0 $ 0 <strong>Regional</strong> Shopping Malls 23 $ 214,246,784 $ 10,874,472 $ 31,380,118 $ 67,985,672 $ 147,562,768 $ 213,491,584 $ 7,460,812 $ 24,187,688 $ 55,713,140 $ 126,693,384 $ 205,788,224 Community Shopping Centers 44 $ 100,418,792 $ 4,862,003 $ 14,067,315 $ 31,708,788 $ 65,395,152 $ 99,558,328 $ 3,314,764 $ 10,801,452 $ 25,975,574 $ 55,973,920 $ 94,862,936 One-Story Non-Professional Of 1,499 $ 294,896,064 $ 14,779,420 $ 41,654,772 $ 94,075,528 $ 195,471,744 $ 294,140,992 $ 10,120,810 $ 32,010,824 $ 77,123,096 $ 167,471,392 $ 283,759,552 Multi-Story Non-Professional 237 $ 494,529,536 $ 21,590,860 $ 65,043,352 $ 144,032,192 $ 297,339,072 $ 491,317,312 $ 14,500,858 $ 49,649,612 $ 117,317,440 $ 253,398,736 $ 454,047,264 Professional Service Building 852 $ 191,183,664 $ 9,809,802 $ 28,519,520 $ Page 1
- Page 1 and 2:
PINELLAS COUNTY LOCAL MITIGATION ST
- Page 3 and 4:
ACKNOWLEDGEMENTS The development of
- Page 5 and 6:
Glossary Base Flood Elevation (BFE)
- Page 7 and 8:
waste disposal sites or retention a
- Page 9 and 10:
References Pinellas County Comprehe
- Page 11 and 12:
RECORD OF DOCUMENT REVISIONS Revisi
- Page 13 and 14:
PINELLAS COUNTY LOCAL MITIGATION ST
- Page 15 and 16:
PINELLAS COUNTY LOCAL MITIGATION ST
- Page 17 and 18:
PINELLAS COUNTY LOCAL MITIGATION ST
- Page 19 and 20:
PINELLAS COUNTY LOCAL MITIGATION ST
- Page 21 and 22:
PINELLAS COUNTY LOCAL MITIGATION ST
- Page 23 and 24:
Seminole is 980 acres in surface ar
- Page 25 and 26:
Railroad CSX operates a single line
- Page 27 and 28:
Urban Wildfire High Minor Several a
- Page 29 and 30:
Major H M H M H M H H H H H M M H H
- Page 31 and 32:
Maximum Threat: A prolonged drought
- Page 33 and 34:
June 1974: During the period of Jun
- Page 35 and 36:
hours of the 17th. Hurricane Gordon
- Page 37 and 38:
Tornado History: The tornado, poten
- Page 39 and 40:
Sinkholes History: Sinkholes, a com
- Page 41 and 42:
speed, atmospheric stability class
- Page 43 and 44:
Hazard Modeling Using TAOS The Flor
- Page 45 and 46:
6. Earthquake Risk The USGS 50 year
- Page 47 and 48:
Identified on FEMA FIRM Flood Zone
- Page 49 and 50:
Vulnerable Population Using the Cou
- Page 51 and 52:
Category/Damage Population in TAOS
- Page 53 and 54:
For more detailed analysis and maps
- Page 55 and 56:
Native American tribes or organizat
- Page 57 and 58:
Appendix 3 Mitigation Strategy Conf
- Page 59 and 60:
e. Objective: Provide an ongoing mi
- Page 61 and 62:
Appendix 5 Policies and Ordinances
- Page 63 and 64:
COASTAL MANAGEMENT 1.1 Pinellas Cou
- Page 65 and 66:
1.1.12. Pinellas County shall re-vi
- Page 67 and 68:
1.4.2. When public infrastructure w
- Page 69 and 70:
Evaluation e. the expenditure is fo
- Page 71 and 72:
Evaluation which enables proper enf
- Page 73 and 74:
Chapter 47, article I. Sec. 47.005
- Page 75 and 76:
Evaluation CCM, IV-A-5 Evaluation C
- Page 77 and 78:
Evaluation (1)Preservation of the f
- Page 79 and 80:
-Continue providing information for
- Page 81 and 82:
Indian Rocks Beach Comprehensive Pl
- Page 83 and 84:
CME 1.9 Evaluation CME 2.3 Evaluati
- Page 85 and 86:
Evaluation CME 2.3.2 Evaluation CME
- Page 87 and 88:
Resolution 11-91 Evaluation: Resolu
- Page 89 and 90:
LARGO FUTURE LAND USE ELEMENT POLIC
- Page 91 and 92:
1.5.2: Coordinate with Southwest Fl
- Page 93 and 94:
Evaluation: Minimizes expenditure o
- Page 95 and 96:
1.6.4 Amnesty Days and other method
- Page 97 and 98:
Policy 101.601 Evaluation Policy 10
- Page 99 and 100:
Evaluation Policy 506.101 Evaluatio
- Page 101 and 102:
Article 1 Evaluation Adoption of Su
- Page 103 and 104:
POLICY D.1.7.5 Evaluation POLICY D.
- Page 105 and 106:
Evaluation POLICY D.1.8.10 Evaluati
- Page 107 and 108:
Redington Shores Comprehensive Plan
- Page 109 and 110:
1.8.5;1.8.6 Requires preservation o
- Page 111 and 112:
South Pasadena 502.308 To the maxim
- Page 113 and 114:
403.206 Post development peak rate
- Page 115 and 116:
EVALUATION Policy 2.1.5 EVALUATION
- Page 117 and 118:
- Provide for improved drainage and
- Page 119 and 120:
EVALUATION Policy 2.1.1 EVALUATION
- Page 121 and 122:
EVALUATION Policy 2.4.3 EVALUATION
- Page 123 and 124:
Policy 3.3.2 Evaluation Policy 3.3.
- Page 125 and 126:
IMPLEMENTING THE STORMWATER DRAINAG
- Page 127 and 128:
subsurface drainage pushed into the
- Page 129 and 130:
Evaluation CM6.11 Evaluation CM6.16
- Page 131 and 132:
Evaluation C6 Evaluation Reduces th
- Page 133 and 134:
Tarpon Springs 2-180 City Code Prov
- Page 135 and 136:
Evaluation Policy 33 Evaluation The
- Page 137 and 138:
• Land Development and Land Use P
- Page 139 and 140:
Loss Reduction Trash and Debris Cod
- Page 141 and 142:
Assists homeowners to bring propert
- Page 143 and 144:
Belleair Fire Dept. Loss Reduction
- Page 145 and 146:
Loss Reduction Loss Reduction Centr
- Page 147 and 148:
Dunedin Comm. Services Loss Reducti
- Page 149 and 150:
Indian Rocks Beach Public Srv. Loss
- Page 151 and 152:
Indian Shores Town Council Loss Red
- Page 153 and 154:
Largo Public Works Facilities Mgmt
- Page 155 and 156:
North Redington Beach Emergency Mgt
- Page 157 and 158:
Pinellas Park Community Development
- Page 159 and 160:
Loss Reduction Mgt Info Srv Loss Re
- Page 161 and 162:
Redington Beach Planning Board/Plan
- Page 163 and 164:
Police Chief Loss Reduction Seminol
- Page 165 and 166:
Seminole City Established first Eme
- Page 167 and 168:
St. Pete Beach Legislative: Loss Re
- Page 169 and 170:
emergency management (Mitigation, P
- Page 171 and 172:
Building Official Responsible for s
- Page 173 and 174:
Loss Reduction Implementation and u
- Page 175 and 176:
Fire/EMS & Police Loss Reduction Po
- Page 177 and 178:
Loss Reduction Planning/ Zoning Los
- Page 179 and 180:
Paul Sierra Construction Pinellas P
- Page 181 and 182:
asic plan and a public forum feedba
- Page 183 and 184:
Coincidental Benefits - Tie Breaker
- Page 185 and 186:
"' ( / 0) * 6 !( + ! ,0& +'
- Page 187 and 188:
"' ( A *$9'/@ ,82& ) %' * +!@9
- Page 189 and 190:
"' ( 1* 5! &*& ! !M%' ,8& 94 9
- Page 191 and 192:
"' ( 8"" &3& )A *4! + ,12& )'
- Page 193 and 194:
"' ( " %' && #$%) )' ,80&0J2
- Page 195 and 196:
"' ( H 46 C CC ,-&0& 'H 46
- Page 197 and 198:
Implement Town-wide storm water mas
- Page 199 and 200:
60th St. N. ditch mitigation projec
- Page 201 and 202:
Appendix 11 Potential Funding Sourc
- Page 203 and 204:
Emergency Management Program Assist
- Page 205 and 206:
16825 S. Seton Ave. Emmitsburg, MD
- Page 207 and 208:
Economic Development Administration
- Page 209 and 210:
Consolidated Farm Service Agency De
- Page 228:
© Pasco County Pinellas County
- Page 241 and 242: 1. Hurricanes/Winter Storms Histori
- Page 243 and 244: Note that the earthquake risk, even
- Page 245 and 246: Category Population in TAOS Flood Z
- Page 247 and 248: Population identified by TAOS on FE
- Page 249 and 250: TAOS Economic/Structural Impacts TA
- Page 251 and 252: Identified by TAOS as Subject to Mi
- Page 253 and 254: 10-Year Wind
- Page 255 and 256: 25-Year Wind
- Page 257 and 258: 50-Year Wind
- Page 259 and 260: 100-Year Wind
- Page 261 and 262: Category-1 Surge
- Page 263 and 264: Cagtegory-2 Surge
- Page 265 and 266: Category-3 Surge
- Page 267 and 268: Category-4 Surge
- Page 269 and 270: Category-5 Surge
- Page 272 and 273: Earthquake Potential
- Page 274 and 275: Hail Damage
- Page 276 and 277: Sinkhole Inventory
- Page 278 and 279: Thunderstorm Damage
- Page 280 and 281: Tornado Tracks
- Page 282 and 283: Wildfire Potential
- Page 284 and 285: Annual Economic Loss Estimates for
- Page 288 and 289: Event Based Loss Estimates (Wind) f
- Page 290 and 291: Event Based Loss Estimates (Wind) f
- Page 292 and 293: Event Based Loss Estimates (Water)
- Page 294 and 295: Event Based Loss Estimates (Water)
- Page 296: Event Based Loss Estimates (Water)