Sample Lab Report - Milwaukee Area Technical College
Sample Lab Report - Milwaukee Area Technical College
Sample Lab Report - Milwaukee Area Technical College

Create successful ePaper yourself
Turn your PDF publications into a flip-book with our unique Google optimized e-Paper software.
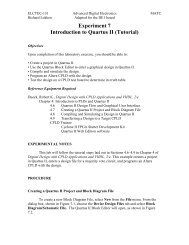
Experiment 15 Richard Lokken 8/21/2009<br />
<strong>Milwaukee</strong> <strong>Area</strong> <strong>Technical</strong> <strong>College</strong> ELCTEC-112<br />
BACKGROUND INFORMATION<br />
Use KVL to determine the fundamental properties of AC series circuits. Voltage and<br />
currents can be calculated for all components in the AC series circuit.<br />
THEORETICAL SOLUTION<br />
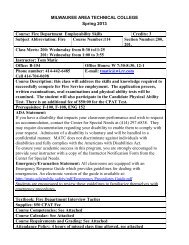
R 1<br />
1 k <br />
V S1<br />
1 V P-P<br />
R 2<br />
2.2 k <br />
R 3<br />
820 <br />
Circuit One<br />
Figure 15-1: Test circuit 1<br />
R T R 1 R 2 R 3<br />
R 1<br />
VR 1 V S <br />
R T<br />
VR 1 0.249V<br />
R 2<br />
VR 2 V S <br />
VR<br />
R 2 0.547V<br />
T<br />
R 3<br />
VR 3 V S <br />
R T<br />
VR 3 0.204V<br />
<br />
V S VR 1 VR 2 VR 3<br />
<br />
0V<br />
1
Experiment 15 Richard Lokken 8/21/2009<br />
<strong>Milwaukee</strong> <strong>Area</strong> <strong>Technical</strong> <strong>College</strong> ELCTEC-112<br />
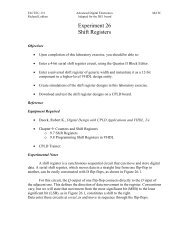
R 1<br />
1 k <br />
V S1<br />
2 V P-P<br />
R 2<br />
2.2 k <br />
C 1<br />
0.01 F<br />
Figure 15-2: Test circuit 2<br />
jXC i<br />
Circuit Two Z R i 1 R 2<br />
R 1<br />
R XC 2<br />
i<br />
VR1 V i S VR2 V<br />
Z i S <br />
VC1 V<br />
Z i S j<br />
Z i<br />
i<br />
i<br />
<br />
5.045 10 4 0.013i<br />
0.012 0.06i<br />
VR1 i<br />
0.043 0.108i<br />
0.083 0.138i<br />
<br />
<br />
0.998 0.04i<br />
0.961 0.193i<br />
VC1 i 0.861 0.346i<br />
0.733 0.442i<br />
<br />
<br />
<br />
V<br />
<br />
<br />
V<br />
VR1 VR2 i i<br />
<br />
1.11 10 3 0.028i<br />
0.027 0.133i<br />
VR2 i<br />
0.096 0.238i<br />
0.183 0.304i<br />
<br />
VC1 i <br />
V S <br />
<br />
<br />
0<br />
0<br />
0<br />
0<br />
<br />
<br />
V<br />
<br />
<br />
V<br />
2
Experiment 15 Richard Lokken 8/21/2009<br />
<strong>Milwaukee</strong> <strong>Area</strong> <strong>Technical</strong> <strong>College</strong> ELCTEC-112<br />
VR1 i<br />
0.013<br />
0.062<br />
0.117<br />
0.161<br />
V<br />
180<br />
arg VR1 i π<br />
87.697<br />
78.632<br />
68.094<br />
58.902<br />
<br />
VR2 i<br />
0.028<br />
0.136<br />
0.256<br />
0.355<br />
V<br />
180<br />
arg VR2 i π<br />
87.697<br />
78.632<br />
68.094<br />
58.902<br />
VC1 i<br />
0.999<br />
0.98<br />
V<br />
180<br />
arg VC1 i π<br />
-2.303<br />
-11.368<br />
<br />
0.928<br />
-21.906<br />
0.856<br />
-31.098<br />
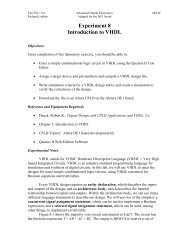
Simulations:<br />
U1<br />
+ -<br />
0.249 V<br />
AC 10M<br />
U2<br />
+ -<br />
0.547 V<br />
AC 10M<br />
3<br />
R1<br />
1 2<br />
1k<br />
R2<br />
2.2k<br />
V1<br />
1 V<br />
60 Hz<br />
0Deg<br />
R3<br />
820 <br />
0<br />
+<br />
-<br />
0.204 V<br />
U3<br />
AC 10M<br />
Figure 15.3: Simulation of test circuit one.<br />
3
Experiment 15 Richard Lokken 8/21/2009<br />
<strong>Milwaukee</strong> <strong>Area</strong> <strong>Technical</strong> <strong>College</strong> ELCTEC-112<br />
1<br />
R1<br />
1k<br />
2<br />
R2<br />
2.2k<br />
3<br />
V1<br />
1 V<br />
60 Hz<br />
0Deg<br />
0<br />
C1<br />
0.01uF<br />
Figure 15.4: Simulation of test circuit two.<br />
Procedure<br />
Figure 15.2 Simulation Results<br />
V R1 V R2 V C1<br />
Freq Mag Phase Mag Phase Mag Phase<br />
1000 0.0616 78.63 0.1355 78.63 0.9804 ‐11.37<br />
2000 0.1166 68.09 0.2565 68.09 0.9278 ‐21.91<br />
3000 0.1614 58.90 0.3551 58.90 0.8563 ‐31.10<br />
RESULTS<br />
Connect the circuit shown in Figure 15.1. Measure and record the voltage across R 1 , R 2 ,<br />
and R 3 . Next connect the circuit shown in Figure 15.2. Measure and record the voltage<br />
across all components.<br />
Data<br />
Figure 15-1<br />
Simulation Results<br />
Frequency V R3 V R2 V R1 Node 2 KVL Phase<br />
200 0.20398 0.547264 0.248756 0.751244 0 0<br />
1000 0.20398 0.547264 0.248756 0.751244 0 0<br />
2000 0.20398 0.547264 0.248756 0.751244 0 0<br />
3000 0.20398 0.547264 0.248756 0.751244 0 0<br />
Figure 15-2<br />
Theoretical Results<br />
Frequency V R3 V R2 VR1<br />
4
Experiment 15 Richard Lokken 8/21/2009<br />
<strong>Milwaukee</strong> <strong>Area</strong> <strong>Technical</strong> <strong>College</strong> ELCTEC-112<br />
200 0.204 0.547 0.249<br />
Figure 15-2<br />
Measured Results<br />
Frequency V C Phase V R2 Phase V R1 Phase<br />
2000 0.921934 -23.219 0.264667 66.325 0.118386 66.923<br />
3000 0.832818 -33.938 0.376791 55.595 0.169122 56.027<br />
Figure 15-2<br />
Theoretical Results<br />
Frequency V C Phase V R2 Phase V R1 Phase<br />
2000 0.928 -21.906 0.256 68.094 0.117 68.094<br />
3000 0.856 -31.098 0.355 58.902 0.161 58.902<br />
Figure 15.2 Simulation Results<br />
V R1 V R2 V C1<br />
Freq Mag Phase Mag Phase Mag Phase<br />
1000 0.0616 78.63 0.1355 78.63 0.9804 ‐11.37<br />
2000 0.1166 68.09 0.2565 68.09 0.9278 ‐21.91<br />
3000 0.1614 58.90 0.3551 58.90 0.8563 ‐31.10<br />
ANALYSIS OF RESULTS<br />
Since test circuit one was purely resistive, a DMM or oscilloscope could be used to<br />
measure the voltage drops across the resistors. KVL could be verified for each<br />
frequency.<br />
5
Experiment 15 Richard Lokken 8/21/2009<br />
<strong>Milwaukee</strong> <strong>Area</strong> <strong>Technical</strong> <strong>College</strong> ELCTEC-112<br />
<br />
5.045 10 4 0.013i<br />
0.012 0.06i<br />
VR1 i<br />
0.043 0.108i<br />
0.083 0.138i<br />
<br />
<br />
0.998 0.04i<br />
0.961 0.193i<br />
VC1 i 0.861 0.346i<br />
0.733 0.442i<br />
<br />
<br />
<br />
V<br />
<br />
<br />
V<br />
VR1 VR2 i i<br />
<br />
1.11 10 3 0.028i<br />
0.027 0.133i<br />
VR2 i<br />
0.096 0.238i<br />
0.183 0.304i<br />
<br />
VC1 i <br />
V S <br />
<br />
<br />
0<br />
0<br />
0<br />
0<br />
<br />
<br />
V<br />
<br />
<br />
V<br />
Since in test circuit two R 3 was replace with a capacitor. A capacitor is a reactive<br />
component. The impedance of the capacitor changes inversely with the frequency.<br />
Therefore a DMM can not be used to verify KVL. The DMM only provides magnitude<br />
information. An oscilloscope was needed to obtain the phasor voltage associated with the<br />
reactive circuit.<br />
There were no significant errors in measurement during this experiment.<br />
EXECUTIVE SUMMARY<br />
This experiment verified KVL for a series AC circuit. A purely resistive circuit and a<br />
reactive circuit were examined. It was found that a DMM or oscilloscope could be<br />
utilized to verify KVL for a purely resistive circuit. A DMM could not be utilized for<br />
verify KVL in a reactive circuit. A DMM only provides magnitude information. A<br />
reactive circuit is complex and both magnitude and phase data are required. An<br />
oscilloscope is needed to obtain the required data for the reactive circuit. The addition of<br />
the capacitor is reflected in the phase angle information obtain. Recall that the current in<br />
6
Experiment 15 Richard Lokken 8/21/2009<br />
<strong>Milwaukee</strong> <strong>Area</strong> <strong>Technical</strong> <strong>College</strong> ELCTEC-112<br />
a capacitor leads the voltage by 90 o . This is because the plates require time to charge to<br />
the full voltage. Once fully charge the capacitor resembles an open circuit. This stored<br />
voltage is then available for use in the circuit.<br />
7