

Malaria and children: Progress in intervention coverage - Unicef
Malaria and children: Progress in intervention coverage - Unicef
Malaria and children: Progress in intervention coverage - Unicef

Create successful ePaper yourself
Turn your PDF publications into a flip-book with our unique Google optimized e-Paper software.
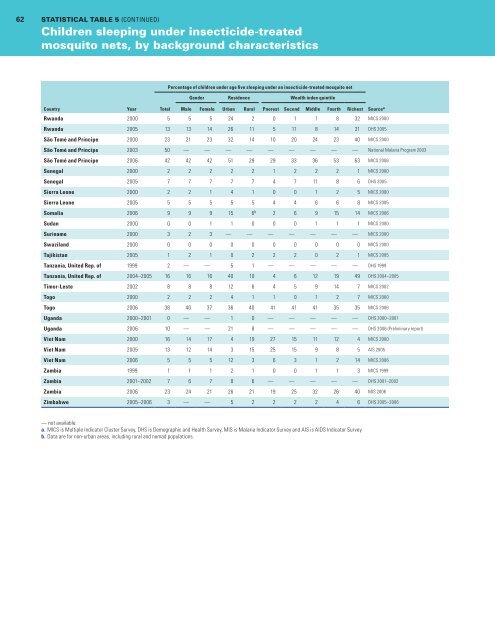
62 Statistical table 5 (cont<strong>in</strong>ued)<br />
Children sleep<strong>in</strong>g under <strong>in</strong>secticide-treated<br />
mosquito nets, by background characteristics<br />
Percentage of <strong>children</strong> under age five sleep<strong>in</strong>g under an <strong>in</strong>secticide-treated mosquito net<br />
Gender Residence Wealth <strong>in</strong>dex qu<strong>in</strong>tile<br />
Country<br />
Year<br />
Total Male Female Urban Rural Poorest Second Middle Fourth Richest Source a<br />
Rw<strong>and</strong>a 2000 5 5 5 24 2 0 1 1 8 32 MICS 2000<br />
Rw<strong>and</strong>a 2005 13 13 14 26 11 5 11 8 14 31 DHS 2005<br />
São Tomé <strong>and</strong> Pr<strong>in</strong>cipe 2000 23 21 23 32 14 10 20 24 23 40 MICS 2000<br />
São Tomé <strong>and</strong> Pr<strong>in</strong>cipe 2003 50 — — — — — — — — — National <strong>Malaria</strong> Program 2003<br />
São Tomé <strong>and</strong> Pr<strong>in</strong>cipe 2006 42 42 42 51 29 29 33 36 53 63 MICS 2006<br />
Senegal 2000 2 2 2 2 2 1 2 2 2 1 MICS 2000<br />
Senegal 2005 7 7 7 7 7 4 7 11 8 6 DHS 2005<br />
Sierra Leone 2000 2 2 1 4 1 0 0 1 2 5 MICS 2000<br />
Sierra Leone 2005 5 5 5 5 5 4 4 6 6 8 MICS 2005<br />
Somalia 2006 9 9 9 15 6 b 2 6 9 15 14 MICS 2006<br />
Sudan 2000 0 0 1 1 0 0 0 1 1 1 MICS 2000<br />
Sur<strong>in</strong>ame 2000 3 2 3 — — — — — — — MICS 2000<br />
Swazil<strong>and</strong> 2000 0 0 0 0 0 0 0 0 0 0 MICS 2000<br />
Tajikistan 2005 1 2 1 0 2 2 2 0 2 1 MICS 2005<br />
Tanzania, United Rep. of 1999 2 — — 5 1 — — — — — DHS 1999<br />
Tanzania, United Rep. of 2004–2005 16 16 16 40 10 4 6 12 19 49 DHS 2004–2005<br />
Timor-Leste 2002 8 8 8 12 6 4 5 9 14 7 MICS 2002<br />
Togo 2000 2 2 2 4 1 1 0 1 2 7 MICS 2000<br />
Togo 2006 38 40 37 36 40 41 41 41 35 35 MICS 2006<br />
Ug<strong>and</strong>a 2000–2001 0 — — 1 0 — — — — — DHS 2000–2001<br />
Ug<strong>and</strong>a 2006 10 — — 21 8 — — — — — DHS 2006 (Prelim<strong>in</strong>ary report)<br />
Viet Nam 2000 16 14 17 4 19 27 15 11 12 4 MICS 2000<br />
Viet Nam 2005 13 12 14 3 15 25 15 9 8 5 AIS 2005<br />
Viet Nam 2006 5 5 5 12 3 6 3 1 2 14 MICS 2006<br />
Zambia 1999 1 1 1 2 1 0 0 1 1 3 MICS 1999<br />
Zambia 2001–2002 7 6 7 8 6 — — — — — DHS 2001–2002<br />
Zambia 2006 23 24 21 26 21 19 25 32 26 40 MIS 2006<br />
Zimbabwe 2005–2006 3 — — 5 2 2 2 2 4 6 DHS 2005–2006<br />
— not available.<br />
a. MICS is Multiple Indicator Cluster Survey, DHS is Demographic <strong>and</strong> Health Survey, MIS is <strong>Malaria</strong> Indicator Survey <strong>and</strong> AIS is AIDS Indicator Survey<br />
b. Data are for non-urban areas, <strong>in</strong>clud<strong>in</strong>g rural <strong>and</strong> nomad populations.


