2011 Annual Report - the Seashore Trolley Museum
2011 Annual Report - the Seashore Trolley Museum
2011 Annual Report - the Seashore Trolley Museum

Create successful ePaper yourself
Turn your PDF publications into a flip-book with our unique Google optimized e-Paper software.
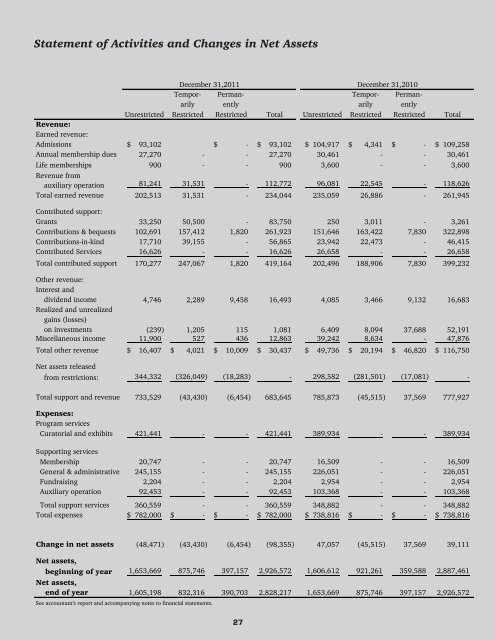
Statement of Activities and Changes in Net Assets<br />
<strong>2011</strong> <strong>Annual</strong> <strong>Report</strong><br />
December 31,<strong>2011</strong> December 31,2010<br />
Tempor- Perman- Tempor- Permanarily<br />
ently arily ently<br />
Unrestricted Restricted Restricted Total Unrestricted Restricted Restricted Total<br />
Revenue:<br />
Earned revenue:<br />
Admissions $ 93,102<br />
$ - $ 93,102 $ 104,917 $ 4,341 $ - $ 109,258<br />
<strong>Annual</strong> membership dues 27,270 - - 27,270 30,461 - - 30,461<br />
Life memberships 900 - - 900 3,600 - - 3,600<br />
Revenue from<br />
auxiliary operation 81,241 31,531 - 112,772 96,081 22,545 - 118,626<br />
Total earned revenue 202,513 31,531 - 234,044 235,059 26,886 - 261,945<br />
Contributed support:<br />
Grants 33,250 50,500 - 83,750 250 3,011 - 3,261<br />
Contributions & bequests 102,691 157,412 1,820 261,923 151,646 163,422 7,830 322,898<br />
Contributions-in-kind 17,710 39,155 - 56,865 23,942 22,473 - 46,415<br />
Contributed Services 16,626 - - 16,626 26,658 - - 26,658<br />
Total contributed support 170,277 247,067 1,820 419,164 202,496 188,906 7,830 399,232<br />
O<strong>the</strong>r revenue:<br />
Interest and<br />
dividend income 4,746 2,289 9,458 16,493 4,085 3,466 9,132 16,683<br />
Realized and unrealized<br />
gains (losses)<br />
on investments (239) 1,205 115 1,081 6,409 8,094 37,688 52,191<br />
Miscellaneous income 11,900 527 436 12,863 39,242 8,634 - 47,876<br />
Total o<strong>the</strong>r revenue $ 16,407 $ 4,021 $ 10,009 $ 30,437 $ 49,736 $ 20,194 $ 46,820 $ 116,750<br />
Net assets released<br />
from restrictions: 344,332 (326,049) (18,283) - 298,582 (281,501) (17,081) -<br />
Total support and revenue 733,529 (43,430) (6,454) 683,645 785,873 (45,515) 37,569 777,927<br />
Expenses:<br />
Program services<br />
Curatorial and exhibits 421,441 - - 421,441 389,934 - - 389,934<br />
Supporting services<br />
Membership 20,747 - - 20,747 16,509 - - 16,509<br />
General & administrative 245,155 - - 245,155 226,051 - - 226,051<br />
Fundraising 2,204 - - 2,204 2,954 - - 2,954<br />
Auxiliary operation 92,453 - - 92,453 103,368 - - 103,368<br />
Total support services 360,559 - - 360,559 348,882 - - 348,882<br />
Total expenses $ 782,000 $ - $ - $ 782,000 $ 738,816 $ - $ - $ 738,816<br />
Change in net assets (48,471) (43,430) (6,454) (98,355) 47,057 (45,515) 37,569 39,111<br />
Net assets,<br />
beginning of year 1,653,669 875,746 397,157 2,926,572 1,606,612 921,261 359,588 2,887,461<br />
Net assets,<br />
end of year 1,605,198 832,316 390,703 2,828,217 1,653,669 875,746 397,157 2,926,572<br />
See accountant's report and accompanying notes to financial statements.<br />
27