2011 Annual Report - the Seashore Trolley Museum
2011 Annual Report - the Seashore Trolley Museum
2011 Annual Report - the Seashore Trolley Museum

Create successful ePaper yourself
Turn your PDF publications into a flip-book with our unique Google optimized e-Paper software.
New England Electric Railway Historical Society<br />
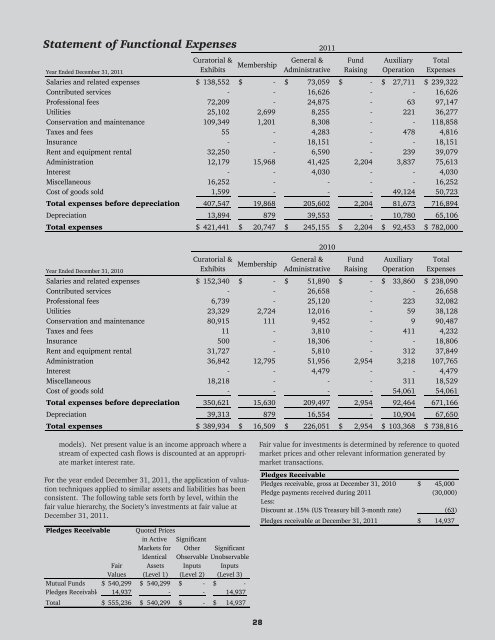
Statement of Functional Expenses<br />
Year Ended December 31, <strong>2011</strong><br />
Curatorial &<br />
Exhibits<br />
Membership<br />
General &<br />
Administrative<br />
Fund<br />
Raising<br />
Auxiliary<br />
Operation<br />
Total<br />
Expenses<br />
Salaries and related expenses $ 138,552 $ - $ 73,059 $ - $ 27,711 $ 239,322<br />
Contributed services - - 16,626 - - 16,626<br />
Professional fees 72,209 - 24,875 - 63 97,147<br />
Utilities 25,102 2,699 8,255 - 221 36,277<br />
Conservation and maintenance 109,349 1,201 8,308 - - 118,858<br />
Taxes and fees 55 - 4,283 - 478 4,816<br />
Insurance - - 18,151 - - 18,151<br />
Rent and equipment rental 32,250 - 6,590 - 239 39,079<br />
Administration 12,179 15,968 41,425 2,204 3,837 75,613<br />
Interest - - 4,030 - - 4,030<br />
Miscellaneous 16,252 - - - - 16,252<br />
Cost of goods sold 1,599 - - - 49,124 50,723<br />
Total expenses before depreciation 407,547 19,868 205,602 2,204 81,673 716,894<br />
Depreciation 13,894 879 39,553 - 10,780 65,106<br />
Total expenses $ 421,441 $ 20,747 $ 245,155 $ 2,204 $ 92,453 $ 782,000<br />
<strong>2011</strong><br />
Year Ended December 31, 2010<br />
Curatorial &<br />
Exhibits<br />
Membership<br />
General &<br />
Administrative<br />
Fund<br />
Raising<br />
Auxiliary<br />
Operation<br />
Total<br />
Expenses<br />
Salaries and related expenses $ 152,340 $ - $ 51,890 $ - $ 33,860 $ 238,090<br />
Contributed services - - 26,658 - - 26,658<br />
Professional fees 6,739 - 25,120 - 223 32,082<br />
Utilities 23,329 2,724 12,016 - 59 38,128<br />
Conservation and maintenance 80,915 111 9,452 - 9 90,487<br />
Taxes and fees 11 - 3,810 - 411 4,232<br />
Insurance 500 - 18,306 - - 18,806<br />
Rent and equipment rental 31,727 - 5,810 - 312 37,849<br />
Administration 36,842 12,795 51,956 2,954 3,218 107,765<br />
Interest - - 4,479 - - 4,479<br />
Miscellaneous 18,218 - - - 311 18,529<br />
Cost of goods sold - - - - 54,061 54,061<br />
Total expenses before depreciation 350,621 15,630 209,497 2,954 92,464 671,166<br />
Depreciation 39,313 879 16,554 - 10,904 67,650<br />
Total expenses $ 389,934 $ 16,509 $ 226,051 $ 2,954 $ 103,368 $ 738,816<br />
2010<br />
models). Net present value is an income approach where a<br />
stream of expected cash flows is discounted at an appropriate<br />
market interest rate.<br />
For <strong>the</strong> year ended December 31, <strong>2011</strong>, <strong>the</strong> application of valuation<br />
techniques applied to similar assets and liabilities has been<br />
consistent. The following table sets forth by level, within <strong>the</strong><br />
fair value hierarchy, <strong>the</strong> Society’s investments at fair value at<br />
December 31, <strong>2011</strong>.<br />
Pledges Receivable Quoted Prices<br />
in Active Significant<br />
Markets for O<strong>the</strong>r Significant<br />
Identical Observable Unobservable<br />
Fair Assets Inputs Inputs<br />
Values (Level 1) (Level 2) (Level 3)<br />
Mutual Funds $ 540,299 $ 540,299 $ - $ -<br />
Pledges Receivable 14,937 - - 14,937<br />
Total $ 555,236 $ 540,299 $ - $ 14,937<br />
Fair value for investments is determined by reference to quoted<br />
market prices and o<strong>the</strong>r relevant information generated by<br />
market transactions.<br />
Pledges Receivable<br />
Pledges receivable, gross at December 31, 2010 $ 45,000<br />
Pledge payments received during <strong>2011</strong> (30,000)<br />
Less:<br />
Discount at .15% (US Treasury bill 3-month rate) (63)<br />
Pledges receivable at December 31, <strong>2011</strong> $ 14,937<br />
28