Condensation in Buildings - Australian Building Codes Board
Condensation in Buildings - Australian Building Codes Board
Condensation in Buildings - Australian Building Codes Board

You also want an ePaper? Increase the reach of your titles
YUMPU automatically turns print PDFs into web optimized ePapers that Google loves.
Information Handbook: <strong>Condensation</strong> <strong>in</strong> Build<strong>in</strong>gs<br />
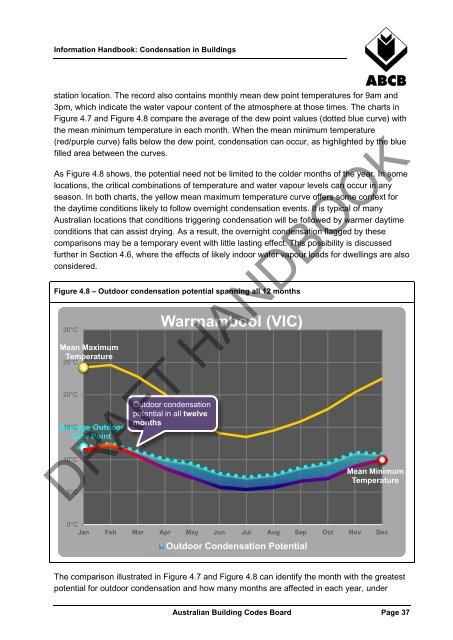
station location. The record also conta<strong>in</strong>s monthly mean dew po<strong>in</strong>t temperatures for 9am and<br />
3pm, which <strong>in</strong>dicate the water vapour content of the atmosphere at those times. The charts <strong>in</strong><br />
Figure 4.7 and Figure 4.8 compare the average of the dew po<strong>in</strong>t values (dotted blue curve) with<br />
the mean m<strong>in</strong>imum temperature <strong>in</strong> each month. When the mean m<strong>in</strong>imum temperature<br />
(red/purple curve) falls below the dew po<strong>in</strong>t, condensation can occur, as highlighted by the blue<br />
filled area between the curves.<br />
As Figure 4.8 shows, the potential need not be limited to the colder months of the year. In some<br />
locations, the critical comb<strong>in</strong>ations of temperature and water vapour levels can occur <strong>in</strong> any<br />
season. In both charts, the yellow mean maximum temperature curve offers some context for<br />
the daytime conditions likely to follow overnight condensation events. It is typical of many<br />
<strong>Australian</strong> locations that conditions trigger<strong>in</strong>g condensation will be followed by warmer daytime<br />
conditions that can assist dry<strong>in</strong>g. As a result, the overnight condensation flagged by these<br />
comparisons may be a temporary event with little last<strong>in</strong>g effect. This possibility is discussed<br />
further <strong>in</strong> Section 4.6, where the effects of likely <strong>in</strong>door water vapour loads for dwell<strong>in</strong>gs are also<br />
considered.<br />
Figure 4.8 – Outdoor condensation potential spann<strong>in</strong>g all 12 months<br />
30°C<br />
Mean Maximum<br />
Temperature<br />
25°C<br />
20°C<br />
Average 15°C Outdoor<br />
Dew Po<strong>in</strong>t<br />
10°C<br />
5°C<br />
Warrnambool (VIC)<br />
Outdoor condensation<br />
potential <strong>in</strong> all twelve<br />
months<br />
Mean M<strong>in</strong>imum<br />
Temperature<br />
DRAFT HANDBOOK<br />
0°C<br />
Jan Feb Mar Apr May Jun Jul Aug Sep Oct Nov Dec<br />
Outdoor <strong>Condensation</strong> Potential<br />
The comparison illustrated <strong>in</strong> Figure 4.7 and Figure 4.8 can identify the month with the greatest<br />
potential for outdoor condensation and how many months are affected <strong>in</strong> each year, under<br />
<strong>Australian</strong> Build<strong>in</strong>g <strong>Codes</strong> <strong>Board</strong> Page 37