Condensation in Buildings - Australian Building Codes Board
Condensation in Buildings - Australian Building Codes Board
Condensation in Buildings - Australian Building Codes Board

You also want an ePaper? Increase the reach of your titles
YUMPU automatically turns print PDFs into web optimized ePapers that Google loves.
Information Handbook: <strong>Condensation</strong> <strong>in</strong> Build<strong>in</strong>gs<br />
Exam<strong>in</strong><strong>in</strong>g which of the curv<strong>in</strong>g relative humidity l<strong>in</strong>es pass through the two comfort zones<br />
provides some useful observations. The Birdsville case suggests that build<strong>in</strong>g occupants<br />
acclimatised to summer <strong>in</strong> a hot-dry climate may tolerate relative humidity lower than 20% and<br />
up to about 60% (from bottom-right corner of the comfort zone up to top-left). People here would<br />
notice discomfort before relative humidity reached levels likely to promote mould growth on<br />
build<strong>in</strong>g surfaces. By contrast, adaptation to the cold Thredbo w<strong>in</strong>ter climate allows relative<br />
humidity approach<strong>in</strong>g 100% to feel acceptable. In colder climates, problematic relative humidity<br />
levels may develop without provid<strong>in</strong>g any sensory alert to occupants.<br />
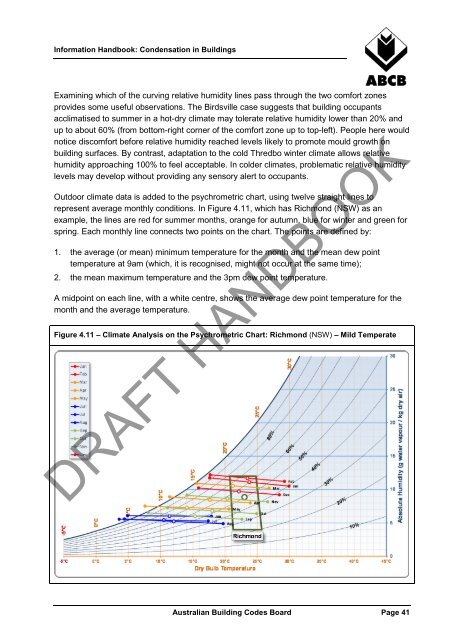
Outdoor climate data is added to the psychrometric chart, us<strong>in</strong>g twelve straight l<strong>in</strong>es to<br />
represent average monthly conditions. In Figure 4.11, which has Richmond (NSW) as an<br />
example, the l<strong>in</strong>es are red for summer months, orange for autumn, blue for w<strong>in</strong>ter and green for<br />
spr<strong>in</strong>g. Each monthly l<strong>in</strong>e connects two po<strong>in</strong>ts on the chart. The po<strong>in</strong>ts are def<strong>in</strong>ed by:<br />
1. the average (or mean) m<strong>in</strong>imum temperature for the month and the mean dew po<strong>in</strong>t<br />
temperature at 9am (which, it is recognised, might not occur at the same time);<br />
2. the mean maximum temperature and the 3pm dew po<strong>in</strong>t temperature.<br />
A midpo<strong>in</strong>t on each l<strong>in</strong>e, with a white centre, shows the average dew po<strong>in</strong>t temperature for the<br />
month and the average temperature.<br />
Figure 4.11 – Climate Analysis on the Psychrometric Chart: Richmond (NSW) – Mild Temperate<br />
DRAFT HANDBOOK<br />
<strong>Australian</strong> Build<strong>in</strong>g <strong>Codes</strong> <strong>Board</strong> Page 41