Condensation in Buildings - Australian Building Codes Board
Condensation in Buildings - Australian Building Codes Board
Condensation in Buildings - Australian Building Codes Board

Create successful ePaper yourself
Turn your PDF publications into a flip-book with our unique Google optimized e-Paper software.
Information Handbook: <strong>Condensation</strong> <strong>in</strong> Build<strong>in</strong>gs<br />
5.9 Risk Assessment Calculation Methods and Software<br />
The assessment of condensation risk <strong>in</strong> build<strong>in</strong>gs rema<strong>in</strong>s a develop<strong>in</strong>g field. The approaches<br />
on offer are generally divided between steady state and transient methods although they share<br />
a common focus on diffusion as the ma<strong>in</strong> means of water vapour movement through the<br />
build<strong>in</strong>g fabric.<br />
Steady state methods<br />
Steady state methods track the diffusion of water vapour through the materials and spaces of a<br />
build<strong>in</strong>g envelope, compar<strong>in</strong>g its chang<strong>in</strong>g dew po<strong>in</strong>t with the temperature of surfaces it<br />
encounters along the way. The water vapour follows a simple one dimensional path and its dew<br />
po<strong>in</strong>t decl<strong>in</strong>es <strong>in</strong> proportion to the water vapour resistance of the materials it diffuses through.<br />
“Steady state” refers to the assumption that <strong>in</strong>door and outdoor air temperatures and dew po<strong>in</strong>ts<br />
can reasonably be considered to ma<strong>in</strong>ta<strong>in</strong> their average levels dur<strong>in</strong>g the period be<strong>in</strong>g<br />
reviewed. The most common convention is to consider monthly average conditions,<br />
accumulat<strong>in</strong>g results over the course of a typical year.<br />
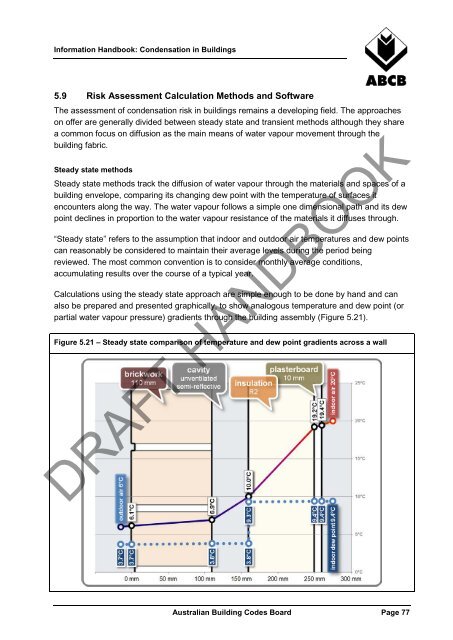
Calculations us<strong>in</strong>g the steady state approach are simple enough to be done by hand and can<br />
also be prepared and presented graphically, to show analogous temperature and dew po<strong>in</strong>t (or<br />
partial water vapour pressure) gradients through the build<strong>in</strong>g assembly (Figure 5.21).<br />
Figure 5.21 – Steady state comparison of temperature and dew po<strong>in</strong>t gradients across a wall<br />
DRAFT HANDBOOK<br />
<strong>Australian</strong> Build<strong>in</strong>g <strong>Codes</strong> <strong>Board</strong> Page 77