Comparative dental development and microstructure of ... - UCL
Comparative dental development and microstructure of ... - UCL
Comparative dental development and microstructure of ... - UCL

Create successful ePaper yourself
Turn your PDF publications into a flip-book with our unique Google optimized e-Paper software.
DENTAL DEVELOPMENT IN PROCONSUL<br />
187<br />
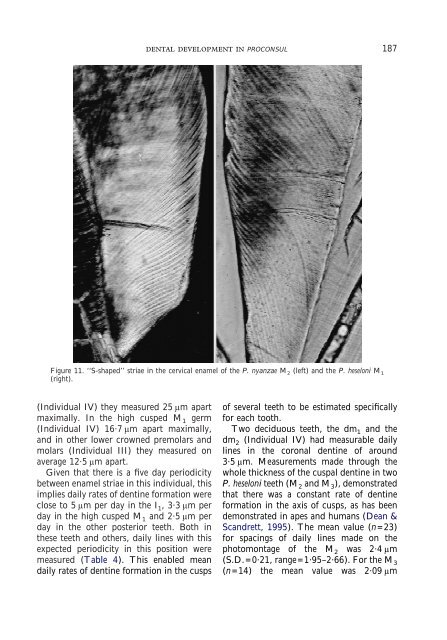
Figure 11. ‘‘S-shaped’’ striae in the cervical enamel <strong>of</strong> the P. nyanzae M 2 (left) <strong>and</strong> the P. heseloni M 1<br />
(right).<br />
(Individual IV) they measured 25 μm apart<br />
maximally. In the high cusped M 1 germ<br />
(Individual IV) 16·7 μm apart maximally,<br />
<strong>and</strong> in other lower crowned premolars <strong>and</strong><br />
molars (Individual III) they measured on<br />
average 12·5 μm apart.<br />
Given that there is a five day periodicity<br />
between enamel striae in this individual, this<br />
implies daily rates <strong>of</strong> dentine formation were<br />
close to 5 μm per day in the I 1 , 3·3 μm per<br />
day in the high cusped M 1 <strong>and</strong> 2·5 μm per<br />
day in the other posterior teeth. Both in<br />
these teeth <strong>and</strong> others, daily lines with this<br />
expected periodicity in this position were<br />
measured (Table 4). This enabled mean<br />
daily rates <strong>of</strong> dentine formation in the cusps<br />
<strong>of</strong> several teeth to be estimated specifically<br />
for each tooth.<br />
Two deciduous teeth, the dm 1 <strong>and</strong> the<br />
dm 2 (Individual IV) had measurable daily<br />
lines in the coronal dentine <strong>of</strong> around<br />
3·5 μm. Measurements made through the<br />
whole thickness <strong>of</strong> the cuspal dentine in two<br />
P. heseloni teeth (M 2 <strong>and</strong> M 3 ), demonstrated<br />
that there was a constant rate <strong>of</strong> dentine<br />
formation in the axis <strong>of</strong> cusps, as has been<br />
demonstrated in apes <strong>and</strong> humans (Dean &<br />
Sc<strong>and</strong>rett, 1995). The mean value (n=23)<br />
for spacings <strong>of</strong> daily lines made on the<br />
photomontage <strong>of</strong> the M 2 was 2·4 μm<br />
(S.D.=0·21, range=1·95–2·66). For the M 3<br />
(n=14) the mean value was 2·09 μm