Comparative dental development and microstructure of ... - UCL
Comparative dental development and microstructure of ... - UCL
Comparative dental development and microstructure of ... - UCL

You also want an ePaper? Increase the reach of your titles
YUMPU automatically turns print PDFs into web optimized ePapers that Google loves.
DENTAL DEVELOPMENT IN PROCONSUL<br />
191<br />
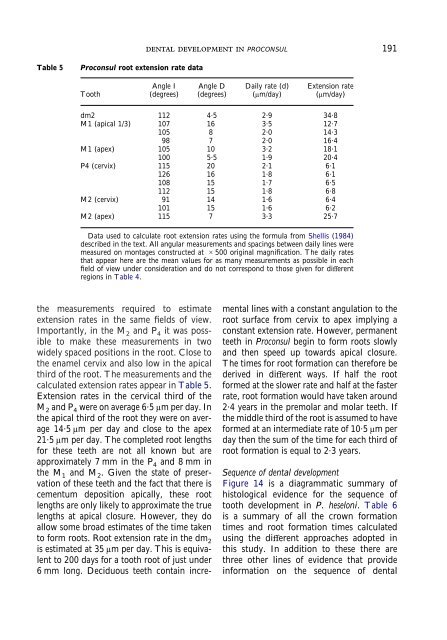
Table 5<br />
Proconsul root extension rate data<br />
Tooth<br />
Angle I<br />
(degrees)<br />
Angle D<br />
(degrees)<br />
Daily rate (d)<br />
(μm/day)<br />
Extension rate<br />
(μm/day)<br />
dm2 112 4·5 2·9 34·8<br />
M1 (apical 1/3) 107 16 3·5 12·7<br />
105 8 2·0 14·3<br />
98 7 2·0 16·4<br />
M1 (apex) 105 10 3·2 18·1<br />
100 5·5 1·9 20·4<br />
P4 (cervix) 115 20 2·1 6·1<br />
126 16 1·8 6·1<br />
108 15 1·7 6·5<br />
112 15 1·8 6·8<br />
M2 (cervix) 91 14 1·6 6·4<br />
101 15 1·6 6·2<br />
M2 (apex) 115 7 3·3 25·7<br />
Data used to calculate root extension rates using the formula from Shellis (1984)<br />
described in the text. All angular measurements <strong>and</strong> spacings between daily lines were<br />
measured on montages constructed at 500 original magnification. The daily rates<br />
that appear here are the mean values for as many measurements as possible in each<br />
field <strong>of</strong> view under consideration <strong>and</strong> do not correspond to those given for different<br />
regions in Table 4.<br />
the measurements required to estimate<br />
extension rates in the same fields <strong>of</strong> view.<br />
Importantly, in the M 2 <strong>and</strong> P 4 it was possible<br />
to make these measurements in two<br />
widely spaced positions in the root. Close to<br />
the enamel cervix <strong>and</strong> also low in the apical<br />
third <strong>of</strong> the root. The measurements <strong>and</strong> the<br />
calculated extension rates appear in Table 5.<br />
Extension rates in the cervical third <strong>of</strong> the<br />
M 2 <strong>and</strong> P 4 were on average 6·5 μm per day. In<br />
the apical third <strong>of</strong> the root they were on average<br />
14·5 μm per day <strong>and</strong> close to the apex<br />
21·5 μm per day. The completed root lengths<br />
for these teeth are not all known but are<br />
approximately 7 mm in the P 4 <strong>and</strong> 8 mm in<br />
the M 1 <strong>and</strong> M 2 . Given the state <strong>of</strong> preservation<br />
<strong>of</strong> these teeth <strong>and</strong> the fact that there is<br />
cementum deposition apically, these root<br />
lengths are only likely to approximate the true<br />
lengths at apical closure. However, they do<br />
allow some broad estimates <strong>of</strong> the time taken<br />
to form roots. Root extension rate in the dm 2<br />
is estimated at 35 μm per day. This is equivalent<br />
to 200 days for a tooth root <strong>of</strong> just under<br />
6 mm long. Deciduous teeth contain incremental<br />
lines with a constant angulation to the<br />
root surface from cervix to apex implying a<br />
constant extension rate. However, permanent<br />
teeth in Proconsul begin to form roots slowly<br />
<strong>and</strong> then speed up towards apical closure.<br />
The times for root formation can therefore be<br />
derived in different ways. If half the root<br />
formed at the slower rate <strong>and</strong> half at the faster<br />
rate, root formation would have taken around<br />
2·4 years in the premolar <strong>and</strong> molar teeth. If<br />
the middle third <strong>of</strong> the root is assumed to have<br />
formed at an intermediate rate <strong>of</strong> 10·5 μm per<br />
day then the sum <strong>of</strong> the time for each third <strong>of</strong><br />
root formation is equal to 2·3 years.<br />
Sequence <strong>of</strong> <strong>dental</strong> <strong>development</strong><br />
Figure 14 is a diagrammatic summary <strong>of</strong><br />
histological evidence for the sequence <strong>of</strong><br />
tooth <strong>development</strong> in P. heseloni. Table 6<br />
is a summary <strong>of</strong> all the crown formation<br />
times <strong>and</strong> root formation times calculated<br />
using the different approaches adopted in<br />
this study. In addition to these there are<br />
three other lines <strong>of</strong> evidence that provide<br />
information on the sequence <strong>of</strong> <strong>dental</strong>