DFHADprototype071409.. - Urban Drainage and Flood Control District
DFHADprototype071409.. - Urban Drainage and Flood Control District
DFHADprototype071409.. - Urban Drainage and Flood Control District

Create successful ePaper yourself
Turn your PDF publications into a flip-book with our unique Google optimized e-Paper software.
SECTION 3 – HYDROLOGIC ANALYSIS<br />
HOFFMAN MAJOR DRAINAGEWAY PLANNING<br />
FLOOD HAZARD AREA DELINEATION<br />
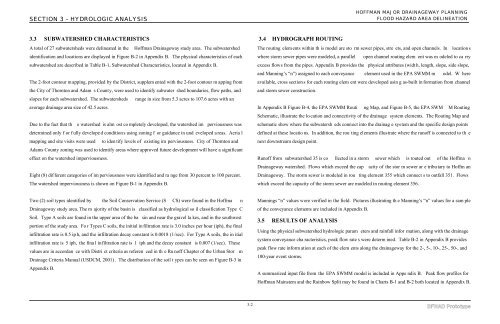
3.3 SUBWATERSHED CHARACTERISTICS<br />
A total of 27 subwatersheds were delineated in the Hoffman <strong>Drainage</strong>way study area. The subwatershed<br />
identification <strong>and</strong> locations are displayed in Figure B-2 in Appendix B. The physical characteristics of each<br />
subwatershed are described in Table B-1, Subwatershed Characteristics, located in Appendix B.<br />
The 2-foot contour m apping, provided by the <strong>District</strong>, supplem ented with the 2-foot contour m apping from<br />
the City of Thornton <strong>and</strong> Adam s County, were used to identify subwater shed boundaries, flow paths, <strong>and</strong><br />
slopes for each subwatershed. The subwatersheds range in size from 5.3 acres to 107.6 acres with an<br />
average drainage area size of 42.5 acres.<br />
Due to the fact that th e watershed is alm ost co mpletely developed, the watershed im perviousness was<br />
determined only f or f ully develope d condition s using zoning f or guidance in und eveloped a reas. Aeria l<br />
mapping <strong>and</strong> site visits were used to iden tify levels of existing im perviousness. City of Thornton <strong>and</strong><br />
Adams County zoning was used to identify areas where approved future development will have a significant<br />
effect on the watershed imperviousness.<br />
Eight (8) dif ferent categories of im perviousness were identified <strong>and</strong> ra nge from 30 percent to 100 percent.<br />
The watershed imperviousness is shown on Figure B-1 in Appendix B.<br />
3.4 HYDROGRAPH ROUTING<br />
The routing elem ents within th is model are sto rm sewer pipes, stre ets, <strong>and</strong> open channels. In location s<br />
where storm sewer pipes were modeled, a parallel open channel routing elem ent was m odeled to ca rry<br />
excess flows from the pipes. Appendix B provides the physical attributes (widt h, length, slope, side slope,<br />
<strong>and</strong> Manning’s “n”) assigned to each conveyance element used in the EPA SWMM m odel. W here<br />
available, cross section s for each routing elem ent were developed usin g as-built in formation from channel<br />
<strong>and</strong> storm sewer construction.<br />
In Appendix B Figure B-4, the EPA SWMM Routi ng Map, <strong>and</strong> Figure B-5, the EPA SWM M Routing<br />
Schematic, illustrate the lo cation <strong>and</strong> connectivity of the drainage system elements. The Routing Map <strong>and</strong><br />
schematic show where the subwatersh eds connect into the drainag e system <strong>and</strong> the specific design points<br />
defined at these locatio ns. In addition, the rou ting elements illustrate where the runoff is connected to th e<br />
next downstream design point.<br />
Runoff from subwatershed 35 is co llected in a storm sewer which is routed out of the Hoffma n<br />
<strong>Drainage</strong>way watershed. Flows which exceed the cap acity of the stor m sewer ar e tribu tary to Hoffm an<br />
<strong>Drainage</strong>way. The storm sewer is modeled in rou ting element 355 which connect s to outfall 351. Flows<br />
which exceed the capacity of the storm sewer are modeled in routing element 356.<br />
Two (2) soil types identified by the Soil Conservation Service (S CS) were found in the Hoffma n<br />
<strong>Drainage</strong>way study area. The m ajority of the basin is classified as hydrological so il classification Type C<br />
Soil. Type A soils are found in the upper area of the ba sin <strong>and</strong> near the gravel la kes, <strong>and</strong> in the southwest<br />
portion of the study area. Fo r Types C soils, the initial in filtration rate is 3.0 inches per hour (iph), the final<br />
infiltration rate is 0.5 ip h, <strong>and</strong> the infiltration decay constant is 0.0018 (1/sec). For Type A soils, the in itial<br />
infiltration rate is 5 iph, the fina l infiltration rate is 1 iph <strong>and</strong> the decay constant is 0.007 (1/sec). These<br />
values are in accordan ce with Distri ct criteria as referen ced in th e Ru noff Chapter of the <strong>Urban</strong> Stor m<br />
<strong>Drainage</strong> Criteria Manual (USDCM, 2001) . The distribution of the soil t ypes can be seen on Figure B-3 in<br />
Appendix B.<br />
Mannings “n” values were verified in the field. Pictures illustrating th e Manning’s “n” values for a sam ple<br />
of the conveyance elements are included in Appendix B.<br />
3.5 RESULTS OF ANALYSIS<br />
Using the physical subwatershed hydrologic param eters <strong>and</strong> rainfall infor mation, along with the drainage<br />
system conveyance cha racteristics, peak flow rate s were determ ined. Table B-2 in Appendix B provides<br />
peak flow rate inform ation at each of the elem ents along the drainageway for the 2-, 5-, 10-, 25-, 50-, <strong>and</strong><br />
100-year event storms.<br />
A summarized input file from the EPA SWMM model is included in Appe ndix B. Peak flow profiles for<br />
Hoffman Mainstem <strong>and</strong> the Rainbow Split may be found in Charts B-1 <strong>and</strong> B-2 both located in Appendix B.<br />
3-2<br />
DFHAD Prototype