Common Agricultural Policy - UK Food Group
Common Agricultural Policy - UK Food Group
Common Agricultural Policy - UK Food Group

Create successful ePaper yourself
Turn your PDF publications into a flip-book with our unique Google optimized e-Paper software.
The <strong>Common</strong> <strong>Agricultural</strong> <strong>Policy</strong> 8<br />
Oilseeds<br />
In 1998 overall oilseed production in the EU was 15.9 million<br />
tonnes (including 1.2 million tonnes of non-food production)<br />
which was an increase of 44 per cent and 11 per cent<br />
compared to 1996 and 1997, respectively. The European<br />
Union is a significant net importer of oilseeds. Soya beans<br />
account for most imports and between 1996 and 1998 the<br />
proportion of total imports varied between 81 and 86 per<br />
cent. Two product categories derive from oilseeds: oil for<br />
human consumption, and cake for animal feed. The latter is<br />
responsible for the main European imports, as soya beans<br />
(mostly from the US) are used as a important protein<br />
source in the EU livestock feed sector (fig 1.6).<br />
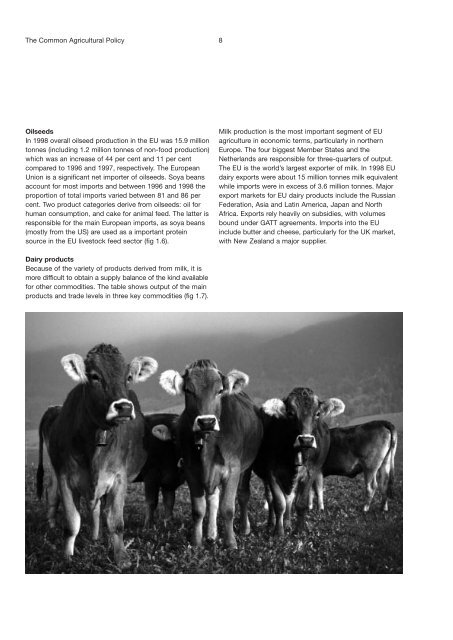
Milk production is the most important segment of EU<br />
agriculture in economic terms, particularly in northern<br />
Europe. The four biggest Member States and the<br />
Netherlands are responsible for three-quarters of output.<br />
The EU is the world’s largest exporter of milk. In 1998 EU<br />
dairy exports were about 15 million tonnes milk equivalent<br />
while imports were in excess of 3.6 million tonnes. Major<br />
export markets for EU dairy products include the Russian<br />
Federation, Asia and Latin America, Japan and North<br />
Africa. Exports rely heavily on subsidies, with volumes<br />
bound under GATT agreements. Imports into the EU<br />
include butter and cheese, particularly for the <strong>UK</strong> market,<br />
with New Zealand a major supplier.<br />
Dairy products<br />
Because of the variety of products derived from milk, it is<br />
more difficult to obtain a supply balance of the kind available<br />
for other commodities. The table shows output of the main<br />
products and trade levels in three key commodities (fig 1.7).