Common Agricultural Policy - UK Food Group
Common Agricultural Policy - UK Food Group
Common Agricultural Policy - UK Food Group

Create successful ePaper yourself
Turn your PDF publications into a flip-book with our unique Google optimized e-Paper software.
The <strong>Common</strong> <strong>Agricultural</strong> <strong>Policy</strong><br />
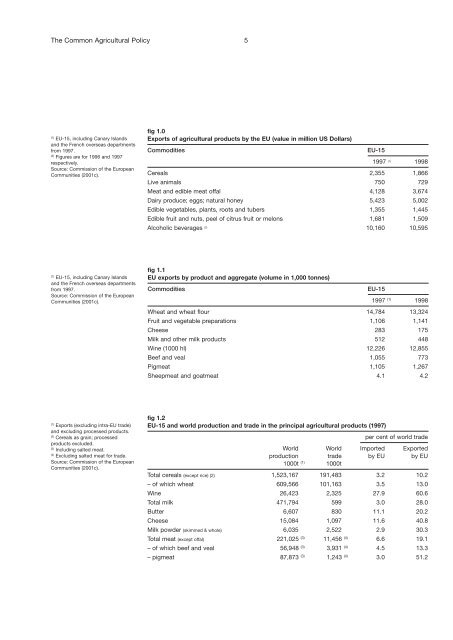
5<br />
(1)<br />
EU-15, including Canary Islands<br />
and the French overseas departments<br />
from 1997.<br />
(2)<br />
Figures are for 1996 and 1997<br />
respectively.<br />
Source: Commission of the European<br />
Communities (2001c).<br />
fig 1.0<br />
Exports of agricultural products by the EU (value in million US Dollars)<br />
Commodities<br />
EU-15<br />
1997 (1) 1998<br />
Cereals 2,355 1,866<br />
Live animals 750 729<br />
Meat and edible meat offal 4,128 3,674<br />
Dairy produce; eggs; natural honey 5,423 5,002<br />
Edible vegetables, plants, roots and tubers 1,355 1,445<br />
Edible fruit and nuts, peel of citrus fruit or melons 1,681 1,509<br />
Alcoholic beverages (2) 10,160 10,595<br />
(1)<br />
EU-15, including Canary Islands<br />
and the French overseas departments<br />
from 1997.<br />
Source: Commission of the European<br />
Communities (2001c).<br />
fig 1.1<br />
EU exports by product and aggregate (volume in 1,000 tonnes)<br />
Commodities<br />
EU-15<br />
1997 (1) 1998<br />
Wheat and wheat flour 14,784 13,324<br />
Fruit and vegetable preparations 1,106 1,141<br />
Cheese 283 175<br />
Milk and other milk products 512 448<br />
Wine (1000 hl) 12,226 12,855<br />
Beef and veal 1,055 773<br />
Pigmeat 1,105 1,267<br />
Sheepmeat and goatmeat 4.1 4.2<br />
(1)<br />
Exports (excluding intra-EU trade)<br />
and excluding processed products.<br />
(2)<br />
Cereals as grain; processed<br />
products excluded.<br />
(3)<br />
Including salted meat.<br />
(4)<br />
Excluding salted meat for trade.<br />
Source: Commission of the European<br />
Communities (2001c).<br />
fig 1.2<br />
EU-15 and world production and trade in the principal agricultural products (1997)<br />
per cent of world trade<br />
World World Imported Exported<br />
production trade by EU by EU<br />
1000t (1) 1000t<br />
Total cereals (except rice) (2) 1,523,167 191,483 3.2 10.2<br />
– of which wheat 609,566 101,163 3.5 13.0<br />
Wine 26,423 2,325 27.9 60.6<br />
Total milk 471,794 599 3.0 28.0<br />
Butter 6,607 830 11.1 20.2<br />
Cheese 15,084 1,097 11.6 40.8<br />
Milk powder (skimmed & whole) 6,035 2,522 2.9 30.3<br />
Total meat (except offal) 221,025 (3) 11,456 (4) 6.6 19.1<br />
– of which beef and veal 56,948 (3) 3,931 (4) 4.5 13.3<br />
– pigmeat 87,873 (3) 1,243 (4) 3.0 51.2