Common Agricultural Policy - UK Food Group
Common Agricultural Policy - UK Food Group
Common Agricultural Policy - UK Food Group

You also want an ePaper? Increase the reach of your titles
YUMPU automatically turns print PDFs into web optimized ePapers that Google loves.
The <strong>Common</strong> <strong>Agricultural</strong> <strong>Policy</strong><br />
26<br />
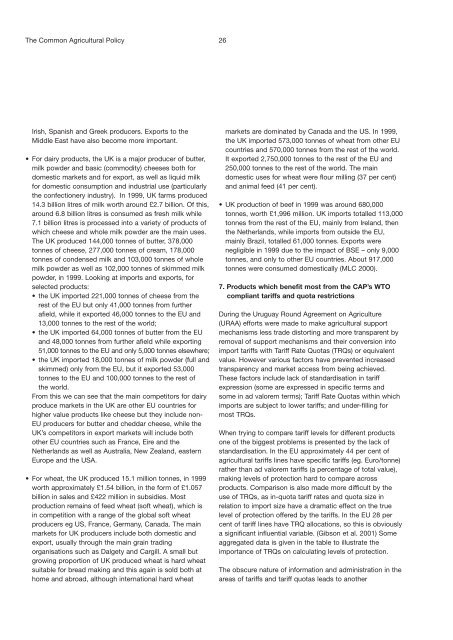
Irish, Spanish and Greek producers. Exports to the<br />
Middle East have also become more important.<br />
• For dairy products, the <strong>UK</strong> is a major producer of butter,<br />
milk powder and basic (commodity) cheeses both for<br />
domestic markets and for export, as well as liquid milk<br />
for domestic consumption and industrial use (particularly<br />
the confectionery industry). In 1999, <strong>UK</strong> farms produced<br />
14.3 billion litres of milk worth around £2.7 billion. Of this,<br />
around 6.8 billion litres is consumed as fresh milk while<br />
7.1 billion litres is processed into a variety of products of<br />
which cheese and whole milk powder are the main uses.<br />
The <strong>UK</strong> produced 144,000 tonnes of butter, 378,000<br />
tonnes of cheese, 277,000 tonnes of cream, 178,000<br />
tonnes of condensed milk and 103,000 tonnes of whole<br />
milk powder as well as 102,000 tonnes of skimmed milk<br />
powder, in 1999. Looking at imports and exports, for<br />
selected products:<br />
• the <strong>UK</strong> imported 221,000 tonnes of cheese from the<br />
rest of the EU but only 41,000 tonnes from further<br />
afield, while it exported 46,000 tonnes to the EU and<br />
13,000 tonnes to the rest of the world;<br />
• the <strong>UK</strong> imported 64,000 tonnes of butter from the EU<br />
and 48,000 tonnes from further afield while exporting<br />
51,000 tonnes to the EU and only 5,000 tonnes elsewhere;<br />
• the <strong>UK</strong> imported 18,000 tonnes of milk powder (full and<br />
skimmed) only from the EU, but it exported 53,000<br />
tonnes to the EU and 100,000 tonnes to the rest of<br />
the world.<br />
From this we can see that the main competitors for dairy<br />
produce markets in the <strong>UK</strong> are other EU countries for<br />
higher value products like cheese but they include non-<br />
EU producers for butter and cheddar cheese, while the<br />
<strong>UK</strong>’s competitors in export markets will include both<br />
other EU countries such as France, Eire and the<br />
Netherlands as well as Australia, New Zealand, eastern<br />
Europe and the USA.<br />
• For wheat, the <strong>UK</strong> produced 15.1 million tonnes, in 1999<br />
worth approximately £1.54 billion, in the form of £1.057<br />
billion in sales and £422 million in subsidies. Most<br />
production remains of feed wheat (soft wheat), which is<br />
in competition with a range of the global soft wheat<br />
producers eg US, France, Germany, Canada. The main<br />
markets for <strong>UK</strong> producers include both domestic and<br />
export, usually through the main grain trading<br />
organisations such as Dalgety and Cargill. A small but<br />
growing proportion of <strong>UK</strong> produced wheat is hard wheat<br />
suitable for bread making and this again is sold both at<br />
home and abroad, although international hard wheat<br />
markets are dominated by Canada and the US. In 1999,<br />
the <strong>UK</strong> imported 573,000 tonnes of wheat from other EU<br />
countries and 570,000 tonnes from the rest of the world.<br />
It exported 2,750,000 tonnes to the rest of the EU and<br />
250,000 tonnes to the rest of the world. The main<br />
domestic uses for wheat were flour milling (37 per cent)<br />
and animal feed (41 per cent).<br />
• <strong>UK</strong> production of beef in 1999 was around 680,000<br />
tonnes, worth £1,996 million. <strong>UK</strong> imports totalled 113,000<br />
tonnes from the rest of the EU, mainly from Ireland, then<br />
the Netherlands, while imports from outside the EU,<br />
mainly Brazil, totalled 61,000 tonnes. Exports were<br />
negligible in 1999 due to the impact of BSE – only 9,000<br />
tonnes, and only to other EU countries. About 917,000<br />
tonnes were consumed domestically (MLC 2000).<br />
7. Products which benefit most from the CAP’s WTO<br />
compliant tariffs and quota restrictions<br />
During the Uruguay Round Agreement on Agriculture<br />
(URAA) efforts were made to make agricultural support<br />
mechanisms less trade distorting and more transparent by<br />
removal of support mechanisms and their conversion into<br />
import tariffs with Tariff Rate Quotas (TRQs) or equivalent<br />
value. However various factors have prevented increased<br />
transparency and market access from being achieved.<br />
These factors include lack of standardisation in tariff<br />
expression (some are expressed in specific terms and<br />
some in ad valorem terms); Tariff Rate Quotas within which<br />
imports are subject to lower tariffs; and under-filling for<br />
most TRQs.<br />
When trying to compare tariff levels for different products<br />
one of the biggest problems is presented by the lack of<br />
standardisation. In the EU approximately 44 per cent of<br />
agricultural tariffs lines have specific tariffs (eg. Euro/tonne)<br />
rather than ad valorem tariffs (a percentage of total value),<br />
making levels of protection hard to compare across<br />
products. Comparison is also made more difficult by the<br />
use of TRQs, as in-quota tariff rates and quota size in<br />
relation to import size have a dramatic effect on the true<br />
level of protection offered by the tariffs. In the EU 28 per<br />
cent of tariff lines have TRQ allocations, so this is obviously<br />
a significant influential variable. (Gibson et al. 2001) Some<br />
aggregated data is given in the table to illustrate the<br />
importance of TRQs on calculating levels of protection.<br />
The obscure nature of information and administration in the<br />
areas of tariffs and tariff quotas leads to another