Common Agricultural Policy - UK Food Group
Common Agricultural Policy - UK Food Group
Common Agricultural Policy - UK Food Group

You also want an ePaper? Increase the reach of your titles
YUMPU automatically turns print PDFs into web optimized ePapers that Google loves.
The <strong>Common</strong> <strong>Agricultural</strong> <strong>Policy</strong> 23<br />
has not affected the lesser (market) regimes applied to pigs<br />
and poultry.<br />
There is some analysis available of the distribution of CAP<br />
direct payments to holdings of different sizes. As would be<br />
expected for payments linked largely to areas farmed<br />
(arable), volumes produced (olives), or number of stock<br />
kept (beef, sheep) payments tend to go mainly to larger<br />
farms. Recent work by the Australian Bureau of Agriculture<br />
and Resource Economics (ABARE) is particularly relevant.<br />
The ABARE analysis has been carried out focusing on the<br />
size group of farms that receive support. Size classification<br />
is based on standard gross margins per farm. There are five<br />
groups: Extra small 400,000 Euro.<br />
It appears that only 17 per cent of all farms, ie those in the<br />
two largest categories received 50 per cent of the<br />
agricultural support provided by CAP payments, illustrated<br />
in the figures below. On a full time equivalent basis the two<br />
largest groups of farms earned a higher average income in<br />
1996 than the average worker in the EU.<br />
Large farms account for a very substantial proportion of<br />
total output in several sectors. According to Eurostat (2001)<br />
there were 6,989,100 farm holdings in the EU15 (1997<br />
figures). Slightly over 3 per cent or around 226,300 of these<br />
farm holdings were of 100 hectares or larger. The farm<br />
holdings in the 100 hectare or more category control 53.2<br />
million hectares out of the total 128.7 million hectares. Their<br />
overall share of total agricultural production is estimated at<br />
about 50-70 per cent (Consumers in Europe <strong>Group</strong>, 2000)<br />
(fig 2.9-3.0).<br />
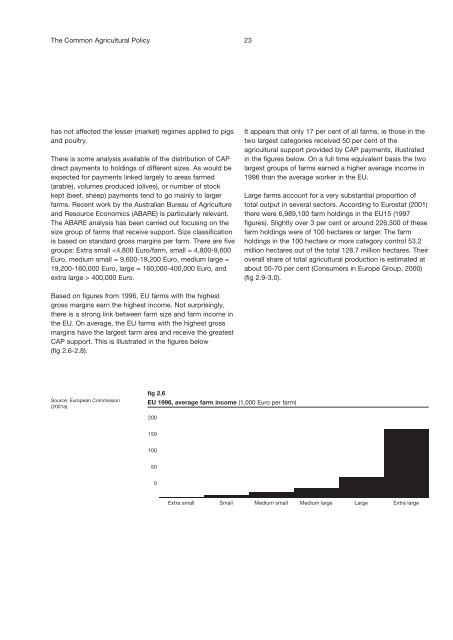
Based on figures from 1996, EU farms with the highest<br />
gross margins earn the highest income. Not surprisingly,<br />
there is a strong link between farm size and farm income in<br />
the EU. On average, the EU farms with the highest gross<br />
margins have the largest farm area and receive the greatest<br />
CAP support. This is illustrated in the figures below<br />
(fig 2.6-2.8).<br />
Source: European Commission<br />
(2001a).<br />
fig 2.6<br />
EU 1996, average farm income (1,000 Euro per farm)<br />
200<br />
150<br />
100<br />
50<br />
0<br />
Extra small Small Medium small Medium large Large Extra large