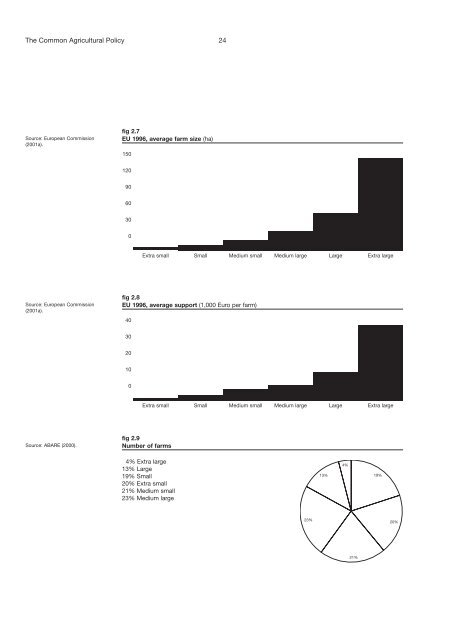
The <strong>Common</strong> <strong>Agricultural</strong> <strong>Policy</strong> 24 Source: European Commission (2001a). fig 2.7 EU 1996, average farm size (ha) 150 120 90 60 30 0 Extra small Small Medium small Medium large Large Extra large Source: European Commission (2001a). fig 2.8 EU 1996, average support (1,000 Euro per farm) 40 30 20 10 0 Extra small Small Medium small Medium large Large Extra large Source: ABARE (2000). fig 2.9 Number of farms 4% Extra large 13% Large 19% Small 20% Extra small 21% Medium small 23% Medium large
The <strong>Common</strong> <strong>Agricultural</strong> <strong>Policy</strong> 25 Source:ABARE (2000) fig 3.0 Share of support 3% Extra small 5% Small 14% Medium small 21% Extra large 28% Medium large 29% Large 6. Focus on <strong>UK</strong> agriculture – main products and competitors in domestic, EU and world markets Agriculture in the <strong>UK</strong> has traditionally been one of the more productive and efficient farm sectors within the EU, with average farm sizes generally significantly higher and agricultural employment significantly lower than elsewhere. However this varies between commodities. East Anglian grain production is generally regarded as particularly competitive relative to the rest of Europe, while <strong>UK</strong> dairy, beef and pigmeat production are today somewhat overshadowed by other Member States including the Netherlands, Germany, France and Denmark. The <strong>UK</strong> is 81 per cent self-sufficient in temperate foodstuffs (MAFF, 2000b) and the value of <strong>UK</strong> agricultural production in 1999 was around £13.7 billion. In overview, the <strong>UK</strong>’s main outputs include cereals, dairy products, sheepmeat and beef, as well as pigmeat. Thus to examine markets and competitors in more detail, we focus on the following key commodities: pigs, sheep, dairy products, wheat and beef: • For pigs, the <strong>UK</strong> produced just over a million tonnes of pigmeat in 1999, worth £782 million. It imported 209,000 tonnes from the rest of the EU and only 3,000 tonnes from outside the EU. It exported 193,000 tonnes to other EU countries and 32,000 tonnes further afield. The main competitors for <strong>UK</strong> producers both at home and in export markets are thus those elsewhere in the EU – particularly Denmark and the Netherlands, both for domestic markets and abroad (although pig exports are much less important for the <strong>UK</strong> than these countries). <strong>UK</strong> slaughter weights for pigs tend to be lower than those of the main global exporters (eg including US hogs), so they often fill different market niches. • For sheep, the <strong>UK</strong> produced 401,000 tonnes of sheepmeat in 1999, worth £1,007 million. The <strong>UK</strong> consumes 6.6 kg/head on average, each year. It imported 12,000 tonnes from the rest of the EU and 119,000 tonnes from the rest of the world, predominantly New Zealand. Thus the main competitor on <strong>UK</strong> markets is New Zealand and to a much lesser extent, the Republic of Ireland. While some southern Member States (Spain and Greece) are also important sheep producers, these are reared mainly for domestic and external markets and/or for milk production. There is a seasonality issue – New Zealand would claim it is not largely in direct competition with <strong>UK</strong> producers since its exports are available at a different time of year so it may help to safeguard the year-round <strong>UK</strong> market. However, this relationship is probably being eroded by changes in supply and demand, over time. Sheep production in the <strong>UK</strong> is largely for consumption in the <strong>UK</strong> and the rest of northern Europe, particularly France. In 1999 the <strong>UK</strong> exported 143,000 tonnes of sheepmeat to the rest of the EU and only 1,000 tonnes to the rest of the world. In recent years the <strong>UK</strong> established an important and growing export market of light lambs to southern Europe (Italy, Spain), where their products are in competition with