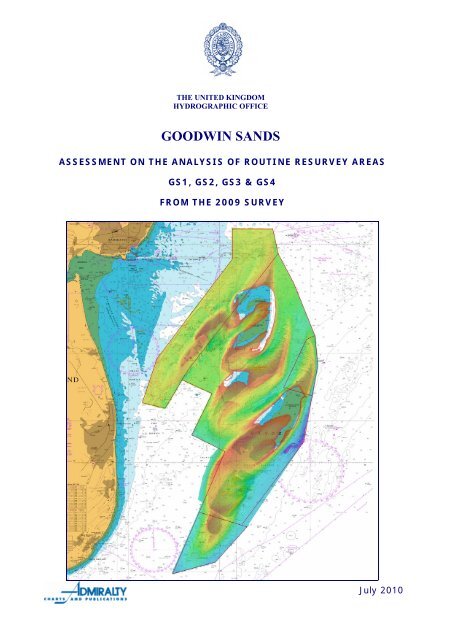
GS1-2-3-4 Goodwin Sands - United Kingdom Hydrographic Office
GS1-2-3-4 Goodwin Sands - United Kingdom Hydrographic Office
GS1-2-3-4 Goodwin Sands - United Kingdom Hydrographic Office

Create successful ePaper yourself
Turn your PDF publications into a flip-book with our unique Google optimized e-Paper software.
THE UNITED KINGDOM<br />
HYDROGRAPHIC OFFICE<br />
GOODWIN SANDS<br />
ASSESSMENT ON THE ANALYSIS OF ROUTINE RESURVEY AREAS<br />
<strong>GS1</strong>, GS2, GS3 & GS4<br />
FROM THE 2009 SURVEY<br />
July 2010
THE UNITED KINGDOM<br />
HYDROGRAPHIC OFFICE<br />
GOODWIN SANDS<br />
AREAS <strong>GS1</strong>, GS2, GS3 & GS4<br />
Assessment <strong>GS1</strong>-4/2009<br />
An assessment of the 2009 hydrographic survey of the area: to monitor recent seabed<br />
movement; to identify any implications for shipping; and to make recommendations for<br />
future surveys.<br />
The Admiralty Chart extracts, other graphics and tables in this Report are included for illustrative purposes only and are NOT<br />
TO BE USED FOR NAVIGATION.<br />
This material is protected by Crown Copyright. It may be downloaded from the UK <strong>Hydrographic</strong> <strong>Office</strong>'s (UKHO) web site<br />
and printed in full for personal or non-commercial internal business use. Extracts may also be reproduced for personal or<br />
non-commercial internal business use on the condition that the UK <strong>Hydrographic</strong> <strong>Office</strong> is acknowledged as the publisher and<br />
the Crown is acknowledged as the copyright owner.<br />
Applications for permission to reproduce the material for any other purpose (including any distribution of the material or<br />
extracts to third parties) can be made interactively on the UKHO's web site (www.ukho.gov.uk), by e-mail to<br />
intellectualproperty@ukho.gov.uk or in writing to Intellectual Property, UK <strong>Hydrographic</strong> <strong>Office</strong>, Admiralty Way, Taunton,<br />
Somerset, TA1 2DN.<br />
Assessment <strong>Goodwin</strong> <strong>Sands</strong>/2009 – Original Page 1 of 51
CONTENTS<br />
1. EXECUTIVE SUMMARY 5<br />
2. INTRODUCTION 6<br />
3. HISTORY 6<br />
4. DESCRIPTION OF THE AREA 7<br />
5. SHIPPING IN THE AREA 7<br />
6. 1997 SURVEY DETAILS 7<br />
7. 2003 SURVEY DETAILS 7<br />
8. 2006 SURVEY DETAILS 8<br />
9. 2009 SURVEY DETAILS 8<br />
10. DESCRIPTION OF RECENT BATHYMETRIC CHANGE 9<br />
11. IMPLICATIONS FOR SHIPPING 13<br />
12. RECOMMENDATIONS FOR FUTURE SURVEYS 13<br />
13. REFERENCES 17<br />
Assessment <strong>Goodwin</strong> <strong>Sands</strong>/2009 – Original Page 2 of 51
Survey History<br />
ANNEXES<br />
A-1 Area Specifications (Including Survey History) Area <strong>GS1</strong> 18<br />
A-2 Area Specifications (Including Survey History) Area GS2 19<br />
A-3 Area Specifications (Including Survey History) Area GS3 20<br />
A-4 Area Specifications (Including Survey History) Area GS4 21<br />
General Diagrams<br />
B <strong>Goodwin</strong> <strong>Sands</strong> Resurvey Scheme 22<br />
C Sun-Illuminated View of the 2009 Survey Showing Bank and Channel Migration 23<br />
D Shipping Routes 24<br />
E Sun-Illuminated View of the 2009 Survey and Location of Cross-Sections shown 25<br />
at Annex F<br />
F Survey Cross-Sections 26<br />
Whole Area Depth, Variability & Contour Plots<br />
G-1 Colour Banded Depth Plot from the 1997 Survey showing Selected Depths 28<br />
G-2 Colour Banded Depth Plot from the 2009 Survey showing Selected Depths 29<br />
H Variability Plot showing Bathymetric Changes between the 1997 and 2009 Survey 30<br />
Data and Charted Contours from the 2009 Survey<br />
I-1 Composite Diagram of the 2 metre Contour from the 1997 & 2009 31<br />
I-2 Composite Diagram of the 5 metre Contour from the 1997 & 2009 32<br />
I-3 Composite Diagram of the 10 metre Contour from the 1997 & 2009 33<br />
I-4 Composite Diagram of the 15 metre Contour from the 1997 & 2009 34<br />
<strong>GS1</strong> Area Depth, Variability & Contour Plots<br />
J-1 Colour Banded Depth Plot from the 2006 Survey showing Selected Depths Area <strong>GS1</strong> 35<br />
J-2 Colour Banded Depth Plot from the 2009 Survey showing Selected Depths Area <strong>GS1</strong> 36<br />
K Variability Plot showing Bathymetric Changes between the 2006 and 2009 Survey 37<br />
Data and Charted Contours from the 2009 Survey Area <strong>GS1</strong><br />
L-1 Composite Diagram of the 5 metre Contour from the 2006 & 2009 Area <strong>GS1</strong> 38<br />
L-2 Composite Diagram of the 10 metre Contour from the 2006 & 2009 Area <strong>GS1</strong> 39<br />
L-3 Composite Diagram of the 15 metre Contour from the 2006 & 2009 Area <strong>GS1</strong> 40<br />
GS2 Area Depth, Variability & Contour Plots<br />
M-1 Colour Banded Depth Plot from the 2003 Survey showing Selected Depths Area GS2 41<br />
M-2 Colour Banded Depth Plot from the 2009 Survey showing Selected Depths Area GS2 42<br />
N Variability Plot showing Bathymetric Changes between the 2006 and 2009 Survey 43<br />
Data and Charted Contours from the 2009 Survey Area GS2<br />
O-1 Composite Diagram of the 5 metre Contour from the 2003 & 2009 Area GS2 44<br />
Assessment <strong>Goodwin</strong> <strong>Sands</strong>/2009 – Original Page 3 of 51
O-2 Composite Diagram of the 10 metre Contour from the 2003 & 2009 Area GS2 45<br />
GS3 Area Depth, Variability & Contour Plots<br />
P-1 Colour Banded Depth Plot from the 2003 Survey showing Selected Depths Area GS3 46<br />
P-2 Colour Banded Depth Plot from the 2009 Survey showing Selected Depths Area GS3 47<br />
Q Variability Plot showing Bathymetric Changes between the 2006 and 2009 Survey 48<br />
Data and Charted Contours from the 2009 Survey Area GS3<br />
R-1 Composite Diagram of the 5 metre Contour from the 2003 & 2009 Area GS3 49<br />
R-2 Composite Diagram of the 10 metre Contour from the 2003 & 2009 Area GS3 50<br />
Proposed Limits<br />
S Proposed Revised Limits 51<br />
Assessment <strong>Goodwin</strong> <strong>Sands</strong>/2009 – Original Page 4 of 51
GOODWIN SANDS, 2009<br />
1. EXECUTIVE SUMMARY<br />
The Area and Recent Changes<br />
1.1 The 2009 survey was a complete re-survey of the <strong>Goodwin</strong> <strong>Sands</strong>. The area is covered<br />
by four routine resurvey areas with re-survey frequencies of 3, 6 and 12 years.<br />
1.2 Shipping generally avoids the shoal and changing banks of the <strong>Goodwin</strong> <strong>Sands</strong>,<br />
keeping offshore to the south and east or using the inshore route of Gull Stream to the<br />
west. Ferry traffic en-route to or from Ramsgate crosses the northern end of the<br />
<strong>Goodwin</strong> <strong>Sands</strong>.<br />
1.3 <strong>GS1</strong> (South Sand Head): The southern end of the bank system has seen a new limb<br />
develop, resulting in a realignment of the contours.<br />
1.4 GS2 (Gull Stream): The inshore buoyed route is relatively stable and devoid of<br />
significant sediments within the central part and along the western side, but with<br />
sandwaves at the north and south entrances, which have produced shallower depths in<br />
the 2009 survey. The survey as a whole is notably shallower than the previous survey,<br />
which is likely to be the result of different tidal reduction methods. Along the eastern<br />
side of Gull Stream, sinuous broken shoal areas have been reworked, with a bulge<br />
extending into the channel between North West <strong>Goodwin</strong> and North <strong>Goodwin</strong> buoys.<br />
1.5 GS3 (North Head of South Calliper): The bank has migrated eastwards by<br />
approximately 70 metres and extended north-eastwards by 200 metres since the 2003<br />
survey.<br />
1.6 GS4 (<strong>Goodwin</strong> <strong>Sands</strong> Inner Area): The most dramatic changes to the bank complex<br />
have occurred in this area, in particular to South Calliper. Depths have increased by<br />
over 20 metres on the eastern side, exposing several large wrecks, while on the<br />
western side over 20 metres of sediment has built up, with the bank encroaching into<br />
Trinity Bay by up to 1,000 metres. Within the bank system itself, the banks and<br />
channels have generally moved in a southeast direction since last surveyed.<br />
1.7 Due to the large scale changes that have occurred, an urgent New Edition of chart<br />
1828 is being produced in lieu of Notice to Mariner action. In advance of the New<br />
Edition, Trinity House marked the limit of the bank in Trinity bay with a temporary west<br />
cardinal buoy.<br />
Reasons for Continuing to Resurvey the Area<br />
1.8 The <strong>Goodwin</strong> <strong>Sands</strong> are generally avoided by shipping, but there is an ongoing<br />
requirement for re-surveying:<br />
• Gull Stream, although a relatively stable channel, borders the northwest side of<br />
the bank system and the limits of the bank require re-surveying to capture<br />
changes;<br />
• The south and west extents of the bank are buoyed and resurveying of these<br />
outer limits is required;<br />
• The northern end of the bank is crossed by Ramsgate ferry traffic and changes<br />
in depth require monitoring;<br />
Assessment <strong>Goodwin</strong> <strong>Sands</strong>/2009 – Original Page 5 of 51
• The full bank system requires re-surveying on a less frequent basis to ensure<br />
the chart gives a depiction of the banks and channels which bears some<br />
resemblance to their likely configuration, although the highly changeable nature<br />
of the banks and limited use of the area supports less frequent surveying.<br />
Recommendations<br />
1.9 The changes that have occurred necessitate a revision to the area limits, with the<br />
introduction of more frequent surveying in the form of check surveys in some areas.<br />
The proposed new scheme is shown at Annex S.<br />
1.10 <strong>GS1</strong> (South Sand Head): The 3-year resurvey frequency should be retained, but with<br />
the limits revised.<br />
1.11 GS2 (Gull Stream): The 3-year focused survey should be retained, with minor changes<br />
to the limits.<br />
The full 6-year survey should be retained, although a second multibeam survey may<br />
support a reduction in limits or decrease in frequency.<br />
North Sand head shows some shoaling and, given the density of ferry traffic, a 3-year<br />
focused survey should be introduced to cover the area.<br />
1.12 GS3 (North Head of South Calliper): The 3-year resurvey frequency should be retained,<br />
but with the limits reduced.<br />
1.13 GS4 (<strong>Goodwin</strong> <strong>Sands</strong> Inner Area): The 12-year resurvey frequency should be retained,<br />
but with the introduction of a 3-year checkline survey to cover South Calliper and a 6-<br />
year checkline survey to cover the eastern side of <strong>Goodwin</strong> Knoll.<br />
2. INTRODUCTION<br />
2.1 This Assessment is produced by the <strong>United</strong> <strong>Kingdom</strong> <strong>Hydrographic</strong> <strong>Office</strong> (UKHO), on<br />
behalf of the Ministry of Defence (MOD), for the Maritime and Coastguard Agency<br />
(MCA), on behalf of the Department for Transport (DfT).<br />
2.2 The Assessment is funded as part of the Civil Hydrography Programme (CHP) and is<br />
governed by a Memorandum of Understanding between the DfT (including the MCA)<br />
and the MOD (including the UKHO).<br />
3. HISTORY<br />
3.1 The <strong>Goodwin</strong> <strong>Sands</strong> have been surveyed numerous times, going right back to 1795.<br />
They were last surveyed as a complete area in 1997 (with a small area initially covered<br />
by checklines resurveyed in 1998).<br />
3.2 The four re-survey areas cover 37 square Nautical Miles. These are broadly similar to<br />
those in place at the time of the 1997 survey, but analysis of that survey resulted in<br />
the following two changes. Three areas covering the Gull Stream were merged into a<br />
single area (this has subsequently been revised further to include a focused area). The<br />
survey frequency of the largest area, covering the inner banks, was extended from 6 to<br />
12 years.<br />
3.3 Details of the areas including the survey history are at Annexes A-1 to A-4. The limits<br />
of the areas are shown at Annex B.<br />
Assessment <strong>Goodwin</strong> <strong>Sands</strong>/2009 – Original Page 6 of 51
3.4 The history and long term evolution of the bank system was reported on in detail by<br />
R.L. Cloet in 1954.<br />
4. DESCRIPTION OF THE AREA<br />
4.1 <strong>Goodwin</strong> <strong>Sands</strong> comprises of a complex and dynamic system of banks incised by<br />
relatively deep ebb and flood channels. Sandwaves overlie the banks, with notable<br />
sandwave fields at the northern ends of them. The general form of the bank is shown<br />
in Annex C.<br />
4.2 The Gull Stream to the west is less dynamic, with thinly covered or exposed shoal<br />
ledges and ridges within the channel but sandwaves present at both ends.<br />
5. SHIPPING IN THE AREA<br />
5.1 The shoal and changing banks of the <strong>Goodwin</strong> <strong>Sands</strong> are generally avoided by shipping.<br />
Most pass well to the east but, where draught permits, some choose to use the inshore<br />
buoyed route of Gull Stream. Sample data shows vessels up to 7.3 metres using the<br />
route, and an estimated annual usage of about 900 vessels. While most vessels keep<br />
to the buoyed channel, in the north some leave the channel when not constrained by<br />
draught, as shown in Annex D.<br />
5.2 Ramsgate to Ostend ferry traffic, drawing up to 5.3 metres, passes across the northern<br />
part of North Sand head. A Ramsgate to Boulogne high speed ferry service is being<br />
introduced, with four crossings a day passing through the Gull Stream or, depending<br />
upon weather conditions and state of the tide, east of the <strong>Goodwin</strong> <strong>Sands</strong>. Trinity Bay<br />
and The Downs, lying between the <strong>Goodwin</strong> <strong>Sands</strong> and Kent coast, provides a waiting<br />
area for ferry traffic in the event of the Port of Dover being closed and sheltered<br />
anchorage for large draught vessels.<br />
6. 1997 SURVEY DETAILS<br />
6.1 A survey of all areas was conducted from 19 May to 24 June. Prior to surveying, sea<br />
conditions were moderate with south-westerly winds, however, during the surveying<br />
period sea states and wind directions varied considerable.<br />
6.2 Sounding lines were run at 62.5 metre intervals in the direction of 031°/211°.<br />
Positioning was by DGPS and the survey referred to OS(SN)80 Datum, meeting the<br />
requirement for a horizontal accuracy of better than 13 metres (2 sigma). The<br />
assessed accuracy of depth measurements was +/-0.36 metres (2 sigma). The survey<br />
data was processed at a scale of 1:25,000.<br />
7. 2003 SURVEY DETAILS<br />
7.1 The survey of areas GS2 and GS3 was conducted from 22 April to 11 May. Prior to<br />
surveying, a deep depression transited the <strong>United</strong> <strong>Kingdom</strong> with winds up to 30 knots,<br />
the strongest of which came from the west and southwest.<br />
7.2 Sounding lines were run at 62.5 metre intervals, in the direction of 037°/217° in area<br />
GS2 and 032°/212° in area GS3. Positioning was by DGPS and the survey referred to<br />
the current equivalent of the World Geodetic System 1984 (WGS 84) Datum for<br />
Europe, the European Terrestrial Reference System (ETRS 89) Datum. The survey<br />
meets the requirement for a horizontal accuracy of better than ±5 metres (2 sigma).<br />
Assessment <strong>Goodwin</strong> <strong>Sands</strong>/2009 – Original Page 7 of 51
7.3 The assessed accuracy of depth measurements was +/-0.38 metres (2 sigma) and met<br />
the required standard. The survey data was processed at a scale of 1:25,000.<br />
8. 2006 SURVEY DETAILS<br />
8.1 The survey of areas <strong>GS1</strong> and GS2 (focused) was conducted from 2 to 10 September.<br />
Weather in the area was initially poor and on 6 September deteriorated, with the vessel<br />
breaking off surveying. The weather had improved enough by 10 September to<br />
complete the survey.<br />
8.2 Survey data was acquired using a Kongsberg 3002D multibeam echosounder system.<br />
8.3 The Primary Reference Position was provided by Applanix POS MV systems, supplied<br />
with GPS data from a Real Time Kinematic (RTK) system, using GPS carrier phase<br />
measurements observed at an installed Geodetic Control Station in Margate. The<br />
survey met the accuracy requirements for an IHO Order 1 survey.<br />
8.4 The shallowest part of <strong>GS1</strong>, with depths of less than 5 metres, was surveyed at the end<br />
of the survey period, following a 4 day break in operations. Where these lines overlap<br />
with those run 5 days earlier, there is a significant change in the shape of the bank.<br />
The profile below shows the extent of change that occurred between 5 and 10<br />
September, with over 2 metres of sediment accumulating and a steep southern slope<br />
forming (Figure 5.1).<br />
2 m<br />
80 m<br />
South<br />
Figure 5.1: Survey line cross-sections (Blue 5 Sept, Red 10 Sept)<br />
North<br />
8.5 Examination of WaveNet data for Hastings and West Gabbard shows increased<br />
significant wave heights during the period, with wave heights exceeding 2 metres at<br />
both sites. Over the course of a year, these wave heights are not exceptional and it is<br />
likely that over the shallowest part of the bank sediments are regularly reworked with<br />
changes in wave energy, direction and tidal factors.<br />
9. 2009 SURVEY DETAILS<br />
9.1 The four <strong>Goodwin</strong> <strong>Sands</strong> areas were surveyed from 23 July to 1 September, in<br />
conjunction with four Dover Strait areas. Weather in the area was generally good<br />
throughout the survey period, with slight to smooth sea states. Survey work was<br />
undertaken by two vessels, surveying in the <strong>Goodwin</strong> <strong>Sands</strong> areas for 16 and 25 days<br />
each.<br />
9.2 South Calliper had extended outside the established survey limits (with the 10 metre<br />
contour migrating up to 1,000 metres), although the survey work was not adjusted at<br />
Assessment <strong>Goodwin</strong> <strong>Sands</strong>/2009 – Original Page 8 of 51
the time to cover this. Because of this, the surveyor was requested to run additional<br />
lines to delimit the bank, which were run in March 2010.<br />
9.3 The survey was conducted using dual head Kongsberg Maritime EM3002D multibeam<br />
echosounders. The survey achieved IHO S44 Order 1a standard and obtained 100%<br />
seafloor cover up to the 2 metre contour. This has left three large area of shallower<br />
water unsurveyed.<br />
9.4 Positioning was by Applanix POS/MV, combining GPS and inertial Measurement Unit<br />
data to produce the navigation solution. The survey is referred to the ITRF2000<br />
Datum.<br />
9.5 Depths were reduced to Chart Datum using GPS heights, with ellipsoidal height to chart<br />
datum separation values taken from the Vertical Offshore Reference Framework<br />
(VORF).<br />
9.6 The survey overlaid on chart 1828 is shown at Annex E.<br />
10. DESCRIPTION OF RECENT BATHYMETRIC CHANGE<br />
10.1 Colour banded depth plots of the 1997 and 2009 surveys are at Annexes G-1 and G-2.<br />
A variability plot showing the depth differences between the 1997 and 2009 surveys is<br />
at Annex H. The variability plot shows the large changes to the banks since the area<br />
was last fully surveyed.<br />
10.2 Comparison plots of the 2, 5, 10 and 15 metre contours from the 1997 and 2009<br />
surveys are at Annexes I-1 to I-4.<br />
10.3 Colour banded depth plots, variability plots and contour comparisons are at Annexes J<br />
to R for areas <strong>GS1</strong>, GS2 and GS3, to examine the changes since the previous survey of<br />
those areas.<br />
<strong>GS1</strong> South Sand Head<br />
10.4 Colour banded depth plots of the 2006 and 2009 surveys are at Annexes J-1 and J-2.<br />
A variability plot showing the depth differences between the 2006 and 2009 surveys is<br />
at Annex K.<br />
10.5 Comparison plots of the 5, 10 and 15 metre contours from the 2006 and 2009 surveys<br />
are at Annexes L-1, L-2 and L-3.<br />
10.6 Changes that have occurred to South Sand Head are broadly similar to those observed<br />
in the previous assessment of the area, when the 2003 and 2006 surveys were<br />
examined.<br />
10.7 In the north of the area, the bank has migrated north-westwards, with the greatest<br />
change occurring over the top of the bank, as shown in cross-section A-B at Annex F.<br />
10.8 At the southern end, a new limb is forming to the east of a previous one. The result of<br />
this is that, along the new limb, the 10 metre contour has extended 340 metres southwestwards<br />
since 2006 (as shown in Annex L-2). The longer term changes over the last<br />
12 years are shown in figure 10.1.<br />
Assessment <strong>Goodwin</strong> <strong>Sands</strong>/2009 – Original Page 9 of 51
10<br />
10<br />
20<br />
20<br />
Figure 10.1: 10 & 20 metre contours and limb axis 1997 (Blue) diminishing and 2009 (Red)<br />
developing<br />
10.9 Depths at South West <strong>Goodwin</strong> buoy have shoaled by 2 metres and the buoy, which<br />
has been moved 1,100 metres north-eastwards since the 2006 survey, now sits on the<br />
20 metre contour. Depths in this area will shoal further if the new limb continues to<br />
extend.<br />
10.10 The greatest change that has occurred to the southern part of South Calliper is in area<br />
GS4 to the north of South Sand Head. In GS4, there has been extensive movement of<br />
sediment since last surveyed 12 years ago, with depths of over 20 metres in an area<br />
that was previously drying. These changes could have a significant influence on the<br />
long-term development of South Sand Head.<br />
GS2 Gull Stream<br />
10.11 Within Gull Stream itself, the same megaripples are present in both the 2006 and 2009<br />
surveys, highlighting the general stability and absence of short term change.<br />
10.12 There is a noticeable depth offset between the 2006 focused survey and the 2009<br />
multibeam survey, with the new survey being shallower. In sample cross-sections, the<br />
difference is 0.30 metres in the north of the 2006 survey, increasing to 0.57 metres in<br />
the south (see figure 10.2). The surface difference between the 2003 singlebeam and<br />
2009 survey also suggests a shoal offset in the 2009 survey. This is likely to be due to<br />
the difference in tidal reduction methods and this offset needs taking into account<br />
when comparing these surveys.<br />
Assessment <strong>Goodwin</strong> <strong>Sands</strong>/2009 – Original Page 10 of 51
Depth Difference over Stable Area 2006 & 2009<br />
(Mean Difference 0.57 Metres)<br />
Depth (m)<br />
-10.5<br />
-11<br />
-11.5<br />
-12<br />
-12.5<br />
-13<br />
-13.5<br />
-14<br />
-14.5<br />
2006<br />
2009<br />
0 250 500<br />
Distance (m)<br />
Figure 10.2: Depth offset between the 2006 and 2009 surveys (southern area)<br />
10.13 At the southern entrance to the channel, sandwaves have migrated northwards by up<br />
to 100 metres since 2006. The controlling depth within the buoyed entrance in the<br />
2009 survey is 5 4 , which lies close to <strong>Goodwin</strong> Fork buoy. This is notably shallower<br />
than a controlling depth of 6 7 lying to the southwest in the 2003 survey.<br />
10.14 At the northern entrance to the channel, sandwaves have generally migrated northeastwards<br />
slightly since 2003. However, some of the features lying across the channel<br />
are in broadly similar positions to 50 years ago, appearing well established and subject<br />
to little change, although a new minimum depth of 8 2 was found in the channel in the<br />
2009 survey. The northern extent of North Head Sand remains in a broadly similar<br />
position to 30 years ago, but the 5 metre contour has expanded since last surveyed.<br />
10.15 Along the eastern side of the channel, the bank can be considered as having two<br />
distinct characteristics. In the north of the area, North Sand Head appears well defined<br />
and relatively stable, but with expansion occurring over the last 12 years, as shown by<br />
the 5 and 10 metre contours at Annexes I-2 and O-2. To the south of this, extending<br />
in a south-westerly direction from <strong>Goodwin</strong> Knoll, there are several sinuous broken<br />
shoal areas. These areas are subject to large change, as the sediments are reworked<br />
and indentations in the bank form or infill. Much of this change is occurring within the<br />
overall bank limits and there is no strong evidence of a general migration into Gull<br />
Stream. However, between North West <strong>Goodwin</strong> and North <strong>Goodwin</strong> buoys, a bulge in<br />
the bank extends further out into Gull Stream than in the 1997, 2003 and 2006<br />
surveys (see Annexes I-2 and O-1).<br />
10.16 The eastern side of the sinuous shoal areas has generally deepened since surveyed in<br />
1997, resulting in the exposure of a 125 metre long wreck previously charted as a foul<br />
area. This highlights the potential for large features to become exposed by shifting<br />
sediments as shown in figure 10.3.<br />
Assessment <strong>Goodwin</strong> <strong>Sands</strong>/2009 – Original Page 11 of 51
Figure 10.3: Large wreck exposed since 1997 survey<br />
GS3 North Head of South Calliper<br />
10.17 The bank has migrated eastwards by approximately 70 metres and extended northeastwards<br />
by 200 metres since the 2003 survey. This continues the trend seen<br />
between the 1997 and 2003 surveys. The greatest change is to the upper part of the<br />
bank, resulting in an increase in gradient on the eastern side, as shown in profile G-H<br />
at Annex F.<br />
GS4 <strong>Goodwin</strong> <strong>Sands</strong> Inner Area<br />
10.18 The greatest change that has occurred within GS4 has been to South Calliper, where<br />
there has been a significant westward migration of the bank and reworking of<br />
sediments. On the eastern side, large amounts of sediment have been removed,<br />
exposing several large wrecks. In the area of greatest change, depths in excess of 20<br />
metres now exist where areas of drying bank were present in the 1997 survey. On the<br />
western side, the bank has encroached into Trinity Bay by up to 1,000 metres (average<br />
83m/yr), resulting in drying depths in an area where depths of more than 20 metres<br />
were found previously. These changes are best seen in the 5 and 10 metre contours at<br />
Annexes I-2 and I-3. They indicate that the once homogenous area of bank between<br />
North Head of South Calliper and South Sand Head may be reforming into a main<br />
northern area and separate southern area.<br />
10.19 Within the central part of the bank system, the banks and ebb channels have generally<br />
migrated south-eastwards by around 600 metres. <strong>Goodwin</strong> Knoll has also extended<br />
eastwards to the south of North Sand Head, with the 10 metre contour extending<br />
eastwards by up to 350 metres. Shallower water and extending of the bank was<br />
reported by the Ramsgate lifeboat in 2008. The ridge at the southern end of Kellet Gut<br />
has retreated 600 metres.<br />
<strong>Goodwin</strong> <strong>Sands</strong> Long-Term Changes<br />
10.20 Analysis of the <strong>Goodwin</strong> <strong>Sands</strong> and the Brake Bank by R. L. Cloet (1954) considered<br />
the <strong>Goodwin</strong> <strong>Sands</strong> system to have an aerofoil shape. The orientation of the system<br />
from a 1795 survey onwards was examined and showed a trend in rotation towards a<br />
north-south alignment, but with an indication of slowing down in the rate of change.<br />
Assessment <strong>Goodwin</strong> <strong>Sands</strong>/2009 – Original Page 12 of 51
10.21 Updating the figures for the 2009 survey shows that, as a whole, the bank system has<br />
continued the trend towards a more north-south alignment. However, much of this<br />
appears to be due to the eastward migration of South Sand Head and, within the bank<br />
system itself, there is evidence of a clockwise rotation away from a north-south<br />
alignment.<br />
<strong>Goodwin</strong> <strong>Sands</strong> Major Axis Orientation<br />
30<br />
Orientation (degrees)<br />
25<br />
20<br />
15<br />
10<br />
1750 1800 1850 1900 1950 2000<br />
Year<br />
Figure 10.4: Orientation of <strong>Goodwin</strong> <strong>Sands</strong><br />
10.22 Further analysis of the long-term changes prior to the 1997 survey is beyond the scope<br />
and purpose of this report.<br />
11. IMPLICATIONS FOR SHIPPING<br />
11.1 As shown in Annex D, shipping generally avoids the shallowest, most mobile and<br />
potentially treacherous areas of the <strong>Goodwin</strong> <strong>Sands</strong>, keeping well to the east, where<br />
buoyage adequately mark the banks, or using the buoyed inner route of the Gull<br />
Stream. Changes to the western side of the bank are occurring close to the buoyed<br />
route and require monitoring more frequently than the main channel itself, along with<br />
the area of sandwaves at the southern entrance. Ramsgate traffic crossing North Sand<br />
Head would potentially be concerned should depths continue to shoal in the area.<br />
11.2 Vessels are known to use The Downs and Trinity Bay region for shelter; expansion of<br />
South Calliper into Trinity Bay would be of concern to these vessels and the survey<br />
frequency needs to be adequate to capture these changes. Because of the<br />
encroachment into Trinity Bay, and as a precautionary measure, Trinity House installed<br />
a temporary Pillar buoy to mark the current limit of the bank ahead of the publication<br />
of a New Edition of chart 1828.<br />
12. RECOMMENDATIONS FOR FUTURE SURVEYS<br />
<strong>GS1</strong> South Sand Head<br />
12.1 Due to the realignment and development of the southern limit of South Sand Head, the<br />
area should continue to be resurveyed every 3 years. To align with the current position<br />
of the bank, and adequately cover likely developments over the next 3 years, the limits<br />
should be revised, as shown in Annex S.<br />
Assessment <strong>Goodwin</strong> <strong>Sands</strong>/2009 – Original Page 13 of 51
GS2 Gull Stream<br />
12.2 Due to bank mobility on the eastern side of the Gull Stream and sandwave mobility in<br />
the southern entrance, the 3 year focused survey should continue, with minor changes<br />
in limits as shown in Annex S.<br />
12.3 North Sand Head shows evidence of some shoaling. Given the density of ferry traffic<br />
crossing the bank and proximity of depths to maximum draughts, it is recommended<br />
that a 3-year focused survey be introduced to cover the area, as shown in Annex S.<br />
12.4 The full 6 year survey includes the northern entrance and western side of the channel.<br />
Considering the stability of these areas, particularly the western side of the channel, a<br />
reduction in limits or decrease in survey frequency may be possible. However, as the<br />
full area covers the trafficked route through Gull Stream, and has only been fully<br />
surveyed once with multibeam, it is recommended that another survey of the area be<br />
conducted before revising the limits or frequency.<br />
GS3 North Head of South Calliper<br />
12.5 The migration of the bank supports continued surveying of the seaward side every 6<br />
years, as shown in Annex S. Although the bank is likely to be still adequately marked<br />
by East <strong>Goodwin</strong> buoy after that time, a north-easterly extension to the head of 550<br />
metres over the last 12 years justifies not extending the survey period beyond 6 years<br />
at present. The western side, which is deepening and away from the shipping routes,<br />
should be transferred to GS4.<br />
GS4 <strong>Goodwin</strong> <strong>Sands</strong> Inner Area<br />
12.6 Due to the dynamic and shoal nature of the area it is avoided by shipping, although<br />
some recreational and research activities, such as fishing, and wreck monitoring, are<br />
known to take place. Changes are such that, if the 12 year re-survey interval is<br />
retained, depths are likely to have changed notably by the time of the next survey (by<br />
more than 10 metres in some places), with the potential uncovering of wrecks.<br />
However, to capture changes more frequently could be considered disproportionate<br />
considering avoidance of the area by large vessels and need for caution by small craft.<br />
12.7 It is recommended that the 12-year survey interval is retained, but with slight changes<br />
to the overall limits as shown in Annex S. In addition, due to the marked changes in<br />
overall bank extents that have occurred at South Calliper, it is recommended that a 3-<br />
year checkline survey of 250 metre spaced lines be carried out to capture the general<br />
developments in bank limits, as shown in Annex S. The bank limits in the northeastern<br />
part of GS4 should also be surveyed as a 250 metre spaced checkline survey,<br />
but on the intervening 6 years between the full surveys.<br />
Assessment <strong>Goodwin</strong> <strong>Sands</strong>/2009 – Original Page 14 of 51
12.8 The proposed area limits are as follows –<br />
<strong>GS1</strong> (3 yr)<br />
a) 51˚.16100N 1˚.47550E<br />
b) 51˚.15180N 1˚.50900E<br />
c) 51˚.13640N 1˚.48200E<br />
d) 51˚.14250N 1˚.46330E<br />
GS2 (focused Gull Stream 3 yr)<br />
a) 51˚.30583N 1˚.50350E<br />
b) 51˚.30583N 1˚.52000E<br />
c) 51˚.29714N 1˚.50579E<br />
d) 51˚.27625N 1˚.47800E<br />
e) 51˚.26000N 1˚.46000E<br />
f) 51˚.23420N 1˚.44520E<br />
g) 51˚.23667N 1˚.43000E<br />
h) 51˚.26067N 1˚.45150E<br />
i) 51˚.29583N 1˚.48883E<br />
GS2 (focused North Sand Head 3 yr)<br />
a) 51˚.33333N 1˚.53600E<br />
b) 51˚.33333N 1˚.55000E<br />
c) 51˚.31960N 1˚.55250E<br />
d) 51˚.31960N 1˚.53600E<br />
GS2 (full 6 yr)<br />
a) 51˚.34167N 1˚.51167E<br />
b) 51˚.34167N 1˚.54833E<br />
c) 51˚.31960N 1˚.55250E<br />
d) 51˚.31960N 1˚.54300E<br />
e) 51˚.29000N 1˚.50000E<br />
f) 51˚.25250N 1˚.46000E<br />
g) 51˚.23333N 1˚.45067E<br />
h) 51˚.23667N 1˚.43000E<br />
i) 51˚.26333N 1˚.44333E<br />
j) 51˚.32333N 1˚.51167E<br />
GS3 (6 yr)<br />
a) 51˚.27825N 1˚.57950E<br />
b) 51˚.27825N 1˚.58869E<br />
c) 51˚.25690N 1˚.59000E<br />
d) 51˚.24090N 1˚.58415E<br />
e) 51˚.24090N 1˚.57950E<br />
Assessment <strong>Goodwin</strong> <strong>Sands</strong>/2009 – Original Page 15 of 51
GS4 (full 12 yr)<br />
a) 51˚.31960N 1˚.55250E<br />
b) 51˚.27825N 1˚.57300E<br />
c) 51˚.27825N 1˚.57950E<br />
d) 51˚.24090N 1˚.57950E<br />
e) 51˚.24090N 1˚.58415E<br />
f) 51˚.21600N 1˚.57300E<br />
g) 51˚.18570N 1˚.53600E<br />
h) 51˚.15180N 1˚.50900E<br />
i) 51˚.16100N 1˚.47550E<br />
j) 51˚.19400N 1˚.47670E<br />
k) 51˚.21180N 1˚.49120E<br />
l) 51˚.21720N 1˚.47500E<br />
m) 51˚.25275N 1˚.49300E<br />
n) 51˚.25680N 1˚.48080E<br />
o) 51˚.23333N 1˚.45067E<br />
p) 51˚.25250N 1˚.46000E<br />
q) 51˚.29000N 1˚.50000E<br />
r) 51˚.31960N 1˚.54300E<br />
GS4 (focused South Calliper 3 yr)<br />
a) 51˚.24090N 1˚.57950E<br />
b) 51˚.24090N 1˚.58415E<br />
c) 51˚.21600N 1˚.57300E<br />
d) 51˚.18570N 1˚.53600E<br />
e) 51˚.15180N 1˚.50900E<br />
f) 51˚.16100N 1˚.47550E<br />
g) 51˚.19400N 1˚.47670E<br />
h) 51˚.21180N 1˚.49120E<br />
i) 51˚.21720N 1˚.47500E<br />
j) 51˚.24000N 1˚.48650E<br />
k) 51˚.24000N 1˚.50000E<br />
l) 51˚.21600N 1˚.50000E<br />
m) 51˚.20000N 1˚.51300E<br />
n) 51˚.20000N 1˚.53250E<br />
o) 51˚.21600N 1˚.56000E<br />
GS4 (focused <strong>Goodwin</strong> Knoll 3 yr)<br />
a) 51˚.31960N 1˚.55250E<br />
b) 51˚.27825N 1˚.57300E<br />
c) 51˚.27825N 1˚.57950E<br />
d) 51˚.27050N 1˚.57950E<br />
e) 51˚.27050N 1˚.55300E<br />
f) 51˚.31960N 1˚.54300E<br />
Assessment <strong>Goodwin</strong> <strong>Sands</strong>/2009 – Original Page 16 of 51
13. REFERENCES<br />
13.1 Cloet R. L. 1954: <strong>Hydrographic</strong> Analysis of the <strong>Goodwin</strong> <strong>Sands</strong> and the Brake Bank<br />
13.2 <strong>United</strong> <strong>Kingdom</strong> <strong>Hydrographic</strong> <strong>Office</strong>, 1986: Report on the Analysis of Resurvey Area C1<br />
13.3 <strong>United</strong> <strong>Kingdom</strong> <strong>Hydrographic</strong> <strong>Office</strong>, 1997: Report of Survey, <strong>Goodwin</strong> <strong>Sands</strong><br />
13.4 <strong>United</strong> <strong>Kingdom</strong> <strong>Hydrographic</strong> <strong>Office</strong>, 1999: The <strong>Goodwin</strong> <strong>Sands</strong> - Report on the<br />
Analysis of Routine Resurvey Areas A, b, C, C1, C2 & C3<br />
13.5 <strong>United</strong> <strong>Kingdom</strong> <strong>Hydrographic</strong> <strong>Office</strong>, 2003: Report of Survey, Gull Stream & North<br />
Head of South Calliper<br />
13.6 <strong>United</strong> <strong>Kingdom</strong> <strong>Hydrographic</strong> <strong>Office</strong>, 2006: Report of Survey, Gull Stream & South<br />
Sand Head<br />
13.7 <strong>United</strong> <strong>Kingdom</strong> <strong>Hydrographic</strong> <strong>Office</strong>, 2010: Report of Survey, <strong>Goodwin</strong> <strong>Sands</strong> 2009<br />
Assessment <strong>Goodwin</strong> <strong>Sands</strong>/2009 – Original Page 17 of 51
ANNEX A-1<br />
AREA SPECIFICATIONS<br />
(Including Survey History)<br />
REGION: <strong>Goodwin</strong> <strong>Sands</strong> NAME: South Sand Head AREA: <strong>GS1</strong><br />
LIMITS:<br />
AREA SIZE:<br />
a) 51°09.78 N 1°31.20 E<br />
b) 51°08.43 N 1°29.80 E<br />
c) 51°08.23 N 1°27.60 E<br />
d) 51°10.23 N 1°28.90 E<br />
2.78 SQ NM (9.54 SQ KM)<br />
Area co-ordinates are<br />
referred to WGS84 Datum<br />
SURVEY INTERVAL: 3 yrs<br />
SURVEY SCALE: 1:25,000 unless otherwise indicated (not applicable to multibeam survey).<br />
SURVEYS: 1975 K7392 H4577/73<br />
1976 K7646 H4845/75<br />
1977 K7742 H1934/76<br />
1978 K8003 H1962/77<br />
1979 K8222 H1937/78<br />
1980 K8552 H1938/78<br />
1981 K8629 H1951/80 s.t.<br />
1985 K9655 H2342/84 s.<br />
1988 M1266 H6343/87 s.t.d.<br />
1991 M1777 HH090/511/01 s.t.d<br />
1994 M2308 HH090/630/01 s.d<br />
1997 M2902 HH090/737/01 s.t.d.<br />
2000 M3448 HH090/893/01 s.d.<br />
2003 M3930 HH090/1027/01 s.d.<br />
2006 M4566 - m<br />
2009 SDRA200929529 m<br />
REPORTS: 1980 Latest survey included K8222 (H1934/76)<br />
1981 Latest survey included K8629 (H1934/81)<br />
1999 Latest survey included M2902 (HA145/010/019/01)<br />
ASSESSMENTS: 2002 Assessment of the 2000 Survey<br />
2004 Assessment of the 2003 Survey<br />
REMARKS: 1976 Report covering old area B (H1934/76)<br />
1980 New Area B established (HA3913/80)<br />
1999 Report changes area limits and identifier to <strong>GS1</strong>.<br />
LARGEST SCALE CHART: BA 1828 (1:37,500)<br />
KEY: s sonar sweep<br />
t bottom texture tracing<br />
d digital data available<br />
m multibeam digital data<br />
Assessment <strong>Goodwin</strong> <strong>Sands</strong>/2009 – Original Page 18 of 51
AREA SPECIFICATIONS<br />
(Including Survey History)<br />
ANNEX A-2<br />
REGION: <strong>Goodwin</strong> <strong>Sands</strong> NAME: Gull Stream AREA: GS2<br />
LIMITS: Full a) 51°20’.5N 01°30’.7E Focused a) 51°18’.3N 01°30’.2E<br />
b) 51°20’.5N 01°32’.9E b) 51°17’.5N 01°29’.9E<br />
c) 51°19’.6N 01°33’.2E c) 51°15’.5N 01°27’.7E<br />
d) 51°15’.4N 01°28’.3E d) 51°14’.1N 01°26’.7E<br />
e) 51°14’.0N 01°27’.4E e) 51°14’.1N 01°26’.1E<br />
f ) 51°14’.2N 01°25’.8E<br />
f) 51°15’.6N 01°27’.1E<br />
g) 51°15’.8N 01°26’.6E g) 51°17’.7N 01°29’.3E<br />
h) 51°19’.4N 01°30’.7E h) 51°18’.3N 01°30’.2E<br />
AREA SIZE:<br />
8.46 SQ NM (28.8 SQ KM) / 1.88 SQ NM (6.5 SQ KM)<br />
SURVEY INTERVAL: Full Area 6 yrs, Focused Area 3 yrs<br />
SURVEY SCALE: 1:25,000<br />
Area co-ordinates are<br />
referred to ETRS 89 Datum<br />
SURVEYS: 1979 K8237 H1937/78<br />
1980 K8552 H1938/78<br />
1981 K8629 H1951/80 s.t.<br />
1983 K9179 H3650/78<br />
1984 K9564 H2907/83 s.t.<br />
1985 K9883 H2331/85 s.t.<br />
1988 M1263 H6342/87 s.t.d.<br />
1991 M1777 HH090/511/01 s.t.d<br />
1994 M2287 HH090/629/01 s.d.<br />
1997 M2864 HH090/736/01 s.t.d.<br />
1997 M2865 HH090/738/01 s.t.d<br />
1997 M2882 HH090/738/01 s.t.d<br />
2000 M3432 HH090/892/01 s.t.d<br />
2003 M3936 HH090/1028/01 s.t.d<br />
2006 M4586 HH090/1028/01 m<br />
2009 SDRA200929529 m<br />
REPORTS 1980 Latest survey included K8237 (H3650/78).<br />
1981 Latest survey included K8629 (H3650/78).<br />
1985 Latest survey included K9564 (H0423/85).<br />
1986 Latest survey included K8552 (H0423/85).<br />
1999 Latest survey included M2864 (HA145/010/019/01)<br />
ASSESSMENTS: 2001 Assessment of 2000 survey (M3432)<br />
2004 Assessment of 2003 survey (M3936)<br />
REMARKS:<br />
1980 Area A established. Old area A (H3913/80)<br />
1980 Area C1 established. Part of old area C (H3913/80)<br />
1980 Area C2 established. Part of old area C (H3913/80)<br />
1999 Report amalgamates A, C1 & C2 into one area GS2 (limits altered)<br />
2001 GS2 limits altered, also affects GS4, see Assessment March 2001<br />
2004 Full area re-survey frequency extended from 3 yrs to 6 yrs; focused 3 yr area created<br />
LARGEST SCALE CHART: BA 1828 (1:37,500)<br />
BA 1827 (1:12,500) – northern part of area only<br />
KEY: s sonar sweep<br />
t bottom texture tracing<br />
d<br />
m<br />
digital data available<br />
multibeam<br />
Assessment <strong>Goodwin</strong> <strong>Sands</strong>/2009 – Original Page 19 of 51
ANNEX A-3<br />
AREA SPECIFICATIONS<br />
(Including Survey History)<br />
REGION: <strong>Goodwin</strong> <strong>Sands</strong> NAME: North Head of South Calliper AREA: GS3<br />
LIMITS:<br />
AREA SIZE:<br />
a) 51°16’.63 N 1°35’.20 E<br />
b) 51°15’.93 N 1°35’.60 E<br />
c) 51°14’.43 N 1°35’.20 E<br />
d) 51°14’.73 N 1°33’.50 E<br />
e) 51°16’.03 N 1°33’.50 E<br />
2.14 SQ NM (7.34 SQ KM)<br />
Area co-ordinates are<br />
referred to ETRS89 Datum<br />
SURVEY INTERVAL: 6 yrs NEXT SURVEY DUE: 2009<br />
Note: Survey brought forward to coincide with <strong>GS1</strong> & GS2 surveys in 2003.<br />
SURVEY SCALE: 1:25,000 unless otherwise indicated<br />
PREVIOUS SURVEYS: 1980 K8552 H1938/78<br />
1986 K9866 H2333/85 s.t.<br />
1991 M1777 HH090/511/01 s.d.t<br />
1997 M2866 HH090/741/01 s.d.c<br />
1998 M3054 HH090/820/01 s.d.t<br />
2003 M3935 HH090/1029/01 s.d.t<br />
2009 SDRA200929529 m<br />
REPORTS: 1986 Latest survey included K8552 (H0423/86)<br />
1999 Latest survey included M3054 (HA145/010/019/01)<br />
ASSESSMENTS: none<br />
REMARKS: 1980 Area C3 established. Part of old area C (H3913/80).<br />
1999 Report changed area limits and identifier from C3 to GS3<br />
LARGEST SCALE CHART: BA 1828 (1:37,500)<br />
KEY: s sonar sweep<br />
t bottom texture tracing<br />
d digital data available<br />
c checklines<br />
Assessment <strong>Goodwin</strong> <strong>Sands</strong>/2009 – Original Page 20 of 51
ANNEX A-4<br />
AREA SPECIFICATIONS<br />
(Including Survey History)<br />
REGION: <strong>Goodwin</strong> <strong>Sands</strong> NAME: <strong>Goodwin</strong> <strong>Sands</strong> AREA: GS4<br />
LIMITS:<br />
AREA SIZE:<br />
a) 51°19’.60 N 1°33.20 E<br />
b) 51°18’.53 N 1°34.05 E<br />
c) 51°16’.63 N 1°35.20 E<br />
d) 51°16’.03 N 1°33.50 E<br />
e) 51°14’.73 N 1°33.50 E<br />
f ) 51°14’.43 N 1°35.20 E<br />
g) 51°12’.78 N 1°34.60 E<br />
h) 51°09’.78 N 1°31.20 E<br />
i ) 51°10’.23 N 1°28.90 E<br />
j ) 51°12’.43 N 1°30.30 E<br />
k) 51°13’.03 N 1°28.50 E<br />
l ) 51°14’.53 N 1°29.60 E<br />
m) 51°15’.00 N 1°28.04 E<br />
n) 51°15’.40 N 1°28.30 E<br />
23.07 SQ NM (79.13 SQ KM)<br />
Area co-ordinates are<br />
referred to ETRS89 Datum<br />
SURVEY INTERVAL: 12 yrs NEXT SURVEY DUE: 2009<br />
SURVEY SCALE: 1:25,000 unless otherwise indicated<br />
PREVIOUS SURVEYS: 1980 K8552 H1938/78<br />
1990 M1655 HH090/511/01 s.d.<br />
1991 M1777 HH090/511/01 s.t.d<br />
1997 M2865 HH090/738/01 s.t.d<br />
2003* M3930 HH090/1027/01 s.d<br />
2009 SDRA200929529 m<br />
* Check lines run over South Calliper bank (on eastern side of the area)<br />
REPORTS: 1984 Latest survey included K8552 (no reference).<br />
1999 Latest survey included M2865 (HA145/010/019/01).<br />
ASSESSMENTS: none<br />
REMARKS: 1980 Area C established. Part of old area C (HA3913/80).<br />
1999 Area limits altered. Identifier changed to GS4.<br />
LARGEST SCALE CHART: BA 1828 (1:37,500)<br />
KEY: s sonar sweep<br />
t bottom texture tracing<br />
d digital data available<br />
Assessment <strong>Goodwin</strong> <strong>Sands</strong>/2009 – Original Page 21 of 51
ANNEX B<br />
GOODWIN SANDS RESURVEY SCHEME<br />
GS2<br />
(3/6 yrs)<br />
2003 (Full)<br />
2006 (Focused)<br />
GS3<br />
(6 yr)<br />
2003<br />
GS4<br />
(12 yr)<br />
1997<br />
<strong>GS1</strong><br />
(3 yr)<br />
2006<br />
_________ Full Survey Limits<br />
- - - - - Focused Survey Limits<br />
Details show area identifier,<br />
survey frequency and year of<br />
previous survey<br />
Assessment <strong>Goodwin</strong> <strong>Sands</strong>/2009 – Original Page 22 of 51
ANNEX C<br />
SUN-ILLUMINATED VIEW OF THE 2009 SURVEY<br />
SHOWING BANK AND CHANNEL MIGRATION<br />
∆<br />
∆<br />
∆<br />
∆<br />
∆<br />
Area of significant<br />
sediment removal<br />
∆ Steepest side in areas of<br />
asymmetric banks<br />
Assessment <strong>Goodwin</strong> <strong>Sands</strong>/2009 – Original Page 23 of 51
ANNEX D<br />
SHIPPING ROUTES<br />
Main shipping routes<br />
Other routes (representative tracks)<br />
Assessment <strong>Goodwin</strong> <strong>Sands</strong>/2009 – Original Page 24 of 51
SUN-ILLUMINATED VIEW OF THE 2009 SURVEY AND<br />
LOCATION OF CROSS-SECTIONS SHOWN AT ANNEX F<br />
ANNEX E<br />
E<br />
G<br />
H<br />
F<br />
C<br />
D<br />
A<br />
B<br />
Assessment <strong>Goodwin</strong> <strong>Sands</strong>/2009 – Original Page 25 of 51
ANNEX F<br />
SURVEY CROSS-SECTIONS<br />
(see Annex E for locations)<br />
<strong>GS1</strong>: South Sand Head<br />
Depth (m)<br />
5<br />
0<br />
-5<br />
-10<br />
-15<br />
-20<br />
-25<br />
-30<br />
2006<br />
2009<br />
0 1000 2000 3000<br />
Distance (m)<br />
A Profile A – B B<br />
Depth (m)<br />
5<br />
0<br />
-5<br />
-10<br />
-15<br />
-20<br />
-25<br />
-30<br />
GS4: South Calliper<br />
0 1000 2000 3000 4000<br />
Distance (m)<br />
1997<br />
2009<br />
C Profile C – D D<br />
Assessment <strong>Goodwin</strong> <strong>Sands</strong>/2009 – Original Page 26 of 51
GS4: <strong>Goodwin</strong> <strong>Sands</strong><br />
Depth (m)<br />
10<br />
0<br />
-10<br />
-20<br />
-30<br />
-40<br />
1997<br />
2009<br />
Kellet<br />
Gut<br />
0 1000 2000 3000 4000 5000 6000 7000 8000 9000 10000 11000 12000<br />
Distance (m)<br />
E Profile E – F F<br />
GS3: North Head of South Calliper<br />
Depth (m)<br />
0<br />
-5<br />
-10<br />
-15<br />
-20<br />
1997<br />
2003<br />
2009<br />
-25<br />
-30<br />
0 500 1000 1500<br />
Distance (m)<br />
G Profile G – H H<br />
Assessment <strong>Goodwin</strong> <strong>Sands</strong>/2009 – Original Page 27 of 51
ANNEX G-1<br />
COLOUR BANDED DEPTH PLOT<br />
FROM THE 1997 SURVEY<br />
SHOWING SELECTED DEPTHS<br />
Scale 1:75,000<br />
Selected depth comparisons<br />
Depths in Metres<br />
Drying Heights<br />
0.1 to 5.0<br />
5.1 to 10.0<br />
10.1 to 40.0<br />
Metres 2000<br />
1000<br />
0<br />
2000<br />
4000<br />
6000 Metres<br />
Assessment <strong>Goodwin</strong> <strong>Sands</strong>/2009 – Original Page 28 of 20
ANNEX G-2<br />
COLOUR BANDED DEPTH PLOT<br />
FROM THE 2009 SURVEY<br />
SHOWING SELECTED DEPTHS<br />
SCALE 1:75,000<br />
Selected depth comparisons<br />
Depths in Metres<br />
Drying Heights<br />
0.1 to 5.0<br />
5.1 to 10.0<br />
10.1 to 40.0<br />
Metres 2000<br />
1000<br />
0<br />
2000<br />
4000<br />
6000 Metres<br />
Assessment <strong>Goodwin</strong> <strong>Sands</strong>/2009 – Original Page 29 of 20
ANNEX H<br />
VARIABILITY PLOT SHOWING BATHYMETRIC CHANGES<br />
BETWEEN THE 1997 AND 2009 SURVEY DATA<br />
AND CHARTED CONTOURS FROM THE 2009 SURVEY<br />
SCALE 1:75,000<br />
22.0<br />
Metres<br />
10.0<br />
3.0<br />
0.5<br />
-0.5<br />
-3.0<br />
-10.0<br />
-27.0<br />
Shoaling Deepening<br />
Metres 2000<br />
1000<br />
0<br />
2000<br />
4000<br />
6000 Metres<br />
Assessment <strong>Goodwin</strong> <strong>Sands</strong>/2009 – Original Page 30 of 20
ANNEX I-1<br />
COMPOSITE DIAGRAM OF THE<br />
2 METRE CONTOUR<br />
FROM THE 1997 AND 2009 SURVEYS<br />
Scale 1:75,000<br />
Year of Survey<br />
_____<br />
2009<br />
_____<br />
1997<br />
Metres 2000<br />
1000<br />
0<br />
2000<br />
4000<br />
6000 Metres<br />
Assessment <strong>Goodwin</strong> <strong>Sands</strong>/2009 – Original Page 31 of 20
ANNEX I-2<br />
COMPOSITE DIAGRAM OF THE<br />
5 METRE CONTOUR<br />
FROM THE 1997 AND 2009 SURVEYS<br />
Scale 75,000<br />
Year of Survey<br />
_____<br />
2009<br />
_____<br />
1997<br />
Metres 2000<br />
1000<br />
0<br />
2000<br />
4000<br />
6000 Metres<br />
Assessment <strong>Goodwin</strong> <strong>Sands</strong>/2009 – Original Page 32 of 20
COMPOSITE DIAGRAM OF THE<br />
10 METRE CONTOUR<br />
FROM THE 1997 AND 2009 SURVEYS<br />
Scale 1:75,000<br />
ANNEX I-3<br />
Year of Survey<br />
_____<br />
2009<br />
_____<br />
1997<br />
Metres 2000<br />
1000<br />
0<br />
2000<br />
4000<br />
6000 Metres<br />
Assessment <strong>Goodwin</strong> <strong>Sands</strong>/2009 – Original Page 33 of 20
ANNEX I-4<br />
COMPOSITE DIAGRAM OF THE<br />
15 METRE CONTOUR<br />
FROM THE 1997 AND 2009 SURVEYS<br />
Scale 1:75,000<br />
Year of Survey<br />
_____<br />
2009<br />
_____<br />
1997<br />
Metres 2000<br />
1000<br />
0<br />
2000<br />
4000<br />
6000 Metres<br />
Assessment <strong>Goodwin</strong> <strong>Sands</strong>/2009 – Original Page 34 of 20
ANNEX J-1<br />
COLOUR BANDED DEPTH PLOT<br />
FROM THE 2006 SURVEY<br />
SHOWING SELECTED DEPTHS<br />
AREA <strong>GS1</strong><br />
Scale 1:30,000<br />
1 9<br />
10<br />
8 2<br />
16 5<br />
Depths in Metres<br />
Drying Heights<br />
0.1 to 5.0<br />
Selected depth comparisons<br />
5.1 to 10.0<br />
10.1 to 40.0<br />
16 5<br />
2009 survey depth<br />
Assessment <strong>Goodwin</strong> <strong>Sands</strong>/2009 – Original
ANNEX J-2<br />
COLOUR BANDED DEPTH PLOT<br />
FROM THE 2009 SURVEY<br />
SHOWING SELECTED DEPTHS<br />
AREA <strong>GS1</strong><br />
Scale 1:30,000<br />
Depths in Metres<br />
Drying Heights<br />
0.1 to 5.0<br />
Selected depth comparisons<br />
5.1 to 10.0<br />
10.1 to 40.0<br />
Assessment <strong>Goodwin</strong> <strong>Sands</strong>/2009 – Original
ANNEX K<br />
VARIABILITY PLOT SHOWING BATHYMETRIC CHANGES<br />
BETWEEN THE 2006 AND 2009 SURVEY DATA<br />
AND CHARTED CONTOURS FROM THE 2009 SURVEY<br />
AREA <strong>GS1</strong><br />
Scale 1:30,000<br />
>5.0<br />
5.0<br />
Metres<br />
3.0<br />
1.5<br />
0.5<br />
-0.5<br />
-1.5<br />
-3.0<br />
-5.0<br />
>-5.0<br />
Shoaling Deepening<br />
Assessment <strong>Goodwin</strong> <strong>Sands</strong>/2009 – Original
ANNEX L-1<br />
COMPOSITE DIAGRAM OF THE<br />
5 METRE CONTOUR<br />
FROM THE 2006 AND 2009 SURVEYS<br />
AREA <strong>GS1</strong><br />
Scale 1:30,000<br />
Year of Survey<br />
_____<br />
2009<br />
_____<br />
2006<br />
Assessment <strong>Goodwin</strong> <strong>Sands</strong>/2009 – Original
ANNEX L-2<br />
COMPOSITE DIAGRAM OF THE<br />
10 METRE CONTOUR<br />
FROM THE 2006 AND 2009 SURVEYS<br />
AREA <strong>GS1</strong><br />
Scale 1:30,000<br />
Year of Survey<br />
_____<br />
2009<br />
_____<br />
2006<br />
Assessment <strong>Goodwin</strong> <strong>Sands</strong>/2009 – Original
ANNEX L-3<br />
COMPOSITE DIAGRAM OF THE<br />
15 METRE CONTOUR<br />
FROM THE 2006 AND 2009 SURVEYS<br />
AREA <strong>GS1</strong><br />
Scale 1:30,000<br />
Year of Survey<br />
_____<br />
2009<br />
_____<br />
2006<br />
Assessment <strong>Goodwin</strong> <strong>Sands</strong>/2009 – Original Page 40 of 51
ANNEX M-1<br />
COLOUR BANDED DEPTH PLOT<br />
FROM THE 2003 SURVEY<br />
SHOWING SELECTED DEPTHS<br />
AREA GS2<br />
Scale 1:60,000<br />
8 7<br />
Selected depth comparisons<br />
5 6<br />
2009 survey depth<br />
5 7<br />
4 9<br />
4 9<br />
0 6<br />
5 4<br />
Depths in Metres<br />
Drying Heights<br />
0.1 to 5.0<br />
5.1 to 10.0<br />
10.1 to 40.0<br />
Assessment <strong>Goodwin</strong> <strong>Sands</strong>/2009 – Original Page 41 of 51
ANNEX M-2<br />
COLOUR BANDED DEPTH PLOT<br />
FROM THE 2009 SURVEY<br />
SHOWING SELECTED DEPTHS<br />
AREA GS2<br />
Scale 1:60,000<br />
Selected depth comparisons<br />
Depths in Metres<br />
Drying Heights<br />
0.1 to 5.0<br />
5.1 to 10.0<br />
10.1 to 40.0<br />
Assessment <strong>Goodwin</strong> <strong>Sands</strong>/2009 – Original Page 42 of 51
ANNEX N<br />
VARIABILITY PLOT SHOWING BATHYMETRIC CHANGES<br />
BETWEEN THE 2003 AND 2009 SURVEY DATA<br />
AND CHARTED CONTOURS FROM THE 2009 SURVEY<br />
AREA GS2<br />
Scale 1:60,000<br />
>5.0<br />
5.0<br />
Metres<br />
3.0<br />
1.5<br />
0.5<br />
-0.5<br />
-1.5<br />
-3.0<br />
-5.0<br />
>-5.0<br />
Shoaling Deepening<br />
Assessment <strong>Goodwin</strong> <strong>Sands</strong>/2009 – Original Page 43 of 51
ANNEX O-1<br />
COMPOSITE DIAGRAM OF THE<br />
5 METRE CONTOUR<br />
FROM THE 2003 AND 2009 SURVEYS<br />
AREA GS2<br />
Scale 1:60,000<br />
Year of Survey<br />
_____<br />
2009<br />
_____<br />
2003<br />
Assessment <strong>Goodwin</strong> <strong>Sands</strong>/2009 – Original Page 44 of 51
ANNEX O-2<br />
COMPOSITE DIAGRAM OF THE<br />
10 METRE CONTOUR<br />
FROM THE 2003 AND 2009 SURVEYS<br />
AREA GS2<br />
Scale 1:60,000<br />
Year of Survey<br />
_____<br />
2009<br />
_____<br />
2003<br />
Assessment <strong>Goodwin</strong> <strong>Sands</strong>/2009 – Original Page 45 of 51
ANNEX P-1<br />
COLOUR BANDED DEPTH PLOT<br />
FROM THE 2003 SURVEY<br />
SHOWING SELECTED DEPTHS<br />
AREA GS3<br />
Scale 1:25,000<br />
8 2<br />
Selected depth comparisons<br />
2009 survey depth<br />
8 2<br />
4 7<br />
Depths in Metres<br />
Drying Heights<br />
0.1 to 5.0<br />
5.1 to 10.0<br />
10.1 to 40.0<br />
Assessment <strong>Goodwin</strong> <strong>Sands</strong>/2009 – Original Page 46 of 51
ANNEX P-2<br />
COLOUR BANDED DEPTH PLOT<br />
FROM THE 2009 SURVEY<br />
SHOWING SELECTED DEPTHS<br />
AREA GS3<br />
Scale 1:25,000<br />
Selected depth comparisons<br />
2 9<br />
2003 survey depth<br />
2 9<br />
Depths in Metres<br />
Drying Heights<br />
0 3<br />
0.1 to 5.0<br />
5.1 to 10.0<br />
10.1 to 40.0<br />
Assessment <strong>Goodwin</strong> <strong>Sands</strong>/2009 – Original Page 47 of 51
ANNEX Q<br />
VARIABILITY PLOT SHOWING BATHYMETRIC CHANGES<br />
BETWEEN THE 2003 AND 2009 SURVEY DATA<br />
AND CHARTED CONTOURS FROM THE 2009 SURVEY<br />
AREA GS3<br />
Scale 1:25,000<br />
>5.0<br />
5.0<br />
Metres<br />
3.0<br />
1.5<br />
0.5<br />
-0.5<br />
-1.5<br />
-3.0<br />
-5.0<br />
>-5.0<br />
Shoaling Deepening<br />
Assessment <strong>Goodwin</strong> <strong>Sands</strong>/2009 – Original Page 48 of 51
ANNEX R-1<br />
COMPOSITE DIAGRAM OF THE<br />
5 METRE CONTOUR<br />
FROM THE 2003 AND 2009 SURVEYS<br />
AREA GS3<br />
Scale 1:25,000<br />
Year of Survey<br />
_____<br />
2009<br />
_____<br />
2003<br />
Assessment <strong>Goodwin</strong> <strong>Sands</strong>/2009 – Original Page 49 of 51
ANNEX R-2<br />
COMPOSITE DIAGRAM OF THE<br />
10 METRE CONTOUR<br />
FROM THE 2003 AND 2009 SURVEYS<br />
AREA GS3<br />
Scale 1:25,000<br />
Year of Survey<br />
_____<br />
2009<br />
_____<br />
2003<br />
Assessment <strong>Goodwin</strong> <strong>Sands</strong>/2009 – Original Page 50 of 51
PROPOSED REVISED LIMITS<br />
ANNEX S<br />
GS2<br />
Focused<br />
(3 Yrs)<br />
GS2<br />
Focused<br />
(3 Yrs)<br />
GS2<br />
(6 Yrs)<br />
GS4<br />
Checkline<br />
(6 Yrs)<br />
GS3<br />
(6 Yrs)<br />
GS4<br />
(12 Yrs)<br />
GS4<br />
Checkline<br />
(3 Yrs)<br />
<strong>GS1</strong><br />
(3 Yrs)<br />
Existing Survey Limits<br />
Proposed Full Survey Limits<br />
- - - - - Focused Survey Limits<br />
….….. Checkline Survey Limits<br />
Assessment <strong>Goodwin</strong> <strong>Sands</strong>/2009 – Original Page 51 of 51