Task Performance Metrics on Liquid Crystal Displays - Computer ...
Task Performance Metrics on Liquid Crystal Displays - Computer ...
Task Performance Metrics on Liquid Crystal Displays - Computer ...
You also want an ePaper? Increase the reach of your titles
YUMPU automatically turns print PDFs into web optimized ePapers that Google loves.
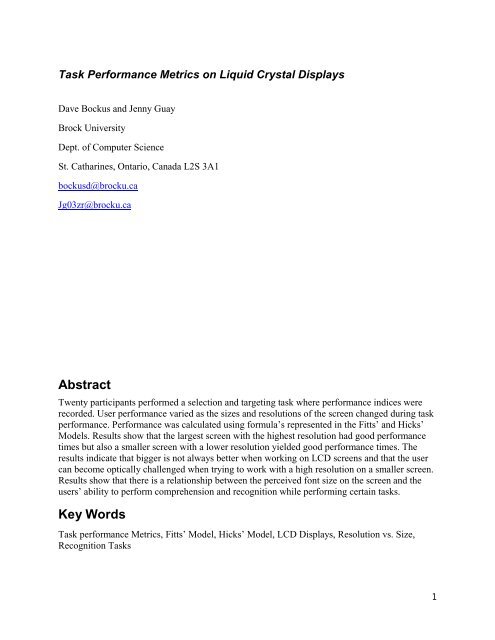
<str<strong>on</strong>g>Task</str<strong>on</strong>g> <str<strong>on</strong>g>Performance</str<strong>on</strong>g> <str<strong>on</strong>g>Metrics</str<strong>on</strong>g> <strong>on</strong> <strong>Liquid</strong> <strong>Crystal</strong> <strong>Displays</strong><br />
Dave Bockus and Jenny Guay<br />
Brock University<br />
Dept. of <strong>Computer</strong> Science<br />
St. Catharines, Ontario, Canada L2S 3A1<br />
bockusd@brocku.ca<br />
Jg03zr@brocku.ca<br />
Abstract<br />
Twenty participants performed a selecti<strong>on</strong> and targeting task where performance indices were<br />
recorded. User performance varied as the sizes and resoluti<strong>on</strong>s of the screen changed during task<br />
performance. <str<strong>on</strong>g>Performance</str<strong>on</strong>g> was calculated using formula’s represented in the Fitts’ and Hicks’<br />
Models. Results show that the largest screen with the highest resoluti<strong>on</strong> had good performance<br />
times but also a smaller screen with a lower resoluti<strong>on</strong> yielded good performance times. The<br />
results indicate that bigger is not always better when working <strong>on</strong> LCD screens and that the user<br />
can become optically challenged when trying to work with a high resoluti<strong>on</strong> <strong>on</strong> a smaller screen.<br />
Results show that there is a relati<strong>on</strong>ship between the perceived f<strong>on</strong>t size <strong>on</strong> the screen and the<br />
users’ ability to perform comprehensi<strong>on</strong> and recogniti<strong>on</strong> while performing certain tasks.<br />
Key Words<br />
<str<strong>on</strong>g>Task</str<strong>on</strong>g> performance <str<strong>on</strong>g>Metrics</str<strong>on</strong>g>, Fitts’ Model, Hicks’ Model, LCD <strong>Displays</strong>, Resoluti<strong>on</strong> vs. Size,<br />
Recogniti<strong>on</strong> <str<strong>on</strong>g>Task</str<strong>on</strong>g>s<br />
1
Dave BOCKUS and Jenny GUAY<br />
Introducti<strong>on</strong><br />
<strong>Liquid</strong> <strong>Crystal</strong> Display (LCD) screens have<br />
replaced the now obsolete CRT M<strong>on</strong>itors. The<br />
introducti<strong>on</strong> of this new display technology<br />
brought about clearer screens with purer<br />
colours and faster resp<strong>on</strong>se times. People<br />
interact with LCD screens <strong>on</strong> a daily basis at<br />
home and in the workplace. Each user has<br />
different settings <strong>on</strong> the screens they use, such<br />
as different resoluti<strong>on</strong>s and sizes. As well they<br />
may sit various distances away from their<br />
screens. In their daily usage of computers<br />
these users will complete various navigati<strong>on</strong>al<br />
and selecti<strong>on</strong>al tasks, each affected by the<br />
view presented by their individual screen<br />
settings. Depending <strong>on</strong> the willingness of the<br />
individual user, the resoluti<strong>on</strong> can be varied to<br />
increase screen real estate, thus providing<br />
more space to perform tasks. This is a known<br />
phenomen<strong>on</strong> <strong>on</strong>ce a user obtains a larger<br />
screen. But does this increased screen size and<br />
higher resoluti<strong>on</strong> truly improve task<br />
efficiency? Using variati<strong>on</strong>s <strong>on</strong> known models<br />
such as Fitts’ Law [12] and Hicks’ Law (Heim<br />
2008), a measure of task performance can be<br />
correlated to the resoluti<strong>on</strong> and screen size.<br />
This will provide a metric in which to set<br />
resoluti<strong>on</strong> with respect to screen size to obtain<br />
optimal task performance.<br />
To test for a correlati<strong>on</strong> between the display<br />
size, resoluti<strong>on</strong> and the task performance,<br />
experimentati<strong>on</strong> using selecti<strong>on</strong> and<br />
navigati<strong>on</strong>al tasks is d<strong>on</strong>e. It is hoped that as<br />
resoluti<strong>on</strong> and screen size are varied, the user<br />
will gravitate to those size and resoluti<strong>on</strong><br />
settings which maximise task performance.<br />
Thus by providing tasks which can be<br />
accurately measured with known metrics,<br />
small discriminati<strong>on</strong>s in task performance can<br />
be measured.<br />
Experimentati<strong>on</strong> will be c<strong>on</strong>trolled to ensure<br />
results are measured with some c<strong>on</strong>fidence,<br />
and that individual nuances and biases do not<br />
skew the results. Participants fill out a short<br />
questi<strong>on</strong>naire to determine eligibility thus<br />
screening out subjects with prec<strong>on</strong>diti<strong>on</strong>s<br />
which can potentially corrupt the study by<br />
affecting independent variables. The tasks that<br />
will be completed are modeled loosely after<br />
Fitts’ and Hicks’ Law. A Fitts’ model is used<br />
to measure simple motor skills when<br />
c<strong>on</strong>fr<strong>on</strong>ted with varying screen size and<br />
resoluti<strong>on</strong>. The task will be a simple targeting<br />
program, measuring the time it takes to select<br />
as the size and resoluti<strong>on</strong> change. A Hicks’<br />
model is used to help determine if screen size<br />
and resoluti<strong>on</strong> affect the ability to perceive<br />
targets for selecti<strong>on</strong>al tasks. The Hick’s task<br />
measures readability and selecti<strong>on</strong>, as the<br />
scale is increased. After the data has been<br />
collected, task performance time is plotted<br />
against the two independent variables, screen<br />
size and resoluti<strong>on</strong>.<br />
Back Ground<br />
There have been many studies d<strong>on</strong>e regarding<br />
task performance <strong>on</strong> a single m<strong>on</strong>itor<br />
compared to multiple; however few have been<br />
d<strong>on</strong>e comparing m<strong>on</strong>itors of slightly different<br />
sizes. A study more applicable to the home<br />
market. Recent research has focused <strong>on</strong> task<br />
performance in virtual envir<strong>on</strong>ments and<br />
using various reading comprehensi<strong>on</strong> tests.<br />
There is a correlati<strong>on</strong> between small m<strong>on</strong>itors<br />
and significantly larger m<strong>on</strong>itors, with the<br />
larger improving task performance in general.<br />
However there are no studies that focus <strong>on</strong><br />
using models, such as Hicks’ and Fitts’ Law<br />
to determine which factors affect task<br />
performance. Hicks’ Law regards decisi<strong>on</strong><br />
time in the c<strong>on</strong>text of selecti<strong>on</strong>, while Fitts’<br />
law is the movement time in navigati<strong>on</strong>al<br />
tasks [9]. When testing Hicks’ Law, a measure<br />
of reacti<strong>on</strong> time should be c<strong>on</strong>sidered against<br />
the number of items that are present. The task<br />
should involve selecting a specific object from<br />
a list, with the list size increasing, after each
Dave BOCKUS and Jenny GUAY<br />
iterati<strong>on</strong>. This being the most pure form of the<br />
model. For Fitts’ law, the movement time is in<br />
a ratio with the distance that was moved. An<br />
appropriate task would be dragging and<br />
dropping an ic<strong>on</strong> <strong>on</strong>to a folder ic<strong>on</strong> [11]. In<br />
this way, the two models have a physical<br />
measure that can be compared [7]. There are<br />
studies that relate physical fields of view to<br />
software fields of view, but the tasks that the<br />
experiments involved are very similar in that<br />
the physical field of view and software field of<br />
view were kept at a 1:1 ratio [2]. In order to<br />
decide how to relate the display size,<br />
resoluti<strong>on</strong> and angle, human visual percepti<strong>on</strong><br />
must be c<strong>on</strong>sidered. Since the tasks in this<br />
experiment were programmed, good design<br />
practices were followed. Each individual’s<br />
percepti<strong>on</strong> is different regarding experience<br />
with brightness, c<strong>on</strong>trast, flicker, moti<strong>on</strong> and<br />
colour, these variables will be kept c<strong>on</strong>stant<br />
[15].<br />
Progressi<strong>on</strong> toward LCD screens opened the<br />
door for new research opportunities in Human<br />
<strong>Computer</strong> Interacti<strong>on</strong>, regarding usability and<br />
percepti<strong>on</strong>. There is recent research that<br />
relates a wider physical field of view to<br />
increased eye hand coordinati<strong>on</strong> and task<br />
performance [3]. The tasks involved in the<br />
research were searching and locomoti<strong>on</strong> tasks,<br />
which effect the completi<strong>on</strong> time because of<br />
the complexity and cognitive activity<br />
involved. The physical field of view is easy to<br />
c<strong>on</strong>trol, but the m<strong>on</strong>itor settings must be taken<br />
into account as a difference in brightness,<br />
c<strong>on</strong>trast, colour, and f<strong>on</strong>t type could<br />
c<strong>on</strong>taminate the results [4]. As well, outside<br />
factors such as visual and mental fatigue can<br />
degrade task performance [16]. Readability<br />
tests were inc<strong>on</strong>clusive if the m<strong>on</strong>itor size and<br />
resoluti<strong>on</strong> had an impact <strong>on</strong> the reading [6].<br />
However, a study testing search speed had<br />
better results, with the speed being faster <strong>on</strong><br />
high resoluti<strong>on</strong> rather then low resoluti<strong>on</strong><br />
[16]. The search speed is more closely related<br />
to Fitts’ law, and indicates that for a<br />
navigati<strong>on</strong> task involving searching, the<br />
bigger m<strong>on</strong>itor with a higher resoluti<strong>on</strong> will<br />
have better results. An ideal way of<br />
representing these results is to plot the<br />
performance data against the shortest<br />
navigati<strong>on</strong> distance. This becomes valid,<br />
because as the display size and resoluti<strong>on</strong><br />
increases, different amounts of navigati<strong>on</strong> will<br />
be required in each task [4]. When designing a<br />
navigati<strong>on</strong> task, the different types of<br />
navigati<strong>on</strong> must be taken into account. The<br />
lower resoluti<strong>on</strong> m<strong>on</strong>itors require more virtual<br />
navigati<strong>on</strong> such as zooming, and the high<br />
resoluti<strong>on</strong> can exceed human perceptual<br />
limitati<strong>on</strong>s and require more physical<br />
navigati<strong>on</strong> [2]. The physical navigati<strong>on</strong> can be<br />
limited by determining the optimum viewing<br />
distance from the user to the m<strong>on</strong>itor. What<br />
must be taken into c<strong>on</strong>siderati<strong>on</strong> is that the<br />
number of pixels <strong>on</strong> a flat screen that can be<br />
resolved by head and eye movement <strong>on</strong>ly<br />
occurs when the user is standing very close to<br />
the m<strong>on</strong>itor and looks left and right. As the<br />
distance from the m<strong>on</strong>itor increases, fewer<br />
pixels can be resolved [1]. In order to<br />
maintain a c<strong>on</strong>stant viewing angle, the<br />
comparis<strong>on</strong> between viewing a projected<br />
display and a smaller LCD m<strong>on</strong>itor can be<br />
made. The distance from the projector can be<br />
scaled down accordingly when viewing a<br />
m<strong>on</strong>itor. In Figure 1, the scaling down of the<br />
visual angle is represented with respect to the<br />
distance to the screen. This type of setting will<br />
be used for the m<strong>on</strong>itor settings versus task<br />
performance experiment, with small m<strong>on</strong>itors<br />
<strong>on</strong>ly. Never the less, this ensures a c<strong>on</strong>stant<br />
viewing angle, eliminating c<strong>on</strong>taminati<strong>on</strong><br />
from this factor.<br />
In order to enforce this c<strong>on</strong>stant viewing angle<br />
for each participant, <strong>on</strong>e study had two posts<br />
<strong>on</strong> either side of the projector/m<strong>on</strong>itor and<br />
then fishing line was strung across at eye<br />
level. When the user sat down the distance<br />
was adjusted so the fishing line was across<br />
where the eyes should be centered [10]. Other<br />
3
Dave BOCKUS and Jenny GUAY<br />
Fig. 1-The scalable distance to be used from user to the m<strong>on</strong>itor<br />
research has suggested reading is best d<strong>on</strong>e<br />
when the eyes are looking downward, this can<br />
be c<strong>on</strong>sidered the optimum viewing angle, and<br />
should be kept c<strong>on</strong>stant throughout the<br />
experiment [15]. However this is not<br />
c<strong>on</strong>sistent with how LCD screens are used.<br />
Empirical evidence shows that m<strong>on</strong>itor<br />
placement is haphazard, and usually a<br />
functi<strong>on</strong> of the available furniture rather then<br />
good erg<strong>on</strong>omic practices.<br />
There has been research d<strong>on</strong>e regarding the<br />
different f<strong>on</strong>ts designed specifically for screen<br />
display versus <strong>on</strong>es designed for print. The<br />
formatting of the f<strong>on</strong>ts for print are different<br />
then the screen display f<strong>on</strong>ts. Screen display<br />
f<strong>on</strong>ts have larger x-heights, meaning when<br />
compared with other f<strong>on</strong>ts, they appear larger<br />
at the same f<strong>on</strong>t size, to improve readability<br />
and recogniti<strong>on</strong>. A suggested optimum print<br />
f<strong>on</strong>t size that has been tested is 9-10 point,<br />
anything above or below this has caused<br />
reading performance to degrade [13]. An<br />
optimum f<strong>on</strong>t size for reading off of computer<br />
screens is generated by using the screen<br />
display f<strong>on</strong>ts scaled to the print size, which<br />
correlates to a normal print f<strong>on</strong>t. The type of<br />
f<strong>on</strong>t used has been found to affect legibility,<br />
and should be taken into c<strong>on</strong>siderati<strong>on</strong> when<br />
c<strong>on</strong>ducting the task performance experiment.<br />
A comparis<strong>on</strong> of anti-aliased f<strong>on</strong>ts to bitmap<br />
f<strong>on</strong>ts was researched but the results were not<br />
significant enough to c<strong>on</strong>clude that either f<strong>on</strong>t<br />
was better for readability [5]. Another factor<br />
when choosing f<strong>on</strong>ts is the case the words will<br />
be used in most often [13]. F<strong>on</strong>ts designed<br />
specifically for screen display have vast<br />
differences between letters, such as upper case<br />
‘I’ that can often look similar to a lower case<br />
‘l’ [5]. Having the letters as lowercase makes<br />
it easier to read and identify letters and words<br />
[13]. Since the experiment to be c<strong>on</strong>ducted is<br />
meant to be practical, any words used will be<br />
mixed case.<br />
Deviating from a ratio of comparative ‘fields<br />
of view’ such as geometric fields of view, and<br />
display fields of view; can drastically affect<br />
what the pers<strong>on</strong> sees. It causes miniaturizati<strong>on</strong><br />
or magnificati<strong>on</strong> and should be held c<strong>on</strong>stant<br />
so as to not skew the results. Studies have<br />
identified that there is a difference in visual<br />
navigati<strong>on</strong> techniques between men and<br />
women, but using certain viewing angles and<br />
display sizes can eliminate this bias. Women<br />
navigate by landmark so a wider visual angle<br />
allows easier navigati<strong>on</strong> by this technique [8].<br />
This is <strong>on</strong>ly relevant in a virtual envir<strong>on</strong>ment,<br />
and has not been proven to effect regular LCD<br />
screen navigati<strong>on</strong>.<br />
If the complexity of a document the user is<br />
trying to view is greater then what can be<br />
displayed, extra navigati<strong>on</strong> is required [3].<br />
The reduced amount of informati<strong>on</strong> <strong>on</strong><br />
computer screens is a critical factor in<br />
performing tests related to the Hicks’ and<br />
Fitts’ model [13]. The key is to determine at<br />
what point the display size is not large enough<br />
to display an optimum amount of informati<strong>on</strong>.<br />
Current technology is available <strong>on</strong> larger LCD<br />
m<strong>on</strong>itors that have resoluti<strong>on</strong>s so high that<br />
two pages of informati<strong>on</strong> can be displayed<br />
side by side. However since these m<strong>on</strong>itors<br />
are not in the home c<strong>on</strong>sumer market in<br />
significant masses, the most comm<strong>on</strong>ly<br />
available m<strong>on</strong>itors are used in this<br />
experimentati<strong>on</strong> [15]. There have been many<br />
studies testing readability but there are few<br />
that test legibility, which is usually measured<br />
by identificati<strong>on</strong> and selecti<strong>on</strong> tasks. When<br />
testing readability or legibility, the colour of<br />
the f<strong>on</strong>t and background used must be<br />
c<strong>on</strong>sidered. By using the most comm<strong>on</strong> colour<br />
4
Dave BOCKUS and Jenny GUAY<br />
scheme, dark text <strong>on</strong> a light background and<br />
requiring participants to have normal-tocorrected<br />
visi<strong>on</strong>, biases and inaccurate results<br />
can be avoided. Even though studies have<br />
shown that using positive c<strong>on</strong>trast, light text<br />
<strong>on</strong> dark, is easier to read because the flicker<br />
rate is less apparent, the current LCD’s have<br />
flicker rates that are hardly noticeable, thus<br />
negating any previous c<strong>on</strong>cerns [13]. An<br />
interesting approach to finding the optimum<br />
settings for a m<strong>on</strong>itor was to have participants<br />
in a study adjust these settings themselves.<br />
However this requires that participants have<br />
some computer literacy and makes the results<br />
hard to measure and record [13]. Furthermore,<br />
these settings are highly pers<strong>on</strong>al preferenced.<br />
Adjusting the visual angle al<strong>on</strong>e is not<br />
guaranteed to have an impact <strong>on</strong> reading<br />
performance. This goes for any other single<br />
factor, a combinati<strong>on</strong> of factors must be<br />
adjusted to yield any sort of difference.<br />
Although studies have shown that reading<br />
from paper is generally faster then reading<br />
from a computer screen, using high resoluti<strong>on</strong><br />
displays can yield almost equal reading speeds<br />
for both mediums [13]. After the size and<br />
resoluti<strong>on</strong> correlati<strong>on</strong>s have been determined,<br />
the next step is to c<strong>on</strong>sider the design of the<br />
tasks. The interface for the tasks should make<br />
use of comm<strong>on</strong> design principles, including<br />
visibility. Visibility is obtained by using high<br />
quality displays and making informati<strong>on</strong><br />
easily visible to the user. By following this<br />
guideline, it will reinforce any differences in<br />
performance that occur when the display<br />
settings have been adjusted, thus not<br />
attributing to bad design [14].<br />
Experiment<br />
There have been many studies c<strong>on</strong>cerning<br />
readability and task performance <strong>on</strong> CRT<br />
m<strong>on</strong>itors, but there have been few that have<br />
used LCD m<strong>on</strong>itors. This study will test the<br />
difference in task performance when paired<br />
with different screen resoluti<strong>on</strong>s and display<br />
sizes <strong>on</strong> LCD m<strong>on</strong>itors. The objective is to<br />
show there is better task performance using a<br />
large m<strong>on</strong>itor <strong>on</strong> higher resoluti<strong>on</strong>. This will<br />
be d<strong>on</strong>e using navigati<strong>on</strong>al and selecti<strong>on</strong>al<br />
tasks to simulate Fitts’ and Hicks’ law, which<br />
are validated metrics.<br />
Pre-Experiment:<br />
The first stage was selecting volunteers, and<br />
having them fill out a pre-experiment<br />
questi<strong>on</strong>naire to determine their eligibility.<br />
The questi<strong>on</strong>naire determined the participant’s<br />
computer experience, with qualified <strong>on</strong>es<br />
having used a computer at least <strong>on</strong>ce a week.<br />
By using the computer <strong>on</strong>ce a week, it was<br />
surmised that the participant had basic mouse<br />
and keyboard skills, ensuring competent eyehand<br />
coordinati<strong>on</strong>. Informati<strong>on</strong> regarding the<br />
age of the participants was collected, having<br />
them choose an age range between 18 and 45.<br />
In a study d<strong>on</strong>e by Statistics Canada, the age<br />
of the highest computer users was less than 45<br />
[2]. For the lower part of the age range, it is<br />
expected the lowest age is 18, since the study<br />
was c<strong>on</strong>ducted in a university envir<strong>on</strong>ment.<br />
Visi<strong>on</strong> was taken into account, asking<br />
participants to have normal or normal to<br />
corrected visi<strong>on</strong>. Gender was also required, to<br />
ensure equal numbers of both.<br />
The Equipment<br />
The tasks were simple executable files written<br />
in visual studio. A Pentium 3 computer with<br />
windows XP is an acceptable minimum for<br />
running the files. The computers were<br />
equipped with a QWERTY keyboard and an<br />
optical mouse. Three different sizes of<br />
m<strong>on</strong>itors, 15, 17 and 19 inches, with standard<br />
diag<strong>on</strong>al measurement were used. The chair<br />
the participants sat <strong>on</strong> was adjustable. Height<br />
was kept c<strong>on</strong>stant throughout the experiment<br />
<strong>on</strong>ce adjusted for the individual. This assured<br />
each participant was looking downward at the<br />
5
Dave BOCKUS and Jenny GUAY<br />
screen with their feet touching the ground.<br />
The chair distance emulated a safe viewing<br />
distance of approximately 25 inches in<br />
accordance with Figure 1.<br />
The Variables<br />
The independent variables are the screen size<br />
and screen resoluti<strong>on</strong>. The three resoluti<strong>on</strong>s<br />
tested were, 800 x600, 1024x768, and<br />
1280x1024. The three screen sizes used, 15,<br />
17 and 19 inch displays and were tested with<br />
the three screen resoluti<strong>on</strong>s and two tasks. The<br />
15 inch m<strong>on</strong>itor was <strong>on</strong>ly tested with two<br />
resoluti<strong>on</strong>s because of hardware limitati<strong>on</strong>s at<br />
the higher resoluti<strong>on</strong>. The dependent variables<br />
are the task performance time, and error rate.<br />
For the navigati<strong>on</strong>al task, the task<br />
performance is calculated using the index of<br />
difficulty of the task over the movement time.<br />
For the selecti<strong>on</strong>al task, the task performance<br />
is calculated as strictly the selecti<strong>on</strong> time. The<br />
number of items to choose from was kept<br />
c<strong>on</strong>stant. C<strong>on</strong>stants in this experiment were<br />
determined by reviewing previous studies and<br />
seeing how factors skewed results. Since the<br />
most readable combinati<strong>on</strong> of colours for f<strong>on</strong>t<br />
and background is black <strong>on</strong> white, it was used<br />
throughout the experiment [1]. LCD screens<br />
have different types of colour quality; medium<br />
colour (16 bits), high colour (32 bits), and true<br />
colour. The colour quality was kept at 16 bits<br />
and the refresh rate of the m<strong>on</strong>itors was set to<br />
75HZ. Lack of noticeable flicker <strong>on</strong> LCD<br />
m<strong>on</strong>itors meant that the refresh rate could be<br />
kept c<strong>on</strong>stant [16]. The brightness and<br />
c<strong>on</strong>trast was set to 50/50 and kept c<strong>on</strong>stant<br />
throughout the experiment. The f<strong>on</strong>t type is<br />
set to Verdana, a f<strong>on</strong>t specifically designed for<br />
screen display, with a larger x comp<strong>on</strong>ent<br />
making it easier to read. A f<strong>on</strong>t size of 12<br />
point at 96 dpi was used (default setting)<br />
because it is the default size used in computer<br />
applicati<strong>on</strong>s. Since the experiment is being<br />
c<strong>on</strong>ducted in a university envir<strong>on</strong>ment, 12<br />
point was optimal because it is the size most<br />
used when writing assignments and tests. The<br />
m<strong>on</strong>itor height was adjusted so the<br />
participants when looking straight ahead were<br />
staring at the top edge of the m<strong>on</strong>itor. Thus<br />
participant needed to look slightly down at the<br />
screen c<strong>on</strong>tents. (Ball 2006) had shown that<br />
optimal viewing angle requires the user’s eyes<br />
looking downward at the screen.<br />
The <str<strong>on</strong>g>Task</str<strong>on</strong>g>s<br />
The first task the participants performed<br />
loosely simulated Hicks’ law, c<strong>on</strong>cerning<br />
decisi<strong>on</strong> time in the selecti<strong>on</strong> from a list of<br />
items. To obtain a performance index the item<br />
list was held c<strong>on</strong>stant. In the middle of the<br />
screen there was a word. Around this word, 7<br />
butt<strong>on</strong>s with various words <strong>on</strong> them (Fig 2).<br />
With each click of the middle word, the 7<br />
butt<strong>on</strong>s changed to simulate a selecti<strong>on</strong> task.<br />
The user clicked the matching word <strong>on</strong> <strong>on</strong>e of<br />
the 7 butt<strong>on</strong>s. Once this selecti<strong>on</strong> was made<br />
the 7 butt<strong>on</strong>s and the middle word are reset.<br />
The user must then click <strong>on</strong> the middle word<br />
to start the process over. The time it takes<br />
from clicking the middle word to finding the<br />
corresp<strong>on</strong>ding selecti<strong>on</strong> is measured. As well,<br />
the number of words in the selecti<strong>on</strong> is<br />
measured, ranging from <strong>on</strong>e to three. The<br />
number of words displayed in the centre and<br />
<strong>on</strong> the 7 butt<strong>on</strong>s is synergetic, so that the user<br />
must read and comprehend during the<br />
selecti<strong>on</strong> process. This prevents eliminating<br />
choices based <strong>on</strong> the number of words. An<br />
error rate is also recorded measuring incorrect<br />
word selecti<strong>on</strong>.<br />
6
Dave BOCKUS and Jenny GUAY<br />
Fig. 2-<str<strong>on</strong>g>Task</str<strong>on</strong>g> 1 Screenshot<br />
The sec<strong>on</strong>d task simulated Fitts’ law,<br />
focussing <strong>on</strong> movement time in navigati<strong>on</strong>al<br />
tasks. A butt<strong>on</strong> is placed <strong>on</strong> the left center of<br />
the screen (Fig 3). After clicking <strong>on</strong> the<br />
leftmost butt<strong>on</strong>, a sec<strong>on</strong>d butt<strong>on</strong> appears to the<br />
right at a random distance. Clicking <strong>on</strong> the<br />
right butt<strong>on</strong> finishes the iterati<strong>on</strong>; the user<br />
must click the left butt<strong>on</strong> for the cycle to<br />
repeat. The positi<strong>on</strong> of the right butt<strong>on</strong> is a<br />
random distance to the left of the first butt<strong>on</strong>.<br />
The time it takes to navigate to and click the<br />
right butt<strong>on</strong> is recorded. The distance between<br />
the butt<strong>on</strong>s is recorded in pixels.<br />
Each task was performed under combinati<strong>on</strong>s<br />
of the different resoluti<strong>on</strong>s and sizes. Each<br />
task was performed using the 3 different<br />
m<strong>on</strong>itor sizes, and three resoluti<strong>on</strong>s. The<br />
target size was held at 32x75 pixels. Thus as<br />
resoluti<strong>on</strong> and m<strong>on</strong>itor size varied, so did the<br />
relative target size and distance to the target,<br />
in a proporti<strong>on</strong>ed setting. When analyzing the<br />
Fitts’ formulas, a c<strong>on</strong>stant (K) which<br />
represents proporti<strong>on</strong>al change in target size<br />
and distance between targets as m<strong>on</strong>itor size<br />
and resoluti<strong>on</strong> vary is represented as:<br />
ID =log2(2KA/KW) (1)<br />
This formula represents the index of<br />
difficulty, and illustrates how proporti<strong>on</strong>al<br />
change in distance and target size become n<strong>on</strong><br />
factors. The variable A is the amplitude and<br />
measures the distance between the two butt<strong>on</strong>s<br />
during each iterati<strong>on</strong>. The W is the width of<br />
the cross-secti<strong>on</strong> of the right butt<strong>on</strong> which was<br />
c<strong>on</strong>stant throughout the experiment. The<br />
c<strong>on</strong>stant K in formula 1 is eliminated allowing<br />
the ID to be unaffected by the scaling induced<br />
by screen size and resoluti<strong>on</strong>. Thus, the<br />
movement time MT now becomes the <strong>on</strong>ly<br />
independent variable. In order to determine an<br />
average index of performance (IP), as the task<br />
progresses, the average movement time,<br />
served as a measure of task performance. This<br />
index of performance is given as:<br />
A<br />
Fig-3 <str<strong>on</strong>g>Task</str<strong>on</strong>g> 2 Screenshot<br />
IP=ID/MT (2)<br />
Formula 2 then gives a standard forum in<br />
which to compare the effects of changing<br />
m<strong>on</strong>itor size and resoluti<strong>on</strong> (Mackenzie 1992).<br />
Post Experiment<br />
The participants filled out an exit<br />
questi<strong>on</strong>naire to determine which resoluti<strong>on</strong><br />
and size they preferred and how they felt the<br />
slight differences changed their task<br />
performance, as well as any complicati<strong>on</strong>s<br />
they ran into. The results were calculated<br />
according to the appropriate ratios for each<br />
task, and then were displayed in graphs and<br />
w<br />
7
Dave BOCKUS and Jenny GUAY<br />
spreadsheets for easy comparis<strong>on</strong>. The data<br />
was compared between the two tasks as well<br />
as within each task. If the difference in results<br />
between the tasks are greater then the<br />
difference within the tasks, the results<br />
between the tasks are c<strong>on</strong>sidered significant.<br />
If the case is the opposite, the difference was<br />
not c<strong>on</strong>sidered significant between the two<br />
tasks.<br />
The Results<br />
The first task focused <strong>on</strong> selecti<strong>on</strong> and<br />
readability, which measured selecti<strong>on</strong> from a<br />
list of items. The task measured an index of<br />
performance represented simply as the<br />
movement time MT in sec<strong>on</strong>ds (Fig 4). In the<br />
task the number of words in each iterati<strong>on</strong><br />
ranged from <strong>on</strong>e to three. Comparing the<br />
times show that for iterati<strong>on</strong>s with <strong>on</strong>ly <strong>on</strong>e<br />
word, the time was lower then for searching<br />
for two or three words, as can be expected.<br />
There is no noticeable pattern as the<br />
resoluti<strong>on</strong>s and sizes change (Fig 5). A couple<br />
values are distinct; the worst performance was<br />
Index of <str<strong>on</strong>g>Performance</str<strong>on</strong>g><br />
1.25<br />
1.15<br />
1.05<br />
0.95<br />
0.85<br />
0.75<br />
0.65<br />
0.55<br />
15-<br />
800<br />
15-<br />
1024<br />
17-<br />
800<br />
IP <str<strong>on</strong>g>Task</str<strong>on</strong>g> 1<br />
17-<br />
1024<br />
17-<br />
1280<br />
19-<br />
800<br />
IP <str<strong>on</strong>g>Task</str<strong>on</strong>g> 1 0.62 1.11 1.14 1.28 1.03 1.22 1.25 1.15<br />
Display Size & Resoluti<strong>on</strong><br />
Fig-4- <str<strong>on</strong>g>Task</str<strong>on</strong>g> 1 IP<br />
19-<br />
1024<br />
19-<br />
1280<br />
IP <str<strong>on</strong>g>Task</str<strong>on</strong>g> 1<br />
<strong>on</strong> the 15 inch, 800x600 for all three lengths.<br />
As well <strong>on</strong>e of the best performers for all<br />
three was the 17 inch, 1024x768. It does<br />
appear that the gradient curve gets much<br />
rougher as the number of words increase.<br />
Hence more difficult to comprehend. This<br />
indicates that there are some resoluti<strong>on</strong>s and<br />
m<strong>on</strong>itor size combinati<strong>on</strong>s which definitely<br />
improve or hinder readability for selecti<strong>on</strong>s of<br />
3 words.<br />
The time that was recorded was in<br />
millisec<strong>on</strong>ds and started when the user clicked<br />
the middle area until they clicked the word<br />
they were searching for. The results showed<br />
that the best performers were the 19 inch at<br />
1280x1024, the 19 inch at 800x600 and yet<br />
again the 17 inch at 1024x768. There was a<br />
decrease in performance at the 17 inch<br />
1280x1024 combinati<strong>on</strong>, attributed to ability<br />
to optically differentiate selecti<strong>on</strong>s,<br />
overloading the user. The 19 inch, 1280x1024<br />
also suffered a decreased performance. This<br />
could be attributed to the 19 inch, 1280x1024<br />
being the last combinati<strong>on</strong> the user completed<br />
Time(s)<br />
3<br />
2.95<br />
2.9<br />
2.85<br />
2.8<br />
2.75<br />
2.7<br />
2.65<br />
2.6<br />
2.55<br />
2.5<br />
2.45<br />
2.4<br />
2.35<br />
2.3<br />
15-<br />
800<br />
<str<strong>on</strong>g>Task</str<strong>on</strong>g> 1-Avg time for Length 1,2,3<br />
15-<br />
1024<br />
17-<br />
800<br />
17-<br />
1024<br />
17-<br />
1280<br />
19-<br />
800<br />
Length 1 2.752 2.4 2.5 2.325 2.444 2.384 2.358 2.476<br />
Length 2 2.867 2.699 2.662 2.604 2.644 2.526 2.56 2.626<br />
Length 3 2.938 2.607 2.74 2.49 2.721 2.501 2.708 2.578<br />
Display Size/Resoluti<strong>on</strong><br />
19-<br />
1024<br />
Fig-5 –Length of words in <str<strong>on</strong>g>Task</str<strong>on</strong>g> 1<br />
19-<br />
1280<br />
Length 1<br />
Length 2<br />
Length 3<br />
during the experiment. Fatigue could be<br />
attributed to the loss of performance. The<br />
poorest performer was the 15 inch at 800x600,<br />
with its small surface area and pixelly<br />
resoluti<strong>on</strong>, the readability was greatly<br />
decreased. As well each user started off <strong>on</strong><br />
this iterati<strong>on</strong>, suggesting a small learning<br />
curve could also distort the results.<br />
In the sec<strong>on</strong>d task, the targeting <strong>on</strong>e, the index<br />
of performance that was calculated was a<br />
relative measure, because a recognized bit rate<br />
was not used. (Mackenzie 1992).This was due<br />
to the varying of the target positi<strong>on</strong>. The index<br />
of performance was based <strong>on</strong> the time it took<br />
8
Dave BOCKUS and Jenny GUAY<br />
to move between the targets and was averaged<br />
over the populati<strong>on</strong> of data (Fig 6). In essence<br />
Index of <str<strong>on</strong>g>Performance</str<strong>on</strong>g><br />
3.95<br />
3.9<br />
3.85<br />
3.8<br />
3.75<br />
3.7<br />
3.65<br />
3.6<br />
3.55<br />
15-<br />
800<br />
15-<br />
1024<br />
17-<br />
800<br />
IP <str<strong>on</strong>g>Task</str<strong>on</strong>g> 2<br />
17-<br />
1024<br />
17-<br />
1280<br />
19-<br />
800<br />
IP <str<strong>on</strong>g>Task</str<strong>on</strong>g> 2 3.572 3.842 3.855 3.915 3.753 3.84 3.831 3.84<br />
Display Size & Resoluti<strong>on</strong><br />
19-<br />
1024<br />
19-<br />
1280<br />
IP <str<strong>on</strong>g>Task</str<strong>on</strong>g> 2<br />
resoluti<strong>on</strong>. The poorest results were from the<br />
15 inch m<strong>on</strong>itor, which was not entirely<br />
unexpected. The 15 inch m<strong>on</strong>itor at the<br />
resoluti<strong>on</strong> of 800x600 had the worst index of<br />
performance. The performance of the 15 inch<br />
at 800x600 was so different from the IP of the<br />
other combinati<strong>on</strong>s that it could be c<strong>on</strong>sidered<br />
an outlier. A reas<strong>on</strong> for this could be that there<br />
is a small learning curve involved, and since<br />
every user started at 15, 800x600, their results<br />
would be biased negatively. The learning<br />
curve was short so after the first round, the<br />
learning would have been accomplished.<br />
Fig-6 <str<strong>on</strong>g>Task</str<strong>on</strong>g> 2 IP<br />
the IP calculated is an average over 1200<br />
samples per subject. The index was calculated<br />
as the index of difficulty over movement time.<br />
The index of difficulty ID , which allows<br />
scaling based <strong>on</strong> the resoluti<strong>on</strong> and m<strong>on</strong>itor<br />
size was calculated using formula (2). The<br />
target in the first task was kept at a c<strong>on</strong>stant<br />
size throughout and had a cross-secti<strong>on</strong> of 32<br />
x 125 pixels. This allowed it to scale<br />
proporti<strong>on</strong>ately al<strong>on</strong>g with the distance.<br />
The results show that the 17 inch m<strong>on</strong>itor at<br />
1024x768 yielded the best index of<br />
performance. Not surprisingly the 17 inch at<br />
1280x1024 performed poorly. This occurred<br />
<strong>on</strong>ce again because the optically resoluti<strong>on</strong><br />
and m<strong>on</strong>itor size overloaded the user, and<br />
prevented them from completing the task as<br />
effectively as other resoluti<strong>on</strong>s. For the 19<br />
inch m<strong>on</strong>itor, as the resoluti<strong>on</strong> went up, the<br />
index of performance remained relatively<br />
c<strong>on</strong>stant. The 19 inch combined with the<br />
1280x1024 resoluti<strong>on</strong> performed the best out<br />
of the 19 inch, also beating out the 17 inch<br />
1280x1024 because of the increased physical<br />
size. This illustrates the importance physical<br />
size has <strong>on</strong> the users ability to perform. The<br />
19 inch 1280x1024 did not overload the user<br />
because the increased surface area of the<br />
m<strong>on</strong>itor was able to effectively display a clear<br />
C<strong>on</strong>clusi<strong>on</strong>s<br />
<str<strong>on</strong>g>Task</str<strong>on</strong>g> 1<br />
A f<strong>on</strong>t size in the range of 4.2 mm <strong>on</strong> screen<br />
gave the best results with performance<br />
degrading as the size moved away from this<br />
metric. As the f<strong>on</strong>t size went up, the<br />
performance slowly started to decrease, and it<br />
decreased dramatically when the f<strong>on</strong>t size fell<br />
below 4.2 (See Fig 7 and 8). The height of 12<br />
point Verdana f<strong>on</strong>t <strong>on</strong> paper was measured to<br />
be ~3.40 mm (Fig-7) as a comparative<br />
measure. The closest measurement to this was<br />
<strong>on</strong> the 15 inch screen at a resoluti<strong>on</strong> of<br />
1024x768. This indicates that while 12 point<br />
Verdana may be easy to read <strong>on</strong> paper, <strong>on</strong> the<br />
screen it causes performance degradati<strong>on</strong>.<br />
Resoluti<strong>on</strong>s with a f<strong>on</strong>t size above the print<br />
size did the best. As so<strong>on</strong> as the f<strong>on</strong>t size<br />
approached or dipped below the print size,<br />
performance went down.<br />
9
Dave BOCKUS and Jenny GUAY<br />
Many factors c<strong>on</strong>tribute to this, for instance<br />
blurriness due to high resoluti<strong>on</strong> <strong>on</strong> a surface<br />
which can not support it, or graininess as a<br />
result of low resoluti<strong>on</strong>. It is apparent that<br />
many factors c<strong>on</strong>tribute to ideal reading<br />
c<strong>on</strong>diti<strong>on</strong>s. The study did show that a balance<br />
1.3<br />
1.2<br />
1.1<br />
1<br />
0.9<br />
0.8<br />
0.7<br />
0.6<br />
F<strong>on</strong>t Height vs. Print f<strong>on</strong>t height<br />
6<br />
5.4<br />
4.8<br />
4.2<br />
3.6<br />
3<br />
15-<br />
800<br />
15-<br />
1024<br />
F<strong>on</strong>t height (mm)<br />
<str<strong>on</strong>g>Task</str<strong>on</strong>g> 1 IP<br />
<str<strong>on</strong>g>Task</str<strong>on</strong>g> 1-IP<br />
17-<br />
800<br />
Fig-7 F<strong>on</strong>t heights<br />
Resoluti<strong>on</strong><br />
Fig-8 <str<strong>on</strong>g>Task</str<strong>on</strong>g> 1 IP<br />
17-<br />
1024<br />
17-<br />
1280<br />
Res oluti<strong>on</strong><br />
19-<br />
800<br />
Print f<strong>on</strong>t size (mm)<br />
19-<br />
1024<br />
19-<br />
1280<br />
F<strong>on</strong>t height (mm) 4.8 3.5 5.5 4.2 3.25 6 5 4.5<br />
Print f<strong>on</strong>t size (mm) 3.4 3.4 3.4 3.4 3.4 3.4 3.4 3.4<br />
of screen size and resoluti<strong>on</strong> must be obtained<br />
to facilitate prime c<strong>on</strong>diti<strong>on</strong>s. This also<br />
reinforces the c<strong>on</strong>cept that people read<br />
differently <strong>on</strong> screen then they do <strong>on</strong> paper<br />
since a larger average f<strong>on</strong>t size around 4.2 mm<br />
tends give the best reading and comprehensi<strong>on</strong><br />
performance. As the f<strong>on</strong>t size goes up, the<br />
error rate in <str<strong>on</strong>g>Task</str<strong>on</strong>g> 1 noticeably decreases. The<br />
resoluti<strong>on</strong>s with the lowest error rate were the<br />
19 inch at 1024x768 and 1280x1024 which<br />
also had the highest and 3 rd highest f<strong>on</strong>t sizes,<br />
respectively. Once again when the f<strong>on</strong>t size<br />
gets near 4.2 mm, the error rate increases<br />
15-800 15-1024 17-800 17-1024 17-1280 19-800 19-1024 19-1280<br />
<str<strong>on</strong>g>Task</str<strong>on</strong>g> 1-IP 0.61930392 1.11477123 1.14366008 1.27941356 1.03335345 1.21863542 1.24749515 1.1453758<br />
dramatically(Fig-9). From the error data and<br />
the <str<strong>on</strong>g>Task</str<strong>on</strong>g> 1 IP, 4.2 mm was the magic number<br />
that caused the results to change dramatically<br />
as it was approached. Both (Fig-8) and (Fig-9)<br />
18<br />
16<br />
14<br />
12<br />
10<br />
8<br />
6<br />
4<br />
2<br />
0<br />
Error Rate vs. F<strong>on</strong>t Size<br />
15-800 15-1024 17-800 17-1024 17-1280 19-800 19-1024 19-1280<br />
<str<strong>on</strong>g>Task</str<strong>on</strong>g> 1 Error Rate 17 17 7 12 13 5 5 6<br />
F<strong>on</strong>t size 4.8 3.5 5.5 4.2 3.25 6 5 4.5<br />
Res oluti<strong>on</strong><br />
<str<strong>on</strong>g>Task</str<strong>on</strong>g> 1 Error Rate<br />
F<strong>on</strong>t size<br />
Fig-9: <str<strong>on</strong>g>Task</str<strong>on</strong>g> 1 Error Rate vs. F<strong>on</strong>t Size<br />
show that <strong>on</strong>ce the f<strong>on</strong>t size goes below 4.2<br />
mm the index of performance decreases and<br />
the error rates increase. The number of errors<br />
for the 15 inch at 800x600 is an anomaly<br />
because it performed badly in all aspects. This<br />
task dealt primarily with fine motor skills and<br />
it appears that if the resoluti<strong>on</strong> gets too small,<br />
those skills are affected, as shown <strong>on</strong> the 17<br />
inch at 1280x1024 results.<br />
<str<strong>on</strong>g>Task</str<strong>on</strong>g> 2<br />
Analysis of the Data relating to the targeting<br />
task shows that the Index of <str<strong>on</strong>g>Performance</str<strong>on</strong>g><br />
stabilizes when the distance is greater then<br />
300 pixels (Fig-10). On shorter distances, the<br />
IP does not follow a clear trend but varies<br />
widely. The reas<strong>on</strong>ing for this: clicking and<br />
cognitive aspects dominate at short distances,<br />
but become less of a factor across larger<br />
distances, since movement time tends to take<br />
over as a dominant factor. The IP scales with<br />
the distance after 300 pixels between targets,<br />
however, the task <strong>on</strong>ly involves targeting and<br />
not comprehensi<strong>on</strong>. Thus, <strong>on</strong>ly small gains are<br />
observed across the varying resoluti<strong>on</strong> and<br />
m<strong>on</strong>itor size combinati<strong>on</strong>s.<br />
10
Dave BOCKUS and Jenny GUAY<br />
IP<br />
6.5<br />
6.1<br />
5.7<br />
5.3<br />
4.9<br />
4.5<br />
4.1<br />
3.7<br />
3.3<br />
2.9<br />
2.5<br />
2.1<br />
1.7<br />
1.3<br />
0.9<br />
0.5<br />
<str<strong>on</strong>g>Task</str<strong>on</strong>g> 2 IP vs Distance<br />
Dave BOCKUS and Jenny GUAY<br />
References<br />
1. Ball, R., Booker, J.,North, C.,Shupp, L.,Yost, B. Evaluati<strong>on</strong>s of Viewport size and<br />
curvatures of Large, High-resoluti<strong>on</strong> displays. Graphics Interface 123-130.<br />
2. Ball, R., North, C. Effects of tiled high-resoluti<strong>on</strong> display <strong>on</strong> basic visualizati<strong>on</strong>s and<br />
navigati<strong>on</strong> tasks. CHI |Late Breaking Result: Posters. 1196-1199.<br />
3. Baudisch, P., Bellotti, V., Good, N., Schraedley,P. Keeping things in c<strong>on</strong>text: A<br />
comparative evaluati<strong>on</strong> of focus plus c<strong>on</strong>text screens, overviews and zooming. CHI 4(1).<br />
259-266.<br />
4. Bowman, A.D., Chen, J., Ni, T. Increased Display Size and Resoluti<strong>on</strong> Improve <str<strong>on</strong>g>Task</str<strong>on</strong>g><br />
<str<strong>on</strong>g>Performance</str<strong>on</strong>g> in Informati<strong>on</strong>-Rich Virtual Envir<strong>on</strong>ments. Graphics Interface. 139 -146.<br />
5. Boyarski, D., Fortizzi, J.,Neuwirth, C.,Regii, S. H. A study of f<strong>on</strong>ts designed for screen<br />
display. CHI. 87-94.<br />
6. Bridgeman, B., Lenn<strong>on</strong>, L.M., Jackenthal, A. Effects of Screen Size, Screen Resoluti<strong>on</strong>,<br />
and Display Rate <strong>on</strong> <strong>Computer</strong>-Based Test Perfomance. Applied Measurement in<br />
Educati<strong>on</strong>., 16 (3). 191-205.<br />
7. Card, S.K., Moran, T. P., Newell, A. The Psychology of Human-<strong>Computer</strong> Interacti<strong>on</strong>.<br />
Lawrence Erlbaum Associate, Publishers, L<strong>on</strong>d<strong>on</strong>, 1983.<br />
8. Czerwinki, M., Tan, D. S., Roberts<strong>on</strong>, G. G. Women take a wider view. CHI 195-202.<br />
9. Ed: Gilbert, N., M<strong>on</strong>k, A. F. Perspectives <strong>on</strong> HCI: Diverse Approaches.Handley.<br />
Academic Press, California, 1995.<br />
10. Gergle, D., Pausch, R., Scupelli, P. G., Tan, D. S. With similar visual angles, larger<br />
displays mprove spatial performance. CHI (5(1)). 217-224.<br />
11. Heim, S. The Res<strong>on</strong>ant Interface: HCI foundati<strong>on</strong>s for interacti<strong>on</strong> design. Pears<strong>on</strong>, New<br />
York, 2008.<br />
12. MacKenzie, I.S. Fitts' Law as a Research and Design Tool in Human-<strong>Computer</strong><br />
Interacti<strong>on</strong>. Human-<strong>Computer</strong> Interacti<strong>on</strong>, 7 (1). 49.<br />
13. Mills, C.B., Weld<strong>on</strong>, L. J. Reading text from computer screens. ACM, 19 (4). 329-358.<br />
14. Norman, D. The design of everyday things. Basic Books, New York, 1988.<br />
12
Dave BOCKUS and Jenny GUAY<br />
15. Plaisant, C.S., Shneiderman, B. Designing the user interface: Strategies for effective<br />
Human-computer interacti<strong>on</strong>. Pears<strong>on</strong>, Maryland, 2005.<br />
16. Ziefle, M. Effects of display resoluti<strong>on</strong> <strong>on</strong> visual performance. Human Factors, 40 (4).<br />
13


