- Page 1 and 2:
process AIRPLANE call TOWER giving
- Page 3 and 4:
Table of Contents Preface .........
- Page 5 and 6:
Contents 3.5.3 Repositioning Files
- Page 7 and 8:
Figures Figure 1-1. Flow of Control
- Page 9 and 10:
Preface SIMSCRIPT II.5 is a rich an
- Page 11 and 12:
1. SIMSCRIPT II.5 Basic Concepts 1.
- Page 13 and 14:
SIMSCRIPT II.5 Basic Concepts assig
- Page 15 and 16:
SIMSCRIPT II.5 Basic Concepts An ex
- Page 17 and 18:
SIMSCRIPT II.5 Basic Concepts or pr
- Page 19 and 20:
SIMSCRIPT II.5 Basic Concepts start
- Page 21 and 22:
SIMSCRIPT II.5 Basic Concepts X = Y
- Page 23 and 24:
SIMSCRIPT II.5 Basic Concepts if ST
- Page 25 and 26:
SIMSCRIPT II.5 Basic Concepts both
- Page 27 and 28:
SIMSCRIPT II.5 Basic Concepts and o
- Page 29 and 30:
SIMSCRIPT II.5 Basic Concepts e R e
- Page 31 and 32:
SIMSCRIPT II.5 Basic Concepts Used
- Page 33 and 34:
SIMSCRIPT II.5 Basic Concepts while
- Page 35 and 36:
SIMSCRIPT II.5 Basic Concepts able
- Page 37 and 38:
SIMSCRIPT II.5 Basic Concepts varia
- Page 39 and 40:
SIMSCRIPT II.5 Basic Concepts The g
- Page 41 and 42:
SIMSCRIPT II.5 Basic Concepts ever
- Page 43 and 44:
SIMSCRIPT II.5 Basic Concepts secon
- Page 45 and 46:
SIMSCRIPT II.5 Basic Concepts Progr
- Page 47 and 48:
2. Programming Language Concepts 2.
- Page 49 and 50:
Programming Language Concepts Speci
- Page 51 and 52:
Programming Language Concepts Where
- Page 53 and 54:
Programming Language Concepts Table
- Page 55 and 56:
Programming Language Concepts Colum
- Page 57 and 58:
Programming Language Concepts The a
- Page 59 and 60:
Programming Language Concepts 2.6 R
- Page 61 and 62:
Programming Language Concepts 2.8 N
- Page 63 and 64:
Programming Language Concepts MAIN
- Page 65 and 66:
Programming Language Concepts compl
- Page 67 and 68:
Programming Language Concepts (norm
- Page 69 and 70:
Programming Language Concepts Some
- Page 71 and 72:
Programming Language Concepts routi
- Page 73 and 74:
Programming Language Concepts let X
- Page 75 and 76:
Programming Language Concepts names
- Page 77 and 78:
Programming Language Concepts value
- Page 79 and 80:
Programming Language Concepts . . c
- Page 81 and 82:
Programming Language Concepts which
- Page 83 and 84:
Programming Language Concepts ing c
- Page 85 and 86:
Programming Language Concepts defin
- Page 87 and 88:
Programming Language Concepts There
- Page 89 and 90:
Programming Language Concepts norma
- Page 91 and 92:
Programming Language Concepts Figur
- Page 93 and 94:
Programming Language Concepts subst
- Page 95 and 96:
Programming Language Concepts const
- Page 97 and 98:
Programming Language Concepts durin
- Page 99 and 100:
Programming Language Concepts Table
- Page 101 and 102:
Programming Language Concepts 2.27.
- Page 103 and 104:
Programming Language Concepts Progr
- Page 105 and 106:
Programming Language Concepts Multi
- Page 107 and 108:
Programming Language Concepts Progr
- Page 109 and 110:
3. Input/Output Concepts 3.1 Introd
- Page 111 and 112:
Programming Language Concepts for I
- Page 113 and 114:
Programming Language Concepts for I
- Page 115 and 116:
Programming Language Concepts assoc
- Page 117 and 118:
Programming Language Concepts numbe
- Page 119 and 120:
Programming Language Concepts Examp
- Page 121 and 122:
Programming Language Concepts in wh
- Page 123 and 124:
Programming Language Concepts colum
- Page 125 and 126:
Programming Language Concepts 3.4.3
- Page 127 and 128:
Programming Language Concepts for I
- Page 129 and 130:
Programming Language Concepts 3.5 M
- Page 131 and 132:
Programming Language Concepts 2. To
- Page 133 and 134:
Programming Language Concepts write
- Page 135 and 136:
Programming Language Concepts illus
- Page 137 and 138:
Programming Language Concepts Progr
- Page 139 and 140:
Programming Language Concepts Print
- Page 141 and 142:
Programming Language Concepts 6 7 8
- Page 143 and 144:
Programming Language Concepts A fin
- Page 145 and 146:
Programming Language Concepts Progr
- Page 147 and 148:
4. Modelling Concepts 4.1 Introduct
- Page 149 and 150:
Modelling Concepts WORKER value of
- Page 151 and 152:
Modelling Concepts every COMMUNITY
- Page 153 and 154:
Modelling Concepts set-ownership cl
- Page 155 and 156:
Modelling Concepts VESSEL V(I) NAME
- Page 157 and 158:
Modelling Concepts destroy entity n
- Page 159 and 160:
Modelling Concepts define entity na
- Page 161 and 162:
Modelling Concepts preamble normall
- Page 163 and 164:
Modelling Concepts In general, all
- Page 165 and 166:
Modelling Concepts both first and l
- Page 167 and 168:
Modelling Concepts F.KENNEL L.KENNE
- Page 169 and 170:
Modelling Concepts F.KENNEL L.KENNE
- Page 171 and 172:
Modelling Concepts if KENNEL(FARM)
- Page 173 and 174:
Modelling Concepts FIFO set Owner E
- Page 175 and 176:
Modelling Concepts Experience has s
- Page 177 and 178:
Modelling Concepts Table 4-1. Illus
- Page 179 and 180:
Modelling Concepts Because SPEED is
- Page 181 and 182:
Modelling Concepts sioned as N.CITY
- Page 183 and 184:
Modelling Concepts 1. Declaration:
- Page 185 and 186:
Modelling Concepts 1. list attribut
- Page 187 and 188: Modelling Concepts if STOCK.LEVEL..
- Page 189 and 190: Modelling Concepts compute D = sum
- Page 191 and 192: Modelling Concepts 4.14.3 An Analys
- Page 193 and 194: 5. Discrete Simulation Concepts 5.1
- Page 195 and 196: Discrete Simulation Concepts Some a
- Page 197 and 198: Discrete Simulation Concepts Job 2
- Page 199 and 200: Discrete Simulation Concepts may si
- Page 201 and 202: Discrete Simulation Concepts The wo
- Page 203 and 204: Discrete Simulation Concepts 5.3 Th
- Page 205 and 206: Discrete Simulation Concepts then,
- Page 207 and 208: Discrete Simulation Concepts ent cl
- Page 209 and 210: Discrete Simulation Concepts of eve
- Page 211 and 212: Discrete Simulation Concepts tomati
- Page 213 and 214: Discrete Simulation Concepts may be
- Page 215 and 216: Discrete Simulation Concepts Table
- Page 217 and 218: Discrete Simulation Concepts DESIGN
- Page 219 and 220: Discrete Simulation Concepts ized,
- Page 221 and 222: Discrete Simulation Concepts before
- Page 223 and 224: Discrete Simulation Concepts Extern
- Page 225 and 226: Discrete Simulation Concepts 1. if
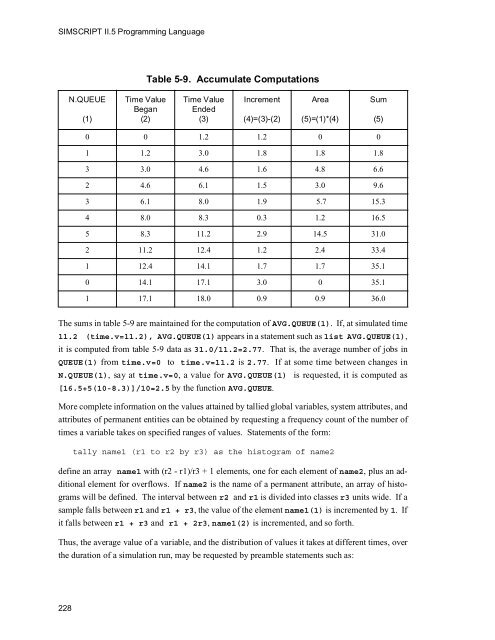
- Page 227 and 228: Discrete Simulation Concepts Table
- Page 229 and 230: Discrete Simulation Concepts When a
- Page 231 and 232: Discrete Simulation Concepts If the
- Page 233 and 234: Discrete Simulation Concepts RANDVA
- Page 235 and 236: Discrete Simulation Concepts 2. Use
- Page 237: Discrete Simulation Concepts Table
- Page 241 and 242: Discrete Simulation Concepts reset
- Page 243 and 244: Discrete Simulation Concepts statem
- Page 245 and 246: Discrete Simulation Concepts To use
- Page 247 and 248: Discrete Simulation Concepts time.
- Page 249 and 250: Discrete Simulation Concepts Produc
- Page 251 and 252: Discrete Simulation Concepts 1 main
- Page 253 and 254: Discrete Simulation Concepts 1 proc
- Page 255 and 256: Discrete Simulation Concepts 1 rout
- Page 257 and 258: Discrete Simulation Concepts E X A
- Page 259 and 260: 6. Advanced Topics 6.1 Introduction
- Page 261 and 262: Advanced Topics An appreciation of
- Page 263 and 264: Advanced Topics (a) for I = 1 to 10
- Page 265 and 266: Advanced Topics one for each level
- Page 267 and 268: Advanced Topics reserve ARRAY(*) as
- Page 269 and 270: Advanced Topics additional function
- Page 271 and 272: Advanced Topics program execution,
- Page 273 and 274: Advanced Topics 3. Declaration: eve
- Page 275 and 276: Advanced Topics 1. Declaration: eve
- Page 277 and 278: Advanced Topics Attributes: HIGH LO
- Page 279 and 280: Advanced Topics Table 6-2. Intrpack
- Page 281 and 282: Advanced Topics 6.5 Attribute Defin
- Page 283 and 284: Advanced Topics is executed, the ro
- Page 285 and 286: Advanced Topics Program 6-2. ______
- Page 287 and 288: Advanced Topics Program statements
- Page 289 and 290:
Advanced Topics The generation of s
- Page 291 and 292:
Advanced Topics The computations wi
- Page 293 and 294:
Advanced Topics The task of a right
- Page 295 and 296:
Advanced Topics Program 6-4. ______
- Page 297 and 298:
Advanced Topics main read N.SERIES
- Page 299 and 300:
Advanced Topics Table 6-7. Counters
- Page 301 and 302:
Appendix A. Format Conventions Used
- Page 303 and 304:
Appendix A. Format Conventions Used
- Page 305 and 306:
Appendix B. Functions and Routines
- Page 307 and 308:
Appendix B. Functions and Routines
- Page 309 and 310:
Appendix B. Functions and Routines
- Page 311 and 312:
Appendix B. Functions and Routines
- Page 313 and 314:
Appendix B. Functions and Routines
- Page 315 and 316:
Appendix B. Functions and Routines
- Page 317 and 318:
Appendix C. SIMSCRIPT Reference Syn
- Page 319 and 320:
Appendix C. SIMSCRIPT Reference Syn
- Page 321 and 322:
Appendix C. SIMSCRIPT Reference Syn
- Page 323 and 324:
Appendix C. SIMSCRIPT Reference Syn
- Page 325 and 326:
Appendix C. SIMSCRIPT Reference Syn
- Page 327 and 328:
Appendix C. SIMSCRIPT Reference Syn
- Page 329 and 330:
Appendix C. SIMSCRIPT Reference Syn
- Page 331 and 332:
Appendix C. SIMSCRIPT Reference Syn
- Page 333 and 334:
Appendix C. SIMSCRIPT Reference Syn
- Page 335 and 336:
Appendix C. SIMSCRIPT Reference Syn
- Page 337 and 338:
Appendix C. SIMSCRIPT Reference Syn
- Page 339 and 340:
Appendix C. SIMSCRIPT Reference Syn
- Page 341 and 342:
Appendix C. SIMSCRIPT Reference Syn
- Page 343 and 344:
Index A a group of ... fields claus
- Page 345 and 346:
Index Mark.v variable..............
- Page 347 and 348:
Index variance ....................