MEASURING WATER USE IN A GREEN ECONOMY - UNEP
MEASURING WATER USE IN A GREEN ECONOMY - UNEP
MEASURING WATER USE IN A GREEN ECONOMY - UNEP

Create successful ePaper yourself
Turn your PDF publications into a flip-book with our unique Google optimized e-Paper software.
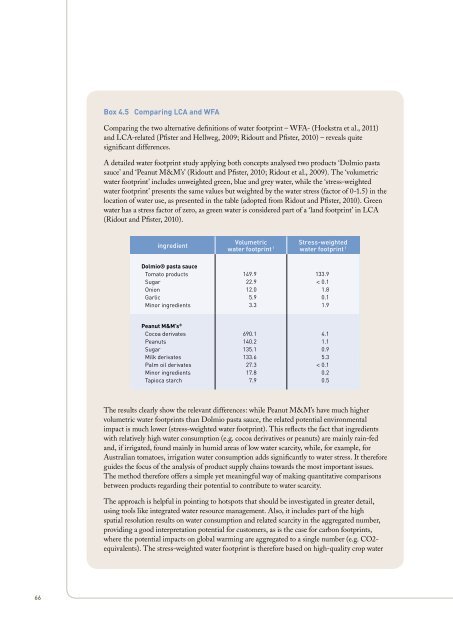
Box 4.5 Comparing LCA and WFA<br />
Comparing the two alternative definitions of water footprint – WFA- (Hoekstra et al., 2011)<br />
and LCA-related (Pfister and Hellweg, 2009; Ridoutt and Pfister, 2010) – reveals quite<br />
significant differences.<br />
A detailed water footprint study applying both concepts analysed two products ‘Dolmio pasta<br />
sauce’ and ‘Peanut M&M’s’ (Ridoutt and Pfister, 2010; Ridout et al., 2009). The ‘volumetric<br />
water footprint’ includes unweighted green, blue and grey water, while the ‘stress-weighted<br />
water footprint’ presents the same values but weighted by the water stress (factor of 0-1.5) in the<br />
location of water use, as presented in the table (adopted from Ridout and Pfister, 2010). Green<br />
water has a stress factor of zero, as green water is considered part of a ‘land footprint’ in LCA<br />
(Ridout and Pfister, 2010).<br />
ingredient<br />
Volumetric<br />
water footprint 1<br />
Stress-weighted<br />
water footprint 1<br />
Dolmio® pasta sauce<br />
Tomato products<br />
Sugar<br />
Onion<br />
Garlic<br />
Minor ingredients<br />
149.9<br />
22.9<br />
12.0<br />
5.9<br />
3.3<br />
133.9<br />
< 0.1<br />
1.8<br />
0.1<br />
1.9<br />
Peanut M&M’s ®<br />
Cocoa derivates<br />
Peanuts<br />
Sugar<br />
Milk derivates<br />
Palm oil derivates<br />
Minor ingredients<br />
Tapioca starch<br />
690.1<br />
140.2<br />
135.1<br />
133.6<br />
27.3<br />
17.8<br />
7.9<br />
4.1<br />
1.1<br />
0.9<br />
5.3<br />
< 0.1<br />
0.2<br />
0.5<br />
The results clearly show the relevant differences: while Peanut M&M’s have much higher<br />
volumetric water footprints than Dolmio pasta sauce, the related potential environmental<br />
impact is much lower (stress-weighted water footprint). This reflects the fact that ingredients<br />
with relatively high water consumption (e.g. cocoa derivatives or peanuts) are mainly rain-fed<br />
and, if irrigated, found mainly in humid areas of low water scarcity, while, for example, for<br />
Australian tomatoes, irrigation water consumption adds significantly to water stress. It therefore<br />
guides the focus of the analysis of product supply chains towards the most important issues.<br />
The method therefore offers a simple yet meaningful way of making quantitative comparisons<br />
between products regarding their potential to contribute to water scarcity.<br />
The approach is helpful in pointing to hotspots that should be investigated in greater detail,<br />
using tools like integrated water resource management. Also, it includes part of the high<br />
spatial resolution results on water consumption and related scarcity in the aggregated number,<br />
providing a good interpretation potential for customers, as is the case for carbon footprints,<br />
where the potential impacts on global warming are aggregated to a single number (e.g. CO2-<br />
equivalents). The stress-weighted water footprint is therefore based on high-quality crop water<br />
66